Pandas: Cannot plot a column against itself
Code Sample, a copy-pastable example if possible
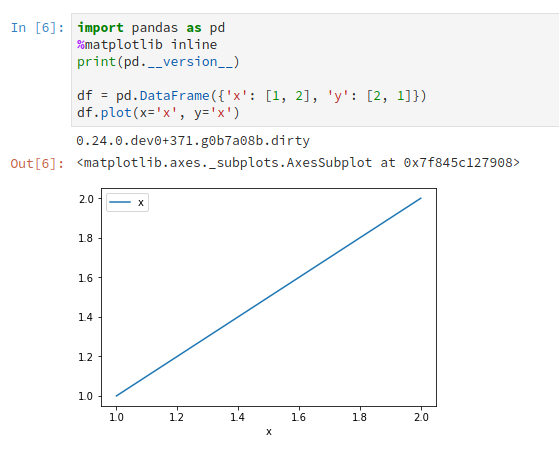
import pandas as pd
df = pd.DataFrame({'x': [1, 2], 'y': [2, 1]})
df.plot(x='x', y='x')
# A similar issue that should be tested once fixed
s1 = pd.Series(range(5), name="x")
s2 = pd.Series(range(10, 15), name="x")  # The following would work with "y" instead
pd.concat([s1, s2], axis=1).plot.scatter(x=0, y=1)
Problem description
The code above produces a KeyError: 'x'
Expected Output
I would expect the above code to produce a line plot that starts at (1, 1) and ends at (2, 2).
Output of pd.show_versions()
[paste the output of pd.show_versions() here below this line]
INSTALLED VERSIONS
commit: None
python: 3.6.5.final.0
python-bits: 64
OS: Linux
OS-release: 4.15.0-29-generic
machine: x86_64
processor: x86_64
byteorder: little
LC_ALL: None
LANG: en_CA.UTF-8
LOCALE: en_CA.UTF-8
pandas: 0.23.1
pytest: None
pip: 10.0.1
setuptools: 39.2.0
Cython: 0.28.3
numpy: 1.14.3
scipy: 1.1.0
pyarrow: None
xarray: None
IPython: 6.4.0
sphinx: None
patsy: 0.5.0
dateutil: 2.7.3
pytz: 2018.3
blosc: None
bottleneck: None
tables: None
numexpr: None
feather: None
matplotlib: 2.2.2
openpyxl: None
xlrd: None
xlwt: None
xlsxwriter: None
lxml: None
bs4: None
html5lib: 1.0.1
sqlalchemy: 1.2.7
pymysql: None
psycopg2: 2.7.4 (dt dec pq3 ext lo64)
jinja2: 2.10
s3fs: None
fastparquet: None
pandas_gbq: 0.4.1
pandas_datareader: None
 danielwlogan
All 11 comments
Two changes:
first change,
df.plot(x='x', y='x') ==> df.plot(x='x', y='y')
second change, if you expect a line from (1,1) to (2,2) ==> change series
df = pd.DataFrame({'x': [1, 2], 'y': [1, 2]})
df.plot(x='x', y='y')
 otro-mas1
on 28 Jul 2018
otro-mas1
on 28 Jul 2018
Thank you for the reply. I have some questions for you.
In your "first change", I don't want to plot y vs x, I want to plot x vs x. So I don't see how that accomplishes what I am looking for.
In your "second change", I do not want to create a new dataframe, I already have valid dataframe and I am simply selecting the columns that I want to plot. There doesn't appear anything in the documentation that would prevent passing the same column name to both the x and the y argument.
I understand that there is a work around (create a copy of the series I want to plot against itself) but it seems that the plot method should be able to handle the plotting without this step.
danielwlogan
on 28 Jul 2018
ok, in that situation I would use the copy.
Good luck
otro-mas1
on 28 Jul 2018
I'm working on a PR that should solve this issue. The plotting method sets 'x' to the index by default. These two lines will allow for x == y
if y == x:
    data[y] = data.index
I've confirmed it works locally
 RobMulla
on 28 Jul 2018
RobMulla
on 28 Jul 2018
Yes, that output is exactly what I would expect. I figured it was something "simple" but hidden in the inner workings of plot(). Hopefully, your PR will make it into the next release. Thanks for tracking down a/the solution.
danielwlogan
on 28 Jul 2018
Just out of curiosity what is the use case for this? This is always just going to be a straight line no? Any practical application?
 WillAyd
on 28 Jul 2018
WillAyd
on 28 Jul 2018
Not sure what @danielwlogan is intending to plot. It will always be a straight line, but if you used style='*' you could see where points sit on the line.
Now that I'm thinking about it, the fix won't work for a situation where df.plot(x='x', y = ['x', 'y']) which it probably should.
Either way, I don't think raising a KeyError: 'x' is the best output.
RobMulla
on 29 Jul 2018
There have been a number of times where this is useful. Most recently this is the situation that I am trying visualize.
I am trying to compare two models, f(t) and g(t). Say f(t) is what is currently done and I want to investigate if g(t) is a better model (e.g. gives a higher value). One way to visualize this is to scatter plot g(t) vs f(t) where each point is a different t. By plotting f(t) vs f(t) it is really clear if the point (f(t1), g(t1)) is above or below that line.
A related example is if you have a known value, x and an estimate of that value, x', then plotting the points (x, x') and overplotting the line x = x again visually shows how good the estimates are.
Furthermore, I believe the current plot() behavior is unnecessarily restrictive.
Good point @RobMulla re: the y list.
danielwlogan
on 29 Jul 2018
is this closed now?
 ishanb97
on 24 Aug 2018
ishanb97
on 24 Aug 2018
No. There's a stalled PR https://github.com/pandas-dev/pandas/pull/22105
 TomAugspurger
on 24 Aug 2018
TomAugspurger
on 24 Aug 2018
Directed here by Triage, but should I focus on jumping to #22105 instead? The self-join bug seems to have been resolved (at least addressed directly) in other issue threads!
 Remnan13
on 16 Oct 2018
Remnan13
on 16 Oct 2018
Related issues
 Ashutosh-Srivastav
·
3Comments
Ashutosh-Srivastav
·
3Comments
 jaradc
·
3Comments
jaradc
·
3Comments
 amelio-vazquez-reina
·
3Comments
amelio-vazquez-reina
·
3Comments
 idanivanov
·
3Comments
idanivanov
·
3Comments
 songololo
·
3Comments
songololo
·
3Comments