Pandas: df.groupby(.).plot.scatter() creates a spurious initial plot
Code Sample, a copy-pastable example if possible
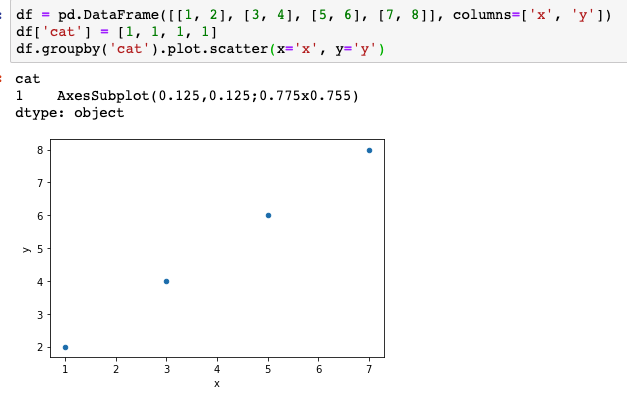
df = pd.DataFrame([[1, 2], [3, 4], [5, 6], [7, 8]], columns=['x', 'y'])
df['cat'] = [1, 1, 1, 1]
df.groupby('cat').plot.scatter(x='x', y='y')
Problem description
The above creates 2 plots rather than one (notice there is only one category).
Tested in Jupyter 5.4.0 with %matplotlib inline.
Expected Output
A single plot.
Output of pd.show_versions()
INSTALLED VERSIONS
commit: None
python: 3.5.3.final.0
python-bits: 64
OS: Linux
OS-release: 4.9.0-6-amd64
machine: x86_64
processor:
byteorder: little
LC_ALL: None
LANG: it_IT.UTF-8
LOCALE: it_IT.UTF-8
pandas: 0.24.0.dev0+141.gf1ffc5fae
pytest: 3.5.0
pip: 9.0.1
setuptools: 39.2.0
Cython: 0.25.2
numpy: 1.14.3
scipy: 0.19.0
pyarrow: None
xarray: None
IPython: 6.2.1
sphinx: 1.5.6
patsy: 0.5.0
dateutil: 2.7.3
pytz: 2018.4
blosc: None
bottleneck: 1.2.0dev
tables: 3.3.0
numexpr: 2.6.1
feather: 0.3.1
matplotlib: 2.2.2.post1153+gff6786446
openpyxl: 2.3.0
xlrd: 1.0.0
xlwt: 1.3.0
xlsxwriter: 0.9.6
lxml: 4.1.1
bs4: 4.5.3
html5lib: 0.999999999
sqlalchemy: 1.0.15
pymysql: None
psycopg2: None
jinja2: 2.10
s3fs: None
fastparquet: None
pandas_gbq: None
pandas_datareader: 0.2.1
 toobaz
All 5 comments
This seems to happen because of this line:
What the Cython code seems to be doing is that it initially runs the function (in this case scatter) on the first group to check if there's no segmentation fault, and then loops through all groups (including the one that it just ran) and applies the function to them. So you always end up with one extra plot.
I think the solution is probably to save the output of first run and skip it during the loop.
If no one else is picking this up I'd be willing to look into it and see if I can come up with a PR.
 javadnoorb
on 16 Jul 2018
javadnoorb
on 16 Jul 2018
@javadnoorb sounds reasonable. PRs are always welcome!
 WillAyd
on 16 Jul 2018
WillAyd
on 16 Jul 2018
I created #21963 to specifically refer to the creation of one plot per category, so that this issue is devoted to the spurious initial plot only (what @javadnoorb is fixing).
toobaz
on 18 Jul 2018
i somehow could not replicate this issue, and seems running code above could correctly do scattering with only a single plot. i think this issue can be closed @TomAugspurger @toobaz this is pandas 0.25
 charlesdong1991
on 10 Aug 2019
charlesdong1991
on 10 Aug 2019
Yes, I think this is fixed. Thanks!
toobaz
on 10 Aug 2019
Related issues
 MatzeB
·
3Comments
MatzeB
·
3Comments
 mfmain
·
3Comments
mfmain
·
3Comments
 andreas-thomik
·
3Comments
andreas-thomik
·
3Comments
 matthiasroder
·
3Comments
matthiasroder
·
3Comments
 tade0726
·
3Comments
tade0726
·
3Comments