Pandas: Missing labels with Timedelta on x-axis
Code Sample, a copy-pastable example if possible
Please see the entire sample in this Gist. Here I'm only copying the code and the output (no data).
import pandas as pd
import matplotlib.pyplot as plt
df = pd.read_csv('pandas_timedelta_plot.csv')
df['deltas'] = pd.to_timedelta(df['deltas'])
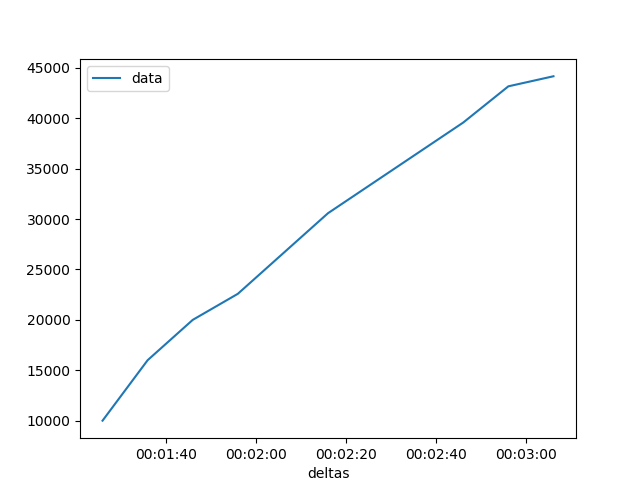
df.plot(x='deltas', y='data')
plt.show()

Problem description
The labels are missing with Timedelta on x-axis.
Expected Output
The labels should be there.
Output of pd.show_versions()
INSTALLED VERSIONS
------------------
commit: None
python: 3.6.4.final.0
python-bits: 64
OS: Linux
OS-release: 4.14.21-1-MANJARO
machine: x86_64
processor:
byteorder: little
LC_ALL: None
LANG: en_US.UTF-8
LOCALE: en_US.UTF-8

pandas: 0.22.0
pytest: None
pip: None
setuptools: 38.5.1
Cython: 0.27.3
numpy: 1.14.0
scipy: 1.0.0
pyarrow: None
xarray: None
IPython: 6.2.1
sphinx: None
patsy: None
dateutil: 2.6.1
pytz: 2018.3
blosc: None
bottleneck: None
tables: None
numexpr: None
feather: None
matplotlib: 2.1.2
openpyxl: None
xlrd: None
xlwt: None
xlsxwriter: None
lxml: None
bs4: None
html5lib: None
sqlalchemy: None
pymysql: None
psycopg2: None
jinja2: 2.10
s3fs: None
fastparquet: None
pandas_gbq: None
pandas_datareader: None
 dniku
dniku
All 14 comments
Note that if I add df = df.head(n=11) the labels reappear. With n=12 they go missing again.
With n=11:
dniku
on 2 Mar 2018
Can you post a version using just NumPy and matplotlib?
 TomAugspurger
on 2 Mar 2018
TomAugspurger
on 2 Mar 2018
@TomAugspurger not sure how to do that. I am confused by the proliferation of time and timedelta types in Python. Which type should I use for x-axis and will I have to use plt.plot_date or something else?
dniku
on 2 Mar 2018
Something like x = np.arange(1, 14, dtype='timedelta64[ns]')
Looks like matplotlib doesn't do any special formatting though.
On Fri, Mar 2, 2018 at 8:56 AM, Pastafarianist notifications@github.com
wrote:
@TomAugspurger https://github.com/tomaugspurger not sure how to do
that. I am confused by the proliferation of time and timedelta types in
Python. Which type should I use for x-axis and will I have to use
plt.plot_date or something else?—
You are receiving this because you were mentioned.
Reply to this email directly, view it on GitHub
https://github.com/pandas-dev/pandas/issues/19965#issuecomment-369942772,
or mute the thread
https://github.com/notifications/unsubscribe-auth/ABQHIktq8BhIAX5ojMPFt6QoyvkFdr5Yks5taV2igaJpZM4SZ9fK
.
TomAugspurger
on 2 Mar 2018
x.dtype is timedelta64[ns] here. No formatting at all.
import pandas as pd
import matplotlib.pyplot as plt
df = pd.read_csv('pandas_timedelta_plot.csv')
df['deltas'] = pd.to_timedelta(df['deltas'])
x = df['deltas'].values
y = df['data'].values
plt.plot(x, y)
plt.show()

dniku
on 2 Mar 2018
However, plot_date sort of works, with extra tuning (and it leaves some garbage in tick labels):
import pandas as pd
import matplotlib.pyplot as plt
df = pd.read_csv('pandas_timedelta_plot.csv')
df['deltas'] = pd.to_timedelta(df['deltas'])
x = df['deltas'].values
y = df['data'].values
plt.plot_date(x, y, '-')
plt.xticks(rotation=30)
plt.show()

dniku
on 2 Mar 2018
Yeah, this looks really weird! Marking as a bug unless we can confirm that it's being caused from another library. Investigation and PR are welcome!
 gfyoung
on 2 Mar 2018
gfyoung
on 2 Mar 2018
I have the same problem. Something is completely off:
ax = df.plot()
xticks = ax.get_xticks()
xticklabels = ax.get_xticklabels()
xticks is in 1/100 seconds and of type np.float64. I am using latest pandas 0.25.0.
xticklabels contains labels with empty strings ''.
Using matplotlib directly works
plt.plot(df.index.values, df.values)
_NOTE: my index is of type np.timedelta64[ns] and print(df.index) has a nice default format!_
 darkdragon-001
on 25 Jul 2019
darkdragon-001
on 25 Jul 2019
I observed this as well. The problem only occurs for plots without a fixed frequency. If I reindex my data to have a fixed frequency the ticks do appear. E.g. in my case something like:
nidx = pd.timedelta_range(start=df.index.min().floor('1s'), end=df.index.max(), freq='1s')
df = df.reindex(nidx, method='nearest')
"fixes" things.
 anarazel
on 25 Jul 2019
anarazel
on 25 Jul 2019
Here's a tiny reproducer:
%matplotlib notebook
import pandas as pd
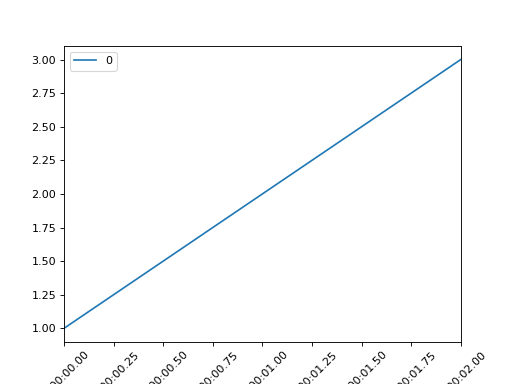
df = pd.DataFrame(index=pd.TimedeltaIndex(['0:0:0.38', '0:0:1.34', '0:0:2.34']), data=[1, 2, 3])
df.plot()
nidx = pd.timedelta_range(start=df.index.min().floor('1s'), end=df.index.max(), freq='1s')
df = df.reindex(nidx, method='nearest')
df.plot(rot=45)

anarazel
on 25 Jul 2019
Thanks for that. Any idea where things are going wrong?
On Thu, Jul 25, 2019 at 3:26 PM Andres Freund notifications@github.com
wrote:
Here's a tiny reproducer:
%matplotlib notebook
import pandas as pddf = pd.DataFrame(index=pd.TimedeltaIndex(['0:0:0.38', '0:0:1.34', '0:0:2.34']), data=[1, 2, 3])
df.plot()nidx = pd.timedelta_range(start=df.index.min().floor('1s'), end=df.index.max(), freq='1s')
df = df.reindex(nidx, method='nearest')
df.plot(rot=45)[image: image]
https://user-images.githubusercontent.com/1598211/61906196-ad4dae00-aedf-11e9-8ed0-233436fd9b87.png[image: image]
https://user-images.githubusercontent.com/1598211/61906208-b2126200-aedf-11e9-90ca-dcba93680f07.png—
You are receiving this because you were mentioned.
Reply to this email directly, view it on GitHub
https://github.com/pandas-dev/pandas/issues/19965?email_source=notifications&email_token=AAKAOIST5K6XKBTYVEQI4RDQBID5XA5CNFSM4ETH27FKYY3PNVWWK3TUL52HS4DFVREXG43VMVBW63LNMVXHJKTDN5WW2ZLOORPWSZGOD22VPUA#issuecomment-515200976,
or mute the thread
https://github.com/notifications/unsubscribe-auth/AAKAOIQNXYKFNQQ7BN2UM5LQBID5XANCNFSM4ETH27FA
.
TomAugspurger
on 25 Jul 2019
Thanks for that. Any idea where things are going wrong?
Not really, yet. I've only recently started using pandas, and haven't looked in the code at all.
I think there's clear evidence that it's pandas fault. With ax_nr from the panda created plot for the dataframe with a non-regular index, and ax_r being the panda created plot with a regular index, I get:
print(ax_nr.xaxis.get_major_formatter(), ax_r.xaxis.get_major_formatter())
<matplotlib.ticker.FixedFormatter object at 0x7fcc6668b610> <pandas.plotting._matplotlib.converter.TimeSeries_TimedeltaFormatter object at 0x7fcc6668bfd0>
which seems to strongly suggest that no formatter is set by pandas in the non-regular case.
anarazel
on 25 Jul 2019
@TomAugspurger
Looking at pandas/plotting/_matplotlib/timeseries.py, there is
def _use_dynamic_x(ax, data):
    freq = _get_index_freq(data)
    ax_freq = _get_ax_freq(ax)

    if freq is None:  # convert irregular if axes has freq info
        freq = ax_freq
    else:  # do not use tsplot if irregular was plotted first
        if (ax_freq is None) and (len(ax.get_lines()) > 0):
            return False

    if freq is None:
        return False

    if isinstance(freq, DateOffset):
        freq = freq.rule_code
    else:
        freq = get_base_alias(freq)
    freq = frequencies.get_period_alias(freq)
...
def _get_index_freq(data):
    freq = getattr(data.index, "freq", None)
    if freq is None:
        freq = getattr(data.index, "inferred_freq", None)
        if freq == "B":
            weekdays = np.unique(data.index.dayofweek)
            if (5 in weekdays) or (6 in weekdays):
                freq = None
    return freq
which is called by
class LinePlot(MPLPlot):
...

    def _is_ts_plot(self):
        import pdb
        pdb.set_trace()
        # this is slightly deceptive
        return not self.x_compat and self.use_index and self._use_dynamic_x()

    def _use_dynamic_x(self):
        from pandas.plotting._matplotlib.timeseries import _use_dynamic_x

        return _use_dynamic_x(self._get_ax(0), self.data)
Without is_ts_plot() returning true, the plot isn't drawn via _ts_plot() and thus
        # set date formatter, locators and rescale limits
        format_dateaxis(ax, ax.freq, data.index)
is never called.
anarazel
on 25 Jul 2019
Is it possible to use format_dateaxis in a way to correct the labelling after it has been plotted or a different way to fix or work around the issue without reindexing? I tried it somewhat afterwards, but it seems the ticks are already wrong by that point, and as such, I'd have to fix the ticks before going further.
 thor
on 20 May 2020
thor
on 20 May 2020
Related issues
 idanivanov
·
3Comments
idanivanov
·
3Comments
 songololo
·
3Comments
songololo
·
3Comments
 ebran
·
3Comments
ebran
·
3Comments
 MatzeB
·
3Comments
MatzeB
·
3Comments
 scls19fr
·
3Comments
scls19fr
·
3Comments
Most helpful comment
@TomAugspurger
Looking at
pandas/plotting/_matplotlib/timeseries.py, there iswhich is called by
Without
is_ts_plot()returning true, the plot isn't drawn via_ts_plot()and thusis never called.