P5.js: New function to display table on canvas in nice format
How would this new feature help increase access to p5.js?
I think it would be nice to have a function that takes a table and displays it to a canvas like an MS Excel or Google sheets
Most appropriate sub-area of p5.js?
- [ ] Accessibility (Web Accessibility)
- [ ] Build tools and processes
- [ ] Color
- [ ] Core/Environment/Rendering
- [ ] Data
- [ ] DOM
- [ ] Events
- [ ] Friendly error system
- [ ] Image
- [x] IO (Input/Output)
- [ ] Localization
- [ ] Math
- [ ] Unit Testing
- [ ] Typography
- [ ] Utilities
- [ ] WebGL
- [ ] Other (specify if possible)
New feature details:
Perhaps some new function like
printTable(table1) or
table1.print()
Does a js library already exist that does the same thing ?
 TanishqPal
All 7 comments
Welcome! 👋 Thanks for opening your first issue here! And to ensure the community is able to respond to your issue, be sure to follow the issue template if you haven't already.
![welcome[bot] picture](https://avatars0.githubusercontent.com/in/4141?v=4&s=40) welcome[bot]
on 15 Nov 2020
welcome[bot]
on 15 Nov 2020
I think this is out of scope for p5.js but such a functionality would fit very well in an addon library or even a standalone library creating HTML <table> elements directly (maybe such a thing already exist).
 limzykenneth
on 16 Nov 2020
limzykenneth
on 16 Nov 2020
Canvas vs HTML
Ooh! I'm actually working on a library now that can display and style tables, and I need to decide if I should display them on the canvas, if I should display them as HTML tables, or if I should try to do both. Do you have a preference?
What I have so far
Specifically, I'm refactoring (and eventually extending) a library that I originally wrote in ProcessingJS, so that it will work as a p5 community library. The library is currently called visualODE, since it's developed for visualizing ordinary differential equations, but it will have to have basic table functionality as a part of that. (I imagine the table functionality could be spun off as a separate library if that would be helpful.)
The ProcessingJS version of visualODE displays tables on the canvas, with default or custom styling. You can view a working demo of it on Khan Academy; the table examples are in Part 3 of the demo, starting on Scene 31 (you can navigate there by clicking the next button on the bottom right of the canvas).
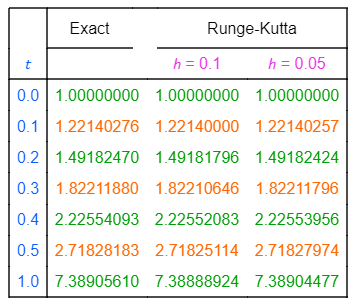
An example of a table displayed on the canvas with custom styling is below.
Scene 43 of the linked demo shows a possible use case for a canvas table (basically, displaying the table on the canvas may be helpful in cases where the table is to be displayed and interacted with alongside a graph or other visualization).
Code for a simpler table with default formatting (from Scene 32 in the demo) is below. This table is also displayed on the canvas. Here, the table data are passed in individually, but they can also be passed in via an array. (The exact syntax may change, since I'll probably want to use a p5.Table object when I develop the library in p5.)
//create table
beginTable("rows"); //data interpreted as rows
tableData("x", -2, -1, 0, 1, 2);
tableData("y", 4, 1, 0, 1, 4);
endTable();

//set (X, Y) position of table's top left corner
setTablePosition(20, 100);

//draw table
drawTable();
This results in the table below.

Advantages of HTML?
On the other hand, HTML tables might be more accessible in general, e.g. for users who rely on screen readers, and there may be other advantages.
I haven't researched the trade-offs but would love to hear from anyone with more expertise in this area! If you (@TanishqPal) have a reason for wanting the tables to appear on the canvas, rather than as HTML tables, it'd be super helpful if you could explain why.
 GregStanton
on 24 Nov 2020
GregStanton
on 24 Nov 2020
@GregStanton Sound like a really interesting project!
Your analysis of canvas vs HTML table are pretty much on point and it is a trade off between ease of interactibility/interoperability with the canvas and accessibility. In the ideal world, both would be an option so the user can choose to render the tabular data either in canvas or as HTML table but that might take some work though.
limzykenneth
on 24 Nov 2020
@limzykenneth Thanks so much for the feedback and for sharing your expertise! I'm really glad you think the project sounds interesting :) I may need to prioritize either canvas tables or HTML tables in the short term, but it would be nice to implement both options in the long term, since that seems to be ideal as you suggested.
GregStanton
on 25 Nov 2020
I'm closing the issue for organizational purpose but feel free to continue the discussion here if needed.
limzykenneth
on 25 Nov 2020
Hi @GregStanton sorry for replying very late
Your project really intrigues me.
I actually have do not have any reason for wanting canvas table Now that I think about it, HTML table would be nicer because of the ease of modification of styles. Also as you mentioned HTML is more accessible.
How can I help you in the project ?
TanishqPal
on 10 Dec 2020
Related issues
 NamanSharma5
·
3Comments
NamanSharma5
·
3Comments
 stalgiag
·
3Comments
stalgiag
·
3Comments
 Patchy12
·
3Comments
Patchy12
·
3Comments
 swirly
·
3Comments
swirly
·
3Comments
 kartikay-bagla
·
3Comments
kartikay-bagla
·
3Comments
Most helpful comment
I think this is out of scope for p5.js but such a functionality would fit very well in an addon library or even a standalone library creating HTML
<table>elements directly (maybe such a thing already exist).