I'm experiencing short freezes, lags etc. on lazer. It only happens since the latest few builds (I'm not quite sure since when, last time I tried out stuff was long ago).
This problem appears only with unlimited fps + fullscreen. So I've got both logs of where it runs fine and where it doesn't. I added to the filenames, which is what, but i honestly haven't really seen anything there which could relate to the problem. But check them anyway.
if even the shutters happen, the keys won't get recognized.
nofullscreen-performance-gamethread.update.log
nofullscreen-runtime.log
nofullscreen-performance-gamethread.audio.log
nofullscreen-performance-gamethread.draw.log
nofullscreen-performance-gamethread.input.log
fullscreen-performance-gamethread.draw.log
fullscreen-performance-gamethread.input.log
fullscreen-performance-gamethread.update.log
fullscreen-runtime.log
fullscreen-performance-gamethread.audio.log
 blauedinoattacke
All 25 comments
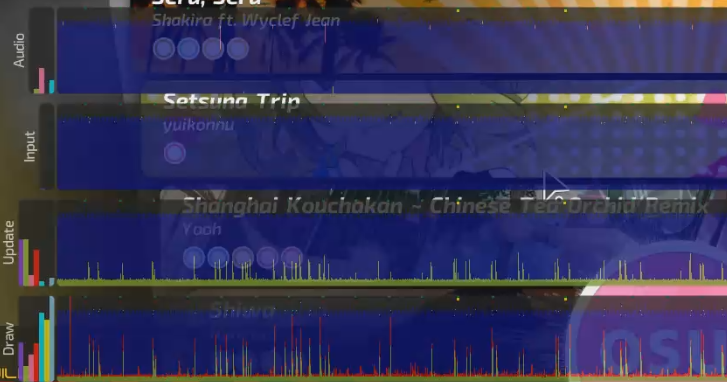
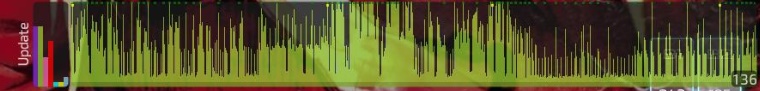
What do your frame graph displays look like? (carl+f11 twice)?
Also please test using a mode that is not unlimited fps. Some GPUs get unstable at high fps.
 peppy
on 11 Jul 2018
peppy
on 11 Jul 2018
Could you also give more details on where you have seen other reports of this issue? could you get these people to also report in this thread?
Could you please make sure you have nocapture software enables? Could you please exit discord and any other applications that may be displaying an overlay?
peppy
on 11 Jul 2018
frame graph display: audio is 1000 constant, input is around 1k, update 4k, draw 2k.
I've tested it with a limiter, it's the same result. And it's only happening in Lazer. Should have mentioned this. Stable client/ other games where I reach high fps work fine. The first logs are with a limiter. I'll try to contact the people, of course. I've actually done that and sent them this issue here. Discord overlay is disabled, I also tried it with closing discord/any other applications with overlay.
blauedinoattacke
on 11 Jul 2018
Oh, and the draw has lots of ups and downs with red lines and green lines, if that helps in any way.
Yet, that still doesn't really explain why the workaround works.. (Take the earlier conversation on the dev discord as reference)
blauedinoattacke
on 11 Jul 2018
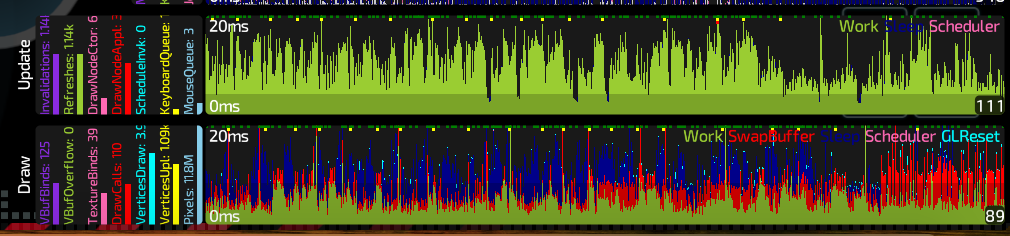
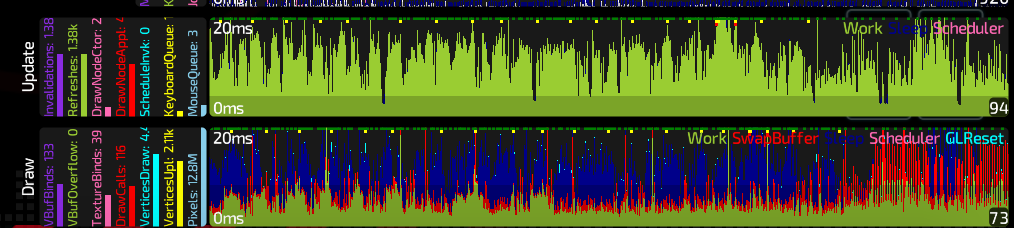
I was hoping for a screenshot of this display, right after a lag spike happens.
That said, this sounds like GPU stalls. This is usually caused by other applications on your PC stalling the pipeline.
peppy
on 11 Jul 2018
Updated ---
Thing is, i tried it with literally everything else closed. Literally nothing else than Lazer ran that time.
blauedinoattacke
on 11 Jul 2018
No frames in that graph are dropping you below 60fps. Your performance logs also don't seem to show an issue. Also, please run tests at the main menu with music paused for consistency.
peppy
on 11 Jul 2018
Will do tomorrow (I'll edit this comment again)
blauedinoattacke
on 11 Jul 2018
i have that issue aswell:
its very extrem on high BPM maps with lots of fast and high density streams such like https://osu.ppy.sh/s/473166
 Lolihunter1337
on 11 Jul 2018
Lolihunter1337
on 11 Jul 2018
That is a slightly different issue (gameplay performance). The one being reported in this thread seems to happen even at the main menu.
Gameplay performance issues are known and will be addressed over time.
peppy
on 11 Jul 2018
It's worth it to try resetting the database, for me lazer feels twice as smooth now (especially in song select), and the db is 3 times the previous size. It feels a lot smoother, though I don't have anything to back this up, except for the old and new db files.
The main thing that's noticeable is that when switching through beatmaps in song select, previously, the loading circle (on beatmap details) showed up basically every time. Now it shows up rarely.
 HoutarouOreki
on 11 Jul 2018
HoutarouOreki
on 11 Jul 2018
The loading circle displays while waiting for online data retrieval.
Resetting the database can not have any effect.
peppy
on 13 Jul 2018
I also experienced serious frame drops during game(you are guaranteed to fail if it freezes during a stream). This seems to happen randomly and from my observation does not correlate with # of notes on screen at that time. Refer to #3036 for my spec. I'm running with default skin and windowed mode. Is it because my laptop is potato by the standards?
Here are some pictures I take right after one of such freezes.
 object022
on 14 Jul 2018
object022
on 14 Jul 2018
Getting these as well, 2019.418.0
I've noticed that these mostly happen after I've been playing for a while, but never right after I start playing. This made me suspicious of the GC, so I went to play and sure enough, I managed to catch it during the act. The lag spike happens right when osu's memory usage drops: https://streamable.com/7v9zb
Only 40% (of 32GB) was being used, as you can see on the vid. Osu was in no way under memory pressure.
I have a couple of ideas that I'll try and test once I have time to play again.
 galister
on 28 Apr 2019
galister
on 28 Apr 2019
You can hit ctrl-f11 to check whether this is actually the case (GC are represented by dots on the graphs, different colours for different severities).
We still have a lot of work to be done on memory optimisation.
peppy
on 28 Apr 2019
I noticed that when starting a song, the memory usage bumps. Parts of the previous gameplays are still in memory? I also noticed that if you don't actually play, just keep starting songs, it'll max out at around 1300MB. If you play songs properly, however, the mem usage is higher. History of recorded clicks/stats maybe?
My theory is that these eventually make it to higher generations before they are cleaned up and so the GC needs to sweep those generations as well. Which is when the lag spikes happen.
I would want to try either:
- Dynamically changing
GCLatencyModetoInteractivewhile in the menu, and toSustainedLowLatencywhile in game. - Incorporating a
GC.Collect()somewhere where a short frame drop wouldn't be noticeable, like ESC menu, end of the song scoreboard, screen change, etc.
I'll try and play around with the source tomorrow.
galister
on 28 Apr 2019
I played around a bit and the best setup I found so far was:
GC.TryStartNoGCRegion()at the beginning ofPlayerLoader.load()GC.EndNoGCRegion()andGC.Collect()inPlayerLoader.playerLoaded()
The loading screen feels smoother, even. It used to collect 10+ times during that time, and now it only collects once at the end. I have not encountered the spikes during play since, but I will want to confirm that when I have a couple of consecutive hours to play.
galister
on 28 Apr 2019
Every now and again I've been getting an The NoGCRegion mode was already in progress exception. I'm guessing there's something else in the code base trying to do the same thing, so I'll stay away.
I eventually only added a single GC.Collect(), at the end of Player.load(), since it's triggered on both restarts and new plays.
I can confidently say that adding this single line prevented lag spikes during my 2 hours of testing.
galister
on 28 Apr 2019
Right now the game is permanently in SustainedLowLatency, which as you probably found is not optimal.
As an initial fix I'd rather not have an explicit GC.Collect call but instead change gc mode depending on the current screen (or if we are going to use NoGCRegion, changing the default mode back to interactive may be a better option).
peppy
on 29 Apr 2019
I've noticed that Interactive can sometimes (though definitely not as often as Batch) can cause short sound stutters or clicks. Which makes sense; if it's freezing the audio thread for long enough, the buffer can end up running dry before the thread wakes back up.
So that's why I thought it's good to put it there. Right before the song starts, the menu audio is no longer playing and the UI is not moving much at all.
I also tried changing GCLatencyMode to Interactive only during loading, and then back to SustainedLowLatency during gameplay and the menu. The end result was about the same as with the explicit GC.Collect() in Player.load(). If this is something you'd want me to test for a longer period of time, let me know.
galister
on 29 Apr 2019
Ok today I'm playing again on 1e192d08c9b3cf7e4dd0f674ecd6b8e9ff914034 build, patched with the one GC.Collect() in Player.load() and I'm getting spikes. So I fired up OBS and again, the spikes are happening in sync with the GC collects.
Note how the memory usage keeps climbing rapidly. There's also a spam of BufferStack usage exceeded allocation messages in performance.log. (The GC messages are mine.)
I think this might be specific to some maps, so I'll keep looking.
galister
on 29 Apr 2019
BufferStack overflows will definitely cause major issues. Please look at how that is occurring rather than GC hacks.
peppy
on 30 Apr 2019
I'm almost certain that the BufferStack errors are caused by the Ctrl-F11 overlay, especially when it is fully open (charts visible).
How I got to this conclusion:
I tried playing the beatmaps I know I used yesterday before the issue appeared. I tried the latest release, then my patched version, and then the current head, 4201cbf8105e0142724c66cd23978a26fc88ba38 (without modification). I played about an hour each with the first 2 and 1:30 with the latter. No sign of the issue. I used release build config for local builds.
I then opened up the Ctrl-F11 and Ctrl-F10 overlays and it triggered the BufferStack spam on the next play.
Relaunched Osu and opened the overlays right away, then started playing. Issue appeared on the first play.
Relaunched again and tried with the Ctrl-F11 overlay in compact mode. Played 2 songs, no lag or messages.
Relaunched once more with Ctrl-F11 overlay on full size. Issue shows on first play.
I would like to add that the build with the GC collect was noticeably smoother. I've encountered lag spikes but they were extremely rare. With the HEAD build they were definitely more frequent.
Hope this helps.
galister
on 30 Apr 2019
The important thing here is identifying why the BufferStack overflow is being arrived at. I'd see if you can reproduce at the framework side and then breakpoint to try and find out why objects are not being returned to the BufferStack before it gets exhausted (generally all usages of it ensure returns do happen, so it is likely specific to your environment).
Check out FrameStatisticsDisplay.timeBarImages. Either uploads are not happening fast enough, or the 100 allocation count is too low (try increasing and see if it fixes).
peppy
on 2 May 2019
Closing this performance issue as too stale to be actionable now.
 Joehuu
on 7 Dec 2020
Joehuu
on 7 Dec 2020
Related issues
 stageosu
·
3Comments
stageosu
·
3Comments
 smileyhead
·
3Comments
smileyhead
·
3Comments
 czapek1337
·
3Comments
smileyhead
·
3Comments
czapek1337
·
3Comments
smileyhead
·
3Comments
 lenzfilipski
·
3Comments
lenzfilipski
·
3Comments
Most helpful comment
You can hit ctrl-f11 to check whether this is actually the case (GC are represented by dots on the graphs, different colours for different severities).
We still have a lot of work to be done on memory optimisation.