Hi,
it is a little bit vague, but I have the impression that Orleans gets slower over time.
My specs are:
- .NET Core 2.0
- Running on Kubernetes in GCloud, 2 Nodes/Silos
- Co-Hosted with ASP.NET Core
I have a very simple grain, that just returns the snapshot (my own state system):
I use my own serializer with JSON.NET and my benchmarks show that the serialization takes 2-3 ms usually. I also tested it with 100x larger states that expected and the performance is great.
I added some profiling to the client side and I have experienced that the call takes 4-5 ms after I deploy it and several days later up to 200ms or even more (the max I have seen is 10seconds).
I also checked my MongoDB logs where I save all slow queries and there is nothing related.
I am a little bit lost.
 SebastianStehle
All 84 comments
that seems odd. do you have memory dump from the server? if logs cannot give us anything with good insight, maybe memory dump will, because this looks like something slowly grow bad in the server.
Or do you monitor the memory and cpu use on the server? that might be an easier starting point than memory dump
 xiazen
on 24 Apr 2018
xiazen
on 24 Apr 2018
Sorry, it is kubernetes cluster. No idea how to get a memory dump from the process. I observe the monitor and cpu usage, but there is nothing special.
SebastianStehle
on 24 Apr 2018
There was also a short discussion on gitter and @DarkCow said:
I have noticed increasing timeout's orleans-2.0.0, I have deployed orleans-2.0.0-ci.20180417.4 which includes the replacement threading model by @dVakulen which seems to solve the problem.
As far as I can tell, what I am seeing is that a thread will deadlock/stall, it is hard to find which Orleans function is stalling. But the new threading model seems to be a work stealing queue. #3792
Yes, been in production since 4/19. This is the first I am seeing other people having performance problems after hours of runtime...
Yeah, I went through the pipeline, everything in Orleans is really fast, but there is something else stalling the execution. Are you seeing warning logs about Task ... took elapsed time 0:00:00.4702115 for execution, which is longer than 00:00:00.2000000. Running on thread System.Threading.Thread and then Response did not arrive on time in 00:00:30 for message
I don't see these warning messages for first 12+ hours of runtime, then they start cropping up. orleans-2.0.0-ci.20180417.4 has appeared to of solved it and/or masked it...
SebastianStehle
on 24 Apr 2018
I am seeing a similar issue. I have a 17VM cluster, running on Microsoft server 2012r2, net core 2.0, I am using the standard code-gen serializer, ADO.NET for clustering/storage/reminders. and SimpleMessageStreaming for streams.
The issue
After 12+ hours of runtime, Orleans begins to have problems with grain calls stalling. These grain calls are fine T<12 hours, but stall T>12 hours. Some calls are fast, but they are interleaved with slow grain calls.
Task ... took elapsed time 0:00:00.4702115 for execution, which is longer than 00:00:00.2000000. Running on thread System.Threading.ThreadResponse did not arrive on time in 00:00:30 for message ...
Things I've investigated
- Grain calls are 100% async await, there is no blocking IO calls.
- Trace grain calls to specific grain code. There is no correlation between timeout warnings and code complexity. Some calls are
Return Task.FromResult( State ); - RAM usage, CPU usage and there are no leaks and/or CPU spikes.
- A timeout warning does not correlate to 100% CPU usage.
- Investigate if my code is causing the stall, as far as I can tell there is no correlation between a stall and the grain call. It feels like work is queued to be run, but the TaskScheduler/Thread is blocked
- Run through the Orleans calls on the stack, everything runs/returns very fast.
Things I've tried
- Increase core/ram provisions for VMs,
- Didn't help because I am <10% CPU <50% RAM
- Changing to .NET Framework 4.7.1
- This helps, so does this mean that .NET Core handles threads/locks differently?
- If Framework is handling blocked/stalled thread differently, it might explain it.
- Upgrading to
orleans-2.0.0-ci.20180417.4which is post #3792
- This seems to of fixed/masked the problem. The insight I gathered is that it is a work stealing pool.
- Work stealing leads me to think the blocked/stalled thread is handled better
 DarkCow
on 24 Apr 2018
DarkCow
on 24 Apr 2018
We do get similar issues as @DarkCow had explained as well. Especially timeouts which doesnt get resolved in 30sec, one major thing we had observed is when there are warnings of Queue wait time of xxx start adding up, things start slowing down and timing out.
Our setup
- AWS EC2 instances (8x)
- 3 clusters for each environment (dev, staging, prod)
- Dynamo Db for persistence state
- Persistent Streams are on DynamoDb as well (we are changing this to SmS on next deploy to test it out)
- We have 4 apps using orleans
- 4-8 silo instances (not all apps are the same)
- Currently using Docker Swarm (kubi soon)
- Docker base image for silo is
microsoft/dotnet:2.0-runtimewhich is Linux - Running on .NET Core 2
- Orleans version 2.0.0-rc2
Observations/info
- Our CPU usage are quite low <15%
- Our network in/out seems a bit high (and most of the time on a particular node is ~2.5x higher, and 2 seems to have no load at all)
- We have 4 apps, most of them get the same issue (especially 2 of them which have higher load)
- All environments get the same problems, fortunately prod seems to be more stable - instance types are bigger 1 level bigger
- We dont have too many consumers yet (so requests arent high)
- We do need to reboot at least once weekly especially on 2 specific apps (on prod)
- We have alerts for
Queue wait time oflog warning, and when that gets triggered, generally we need to reboot or things get slowing down - Timeouts doesnt seem to happen only in our grains but also on
PubSubRendezvousGrain
PubSubRendezvousGrain - Timeout exception log

PubSubRendezvousGrain - Queue wait time warning log

Machine network monitoring

 stephenlautier
on 26 Apr 2018
stephenlautier
on 26 Apr 2018
Just to bring this in here as suggested in gitter, we have been experiencing these timeouts for a while now:
https://github.com/dotnet/orleans/issues/4060
To recap:
8 VMs
1 silo/1 client on each
Client pulls from MSMQ, hardens to file, pushes to grain in silo and awaits processing, deletes file
Clients randomly 'stop' (anywhere from 1-10 days after startup) being able to talk to silos and throw Response did not arrive on time errors
Clients don't all stop at the same time but when the first one stops, all others usually stop within 12 hours
This sometimes happens sporadically from within orleans itself (silo to silo), we can see this when running as a console app.
One of our infrastructure guys mentioned it may be network related in that something isn't being cleaned up/released properly. Whether that's ports or what I'm not sure.
 SebFerraro
on 26 Apr 2018
SebFerraro
on 26 Apr 2018
Is there something we can do to provide you more data?
SebastianStehle
on 27 Apr 2018
I'm catching up with this thread.
Just to make sure. What level of logging are you running Orleans at. We kind of assume that it's normally Info and Debug is only used during development/testing and only for investigations.
I can tell that all our load tests currently run on full .NET Framework, not on .NET Core. We are going to get to running on .NET Core, but it'll take us some time. That's one variable I see that seems to be consistently different from our test environment.
If you could share memory dumps from silos in the "slow" state, that might provide additional insight.
 sergeybykov
on 30 Apr 2018
sergeybykov
on 30 Apr 2018
Until a few days ago I was using Info level, but then I changed it to Warning, because Info does not provide that much helpful information and generates a lot of noise.
SebastianStehle
on 30 Apr 2018
@SebastianStehle @DarkCow @stephenlautier do you have log files which you're able to share with us?
Above you mentioned that 12h is the point at which this happens, @DarkCow - is it suspiciously close to the 12 hour mark or is that a rough estimate?
A memory dump from a slow/stalled process may also prove useful.
 ReubenBond
on 1 May 2018
ReubenBond
on 1 May 2018
I have now been running orleans-2.0.0-ci.20180417.4 which is post #3792 for ~2 weeks and the problem is solved or masked. But I will revert the staging environment back to the worst case scenario which was Orleans 2.0.0 && .NET core 2.0 Will be back with data hopefully by Thursday.
@ReubenBond There is no correlation between time. Just averages out to every 12 hours I had to restart my system.
@sergeybykov I have noticed that the problem is solved/masked in .net framework over .net core.
DarkCow
on 1 May 2018
We'll prioritize load testing on .NET Core higher to try to repro this in house. In the meantime, any relevant logs and memory dumps would be very helpful.
sergeybykov
on 1 May 2018
The longer the running time, the higher this value will be. When it reaches 30 or so, this problem will occur. The initial time is only about 0.3.
 lfzm
on 2 May 2018
lfzm
on 2 May 2018
I experienced the same, especially methods like GetTotalActivationCount() are super slow.
SebastianStehle
on 2 May 2018
I wonder if this is dashboard related? Are people experiencing this without the dashboard enabled?
 richorama
on 2 May 2018
richorama
on 2 May 2018
@richorama we dont have the dashboard installed, so its not related
stephenlautier
on 2 May 2018
@sergeybykov @ReubenBond How is this problem internal test? Our system is so urgent on the Internet now. Is there any plan to solve this problem?
lfzm
on 3 May 2018
@aqa510415008 if the situation is urgent, would you consider trying to use a nightly build from https://dotnet.myget.org/gallery/orleans-ci? @DarkCow has reported that the issue does not appear to affect the nightly builds.
If you are able to help by providing logs or a memory dump then that may help us resolve this sooner.
ReubenBond
on 3 May 2018
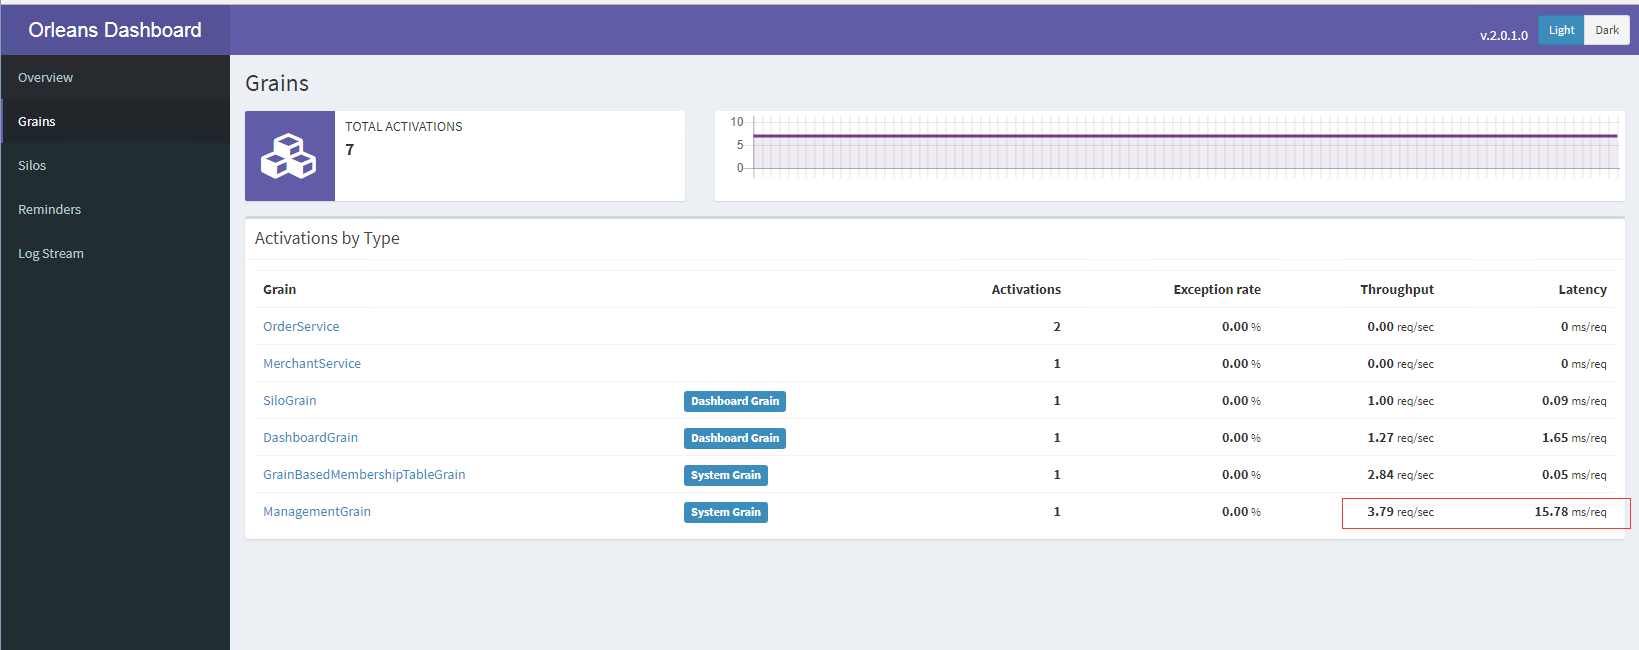
I ran the TestHost project in the OrleansDashboard project overnight. It's an Orleans 2.0.0, 3 silo local cluster with memory providers, running on an i7 quad core with 16GB RAM.
At the start of the run you can see calls to the management grain take <1ms.

After ~11 hours, the management grain is averaging 24ms per request.

It's interesting to note that other grains are not showing signs of running slowly.

Please ignore TestGrain, it has a Task.Sleep to slow it down.
richorama
on 3 May 2018
if someone can guide us on how we can get the memory dump that you'd like to have, we can help with that.
Again we are using docker (linux image)
stephenlautier
on 3 May 2018
Unsure how to do a memdump on Linux, but you ought to be able to execute a command on a running docker container to dump dotnet, which may require installing something first. AFAIK the dotnet images run on Alpine Linux, but I'm not familiar with that.
Status update: I was unable to reproduce this using the dashboard testhost app running a single silo. I'm trying again with a 2-silo app without the dashboard + a simple load generator. I'm running both a .NET Core and .NET 4.6.2 build to verify that this doesn't repro against Framework. I'm also taking memory dumps and logging statistics. Hopefully we can at least repro this tonight. I have one memory dump from @DarkCow which I've been taking a look at, but so far I don't see anything too suspicious: the threads seem to be functioning. I'll keep digging.
ReubenBond
on 5 May 2018
24 hours in using the new test app, I still see no change in latency in either .NET Core or .NET Framework. If there is some random event which causes this issue, then it hasn't been encountered on my host yet. More likely, there is some difference in environments (maybe providers, including telemetry, etc) which explains why I have not been able to reproduce the issue yet. Any thoughts on what those differences might be?
For now, the work-around would be to run the latest nightly, which apparently does not exhibit this problem.
The test app in its entirety is here: https://gist.github.com/ReubenBond/20aad47ce739c5d2a07f12a1a3d8c168 - maybe someone can spot what's missing. The fact that the silos/client are hosted in the same AppDomain might be an issue, but it seems unlikely (still communicating using TCP, but over localhost)
ReubenBond
on 6 May 2018
@ReubenBond How to give you a memory dump file?
lfzm
on 7 May 2018
 jonathansant
on 14 May 2018
jonathansant
on 14 May 2018
@aqa510415008 [email protected]
ReubenBond
on 16 May 2018
Any update on this issue? We encountered the same sympthoms after upgrading to Oreleans 2 (on service fabric) and had to rollback to Orleans 1.5 due to slowness that increases over time
 guysegal
on 23 May 2018
guysegal
on 23 May 2018
@ReubenBond The memory dump file has been sent to you. Is there any problem?
lfzm
on 23 May 2018
Since upgrading to Orleans2 we have had general slowness in writing grain state. We tried to pin down the issue and we gauged the time it took for us to write jsons of about 1mb each to azure blob storage and the mean went up from about 100ms to 400ms in peak times.
We looked in the blob storage to see if the data got any larger but it was about the same size (1mb).
We suspected the upgrade to orleans2 to be the cause and when we downgraded back to orleans1 the write time got back to normal (this was the only change we made) so if the cause was something else the downgrade should not have effected this.
This is the graph of the writeStateAsync() time from one of our grains "expert-grain":

We noticed that after restarting the nodes the write time goes down for a few hours before going up again (we used a script to restart the nodes every 4 hours for that reason).
Any suggestions to how we can investigate this further?
 Gabrn
on 23 May 2018
Gabrn
on 23 May 2018
@guysegal & others, I haven't been able to reproduce this. Could you please describe your applications, focusing on which features of Orleans your apps are using, eg: storage + which provider, streams + which provider, clustering + which provider, where the clients are hosted (eg, alongside ASP.NET Core?), or any other details which might help me to reproduce this.
In the meantime, the apparent workarounds are:
- Use nightly builds: https://dotnet.myget.org/gallery/orleans-ci (new scheduler)
- Use .NET Framework instead of .NET Core
This issue has not been exposed during load tests on .NET Core yet.
You can capture a dump using Visual Studio (in Debug menu, Attach to Process, Break All, Save Dump As) or MemoScope.NET (free), or dotMemory (trial/paid), or Task Manager (right-click, Create dump file). I'm not sure how you capture a dump from within a docker container.
From the two sets of dumps which I have received, I see:
- Both co-host with ASP.NET Core/Kestrel (maybe only because of Orleans Dashboard?)
- Both use AdoNet for something (one for clustering, persistence, & reminders, the other for reminders only
- Both have Orleans Dashboard
- @aqa510415008, one of your silos has around 71K
Task<Task>instances from the dashboard. @aqa510415008 could you try running without the dashboard and produce another memory dump from a slowed silo? On your silo, I see at least 30 threads blocked in dashboard code as well as 72 threads blocked trying to write to the console viaConsoleLogger. 64 of those threads are logging due to a request timeout. I also see lock contention onCatalog.activationsfrom two threads, one waiting on this lock and another in the for-loop inside. The thread in the for-loop is contending with an activation lock inActivationData.GetRequestCount, but that lock is taken byActivationData.EnqueueMessage, which is waiting onConsoleLoggercontention. I can't see a deadlock here, but I see a lot of contention. - @DarkCow I see 30 threads blocked in dashboard code in one of your memdumps, too. The other dumps look fine - just fairly idle silos.
As we know, not everyone experiencing this has the Dashboard installed, so we believe that is not the issue.
Again, any more information would be useful.
ReubenBond
on 23 May 2018
@Gabrn, my suspicion was that something in Azure Storage was causing increasing delays, but these two memory dumps that I have aren't using Azure Storage.
Are you able to attach a profiler to one of your slow silos to see where they are spending time? Can you create a minimal sample which demonstrates the slowdown you're experiencing? That would help me to diagnose it locally.
ReubenBond
on 23 May 2018
@aqa510415008 Can you share the memdump with the Dashboard team too? (I support @richorama to maintain it)
SebastianStehle
on 23 May 2018
We made a lot of improvements to the Dashboard. I would test the new version 2.0.5.
SebastianStehle
on 23 May 2018
@SebastianStehle Yes, but I don't have a dashboard team email
lfzm
on 24 May 2018
@ReubenBond I optimized the code,
1, the call is frequently added method [AlwaysInterleave]
2, Orleans dashboard upgrade 2.0.3 version
The situation is much better now no longer in the case of overtime, the phenomenon of running a busy week is growing slowly.
I suspect that the blockage of the Orleans dashboard may have been caused by the #4178 problem.
lfzm
on 24 May 2018
We are seeing similar issues. The only thing that's changed recently is my code is now stable enough that it runs for longer periods of time without having to be restarted 😬 I'll post as much information as I can.
Environment:
CentOS 7
Orleans 2.0.0
.NET Core 2.0
Not using the Orleans Dashboard
Silo was started at 2018-05-24 07:37:41.245 GMT, this issue is showing errors starting today (May 30, 2018) at 14:42 GMT

Note that I picked RegisterProducer mostly randomly, though it shows that this issue is impacting (my) user code, and Orleans code alike. Suspect it's either a memory pressure issue (unlikely) or a thread issue which describes more of what's been reported above.
The first spike occurs at 14:42. Here is what was going on in the logs at that time (I was only logging at INFO unfortunately)
2018-05-30 14:42:19.6069|INFO|Orleans.LifecycleSubject|Starting lifecycle stage 1000 took 10 Milliseconds
2018-05-30 14:42:19.6069|INFO|Orleans.LifecycleSubject|Starting lifecycle stage 2000 took 0 Milliseconds
2018-05-30 14:42:19.7144|INFO|Orleans.LifecycleSubject|Starting lifecycle stage 1000 took 10 Milliseconds
2018-05-30 14:42:19.7144|INFO|Orleans.LifecycleSubject|Starting lifecycle stage 2000 took 0 Milliseconds
2018-05-30 14:42:19.7144|INFO|Orleans.LifecycleSubject|Starting lifecycle stage 1000 took 10 Milliseconds
2018-05-30 14:42:19.7144|INFO|Orleans.LifecycleSubject|Starting lifecycle stage 2000 took 0 Milliseconds
2018-05-30 14:42:19.7253|INFO|Orleans.LifecycleSubject|Starting lifecycle stage 2000 took 166 Milliseconds
2018-05-30 14:42:34.5032|INFO|Orleans.Runtime.Dispatcher|Intermediate NonExistentActivation for message Request S127.0.0.1:11111:264843461*grn/C57BE023/23f8a586@d4b6ca8c->S127.0.0.1:11111:264843461*grn/716E8E94/99c798a3+SMSProvider_player@a57e64b8 #767033: , with Exception Orleans.Runtime.Catalog+NonExistentActivationException: Non-existent activation: [ActivationAddress: S127.0.0.1:11111:264843461*grn/716E8E94/99c798a3+SMSProvider_player@a57e64b8, Full GrainId: [GrainId: *grn/716E8E94/17d96bb84c0400087bc072c199c798a306000000716e8e94+SMSProvider_player-0x6CA98AA3, IdCategory: KeyExtGrain, BaseTypeCode: 1903070868 (x716E8E94), PrimaryKey: 4c040008-6bb8-17d9-a398-c799c172c07b (x{0x4c040008,0x6bb8,0x17d9,{0xa3,0x98,0xc7,0x99,0xc1,0x72,0xc0,0x7b}}), UniformHashCode: 1823050403 (0x6CA98AA3), KeyExtension: SMSProvider_player], Full ActivationId: @4e2b474d003b04696baf0563a57e64b80000000000000000], grain type: Orleans.Streams.PubSubRendezvousGrain.
   at Orleans.Runtime.Catalog.GetOrCreateActivation(ActivationAddress address, Boolean newPlacement, String grainType, String genericArguments, Dictionary`2 requestContextData, Task& activatedPromise)
   at Orleans.Runtime.Dispatcher.ReceiveMessage(Message message)
2018-05-30 14:42:34.5114|INFO|Orleans.Runtime.Dispatcher|Trying to forward after Non-existent activation, ForwardCount = 0. Message Request S127.0.0.1:11111:264843461*grn/C57BE023/23f8a586@d4b6ca8c->S127.0.0.1:11111:264843461*grn/716E8E94/99c798a3+SMSProvider_player@a57e64b8 #767033: .

2018-05-30 14:42:47.9953|INFO|Orleans.RuntimeSiloLogStatistics|Statistics: ^^^
App.Requests.Latency.Average.Millis=390.000
App.Requests.LatencyHistogram.Millis=[0.0512:0.1023]=1, [0.1024:0.2047]=4053, [0.2048:0.4095]=265245, [0.4096:0.8191]=30916, [0.8192:1.6383]=10944, [1.6384:3.2767]=26036, [3.2768:6.5535]=21542, [6.5536:13.1071]=95050, [13.1072:26.2143]=87603, [26.2144:52.4287]=93339, [52.4288:104.8575]=45083, [104.8576:209.7151]=20255, [209.7152:419.4303]=53587, [419.4304:838.8607]=2861, [838.8608:1677.7215]=1167, [1677.7216:3355.4431]=65, [3355.4432:6710.8863]=433, [6710.8864:13421.7727]=18, [13421.7728:26843.5455]=14, [26843.5456:53687.0911]=8837,
App.Requests.TimedOut.Current=8781,      Delta=9
App.Requests.Total.Requests.Current=767049,      Delta=563
Catalog.Activation.Collection.NumberOfCollections.Current=7201,      Delta=4
Catalog.Activation.ConcurrentRegistrationAttempts.Current=23
Catalog.Activation.Created.Current=60317,      Delta=75
Catalog.Activation.CurrentCount=161
Catalog.Activation.Destroyed.Current=60156,      Delta=60
Catalog.Activation.FailedToActivate.Current=1
Catalog.Activation.NonExistentActivations.Current=299,      Delta=1
Catalog.Activation.Shutdown.ViaCollection.Current=58772,      Delta=59
Catalog.Activation.Shutdown.ViaDeactivateOnIdle.Current=1360,      Delta=1
ConsistentRing.AverageRangePercentage=100.000
ConsistentRing.MyRange.RingDistance=x100000000
ConsistentRing.MyRange.RingPercentage=100.000
ConsistentRing.Ring=[S127.0.0.1:11111:264843461 -> <MultiRange: Size=x100000000, %Ring=100.000%>]
ConsistentRing.RingSize=1
Directory.CacheSize=0
Directory.Lookups.Cache.HitRatio=0, Delta=0
Directory.Lookups.Cache.Issued.Current=0
Directory.Lookups.Cache.Successes.Current=0
Directory.Lookups.Full.Issued.Current=68663,      Delta=81
Directory.Lookups.Local.Issued.Current=288788,      Delta=330
Directory.Lookups.Local.Successes.Current=220125,      Delta=249
Directory.Lookups.LocalDirectory.Issued.Current=357451,      Delta=411
Directory.Lookups.LocalDirectory.Successes.Current=220132,      Delta=249
Directory.Lookups.Remote.Received.Current=0
Directory.Lookups.Remote.Sent.Current=0
Directory.PartitionSize=162
Directory.Registrations.Issued.Current=1814,      Delta=1
Directory.Registrations.Local.Current=1814,      Delta=1
Directory.Registrations.Remote.Received.Current=0
Directory.Registrations.Remote.Sent.Current=0
Directory.Registrations.SingleAct.Issued.Current=60317,      Delta=75
Directory.Registrations.SingleAct.Local.Current=60317,      Delta=75
Directory.Registrations.SingleAct.Remote.Received.Current=0
Directory.Registrations.SingleAct.Remote.Sent.Current=0
Directory.Ring=[S127.0.0.1:11111:264843461/8A327320]
Directory.Ring.MyPortion.AverageRingPercentage=100.000
Directory.Ring.MyPortion.RingDistance=0
Directory.Ring.MyPortion.RingPercentage=0.000
Directory.Ring.MyPredecessors=[]
Directory.Ring.MySuccessors=[]
Directory.Ring.RingSize=1
Directory.UnRegistrations.Issued.Current=300,      Delta=1
Directory.UnRegistrations.Local.Current=60432,      Delta=61
Directory.UnRegistrations.Remote.Received.Current=0
Directory.UnRegistrations.Remote.Sent.Current=0
Directory.UnRegistrationsMany.Issued.Current=15217,      Delta=11
Directory.UnRegistrationsMany.Remote.Received.Current=0
Directory.UnRegistrationsMany.Remote.Sent.Current=0
Directory.Validations.Cache.Received.Current=0
Directory.Validations.Cache.Sent.Current=0
Dispatcher.NewPlacement.Current=68656,      Delta=81
Gateway.ConnectedClients.Current=1
Gateway.LoadShedding.Current=0
Gateway.Received.Current=50048,      Delta=50
Gateway.Sent.Current=50047,      Delta=50
Grain.Atlas.Grains.Collectors.CollectionGrain.Current=15
Grain.Atlas.Grains.Collectors.CollectionManagerGrain.Current=2
Grain.Atlas.Grains.Features.PlatformSearchGrain.Current=2
Grain.Atlas.Grains.Features.TitleSearchGrain.Current=2
Grain.Atlas.Grains.OracleGrain.Current=0
Grain.Atlas.Grains.PersonaGrain.Current=5
Grain.Atlas.Grains.PlatformClientGrain.Current=3
Grain.Atlas.Grains.PlayerGrain.Current=66
Grain.Atlas.Grains.TitleAliasGrain.Current=5
Grain.Atlas.Grains.TitleClientGrain.Current=2
Grain.Atlas.Grains.UserGrain.Current=0
Grain.Orleans.Runtime.Versions.VersionStoreGrain.Current=0
Grain.Orleans.Storage.MemoryStorageGrain.Current=10
Grain.Orleans.Streams.PubSubRendezvousGrain.Current=49
Membership.ActiveCluster=[S127.0.0.1:11111:264843461]
Membership.ActiveClusterSize=1
MessageCenter.ReceiveQueueLength=0
MessageCenter.SendQueueLength=0
Messaging.Acceptor.AllocatedSocketEventArgs.Current=1
Messaging.Acceptor.CheckedInSocketEventArgs.Current=0
Messaging.Acceptor.CheckedOutSocketEventArgs.Current=1
Messaging.Acceptor.InUseSocketEventArgs=1
Messaging.Expired.AtDispatch.Current=262,      Delta=1
Messaging.Expired.AtInvoke.Current=373,      Delta=3
Messaging.Expired.AtReceive.Current=0
Messaging.Expired.AtRespond.Current=49
Messaging.Expired.AtSend.Current=8098,      Delta=5
Messaging.Processing.ActivationData.All=0
Messaging.Processing.Dispatcher.Processed.Errors.Direction.OneWay.Current=0
Messaging.Processing.Dispatcher.Processed.Errors.Direction.Request.Current=540,      Delta=2
Messaging.Processing.Dispatcher.Processed.Errors.Direction.Response.Current=21
Messaging.Processing.Dispatcher.Processed.Ok.Direction.OneWay.Current=0
Messaging.Processing.Dispatcher.Processed.Ok.Direction.Request.Current=270516,      Delta=314
Messaging.Processing.Dispatcher.Processed.Ok.Direction.Response.Current=229087,      Delta=266
Messaging.Processing.Dispatcher.Processed.ReRoute.Direction.OneWay.Current=0
Messaging.Processing.Dispatcher.Processed.ReRoute.Direction.Request.Current=9955,      Delta=10
Messaging.Processing.Dispatcher.Processed.ReRoute.Direction.Response.Current=0
Messaging.Processing.Dispatcher.Processed.Total.Current=510119,      Delta=592
Messaging.Processing.Dispatcher.Received.Direction.OneWay.Current=0
Messaging.Processing.Dispatcher.Received.Direction.Request.Current=280713,      Delta=325
Messaging.Processing.Dispatcher.Received.Direction.Response.Current=229108,      Delta=266
Messaging.Processing.Dispatcher.Received.OnActivationContext.Current=377700,      Delta=428
Messaging.Processing.Dispatcher.Received.OnNullContext.Current=132121,      Delta=163
Messaging.Processing.Dispatcher.Received.Total.Current=509821,      Delta=591
Messaging.Processing.IGC.Forwarded.Current=9955,      Delta=10
Messaging.Processing.IGC.ReRoute.Current=0
Messaging.Processing.IGC.Resent.Current=0
Messaging.Processing.IMA.Enqueued.ToActivationContex.Current=377700,      Delta=428
Messaging.Processing.IMA.Enqueued.ToNullContex.Current=132121,      Delta=163
Messaging.Processing.IMA.Enqueued.ToSystemTargetContex.Current=1067422,      Delta=581
Messaging.Processing.IMA.Received.Current=1577243,      Delta=1172
Messaging.Received.BatchSize.PerSocketDirection.GatewayToClient=0.000
Messaging.Received.BatchSize.PerSocketDirection.SiloToSilo=0.000
Messaging.Received.BatchSizeBytesHistogram.Bytes.PerSocketDirection.GatewayToClient=
Messaging.Received.BatchSizeBytesHistogram.Bytes.PerSocketDirection.SiloToSilo=
Messaging.Received.Bytes.Header.Current=6687540,      Delta=6600
Messaging.Received.Bytes.Total.Current=8196889,      Delta=8183
Messaging.Received.Direction.OneWay.Current=0
Messaging.Received.Direction.Request.Current=50048,      Delta=50
Messaging.Received.Direction.Response.Current=0
Messaging.Received.Messages.From.Null.Current=50048,      Delta=50
Messaging.Received.Messages.Total.Current=50048,      Delta=50
Messaging.Received.MessageSizeHistogram.Bytes=[128:255]=50048,
Messaging.Rejected.Request.Current=1
Messaging.Rerouted.OneWay.Current=0
Messaging.Rerouted.Request.Current=50048,      Delta=50
Messaging.Rerouted.Response.Current=0
Messaging.Sent.BatchSize.PerSocketDirection.GatewayToClient=0.000
Messaging.Sent.BatchSize.PerSocketDirection.SiloToSilo=0.000
Messaging.Sent.BatchSizeBytesHistogram.Bytes.PerSocketDirection.GatewayToClient=
Messaging.Sent.BatchSizeBytesHistogram.Bytes.PerSocketDirection.SiloToSilo=
Messaging.Sent.Bytes.Header.Current=7835662,      Delta=7860
Messaging.Sent.Bytes.Total.Current=107711976,      Delta=89189
Messaging.Sent.Direction.OneWay.Current=0
Messaging.Sent.Direction.Request.Current=0
Messaging.Sent.Direction.Response.Current=50047,      Delta=50
Messaging.Sent.LocalMessages.Current=1577243,      Delta=1172
Messaging.Sent.Messages.To.Null.Current=50047,      Delta=50
Messaging.Sent.Messages.Total.Current=50047,      Delta=50
Messaging.Sent.MessageSizeHistogram.Bytes=[128:255]=27873, [256:511]=2763, [512:1023]=440, [1024:2047]=7958, [4096:8191]=9064, [16384:32767]=1949,
Networking.Sockets.GatewayToClient.Duplex.Closed.Current=0
Networking.Sockets.GatewayToClient.Duplex.Opened.Current=1
Networking.Sockets.Silo.Receiving.Closed.Current=0
Networking.Sockets.Silo.Receiving.Opened.Current=0
Networking.Sockets.Silo.Sending.Closed.Current=0
Networking.Sockets.Silo.Sending.Opened.Current=0
Queues.QueueSize.Instantaneous.Scheduler.LevelOne=0
Reminders.AverageTardiness.Seconds=0 Secs
Reminders.NumberOfActiveReminders=0
Reminders.TicksDelivered.Current=0
Runtime.IsOverloaded=False
Runtime.Threads.AsynchAgent.Runtime.GrainDirectory.AdaptiveDirectoryCacheMaintainer`1.Current=1
Runtime.Threads.AsynchAgent.Runtime.GrainDirectory.GlobalSingleInstanceActivationMaintainer.Current=0
Runtime.Threads.AsynchAgent.Runtime.Messaging.GatewayAcceptor.Current=0
Runtime.Threads.AsynchAgent.Runtime.Messaging.GatewayClientCleanupAgent.Current=1
Runtime.Threads.AsynchAgent.Runtime.Messaging.GatewaySender.Current=1
Runtime.Threads.AsynchAgent.Runtime.Messaging.IncomingMessageAcceptor.Current=0
Runtime.Threads.AsynchAgent.Runtime.Messaging.IncomingMessageAgent.Current=3
Runtime.Threads.AsynchAgent.Runtime.Messaging.SiloMessageSender.Current=2
Runtime.Threads.AsynchAgent.Runtime.Scheduler.WorkerPoolThread.Current=9
Runtime.Threads.AsynchAgent.Runtime.Watchdog.Current=1
Runtime.Threads.AsynchAgent.TotalThreadsCreated.Current=21
Scheduler.NumLongQueueWaitTimes.Current=80
Scheduler.NumLongRunningTurns.Current=3
Scheduler.WorkItemGroupCount=175
Serialization.BufferPool.AllocatedBuffers.Current=250
Serialization.BufferPool.BuffersInPool=218
Serialization.BufferPool.CheckedInBuffers.Current=120000,      Delta=115
Serialization.BufferPool.CheckedOutBuffers.Current=120032,      Delta=115
Serialization.BufferPool.DroppedBuffers.Current=0
Serialization.BufferPool.DroppedTooLargeBuffers.Current=0
Serialization.BufferPool.InUse.AllocatedAndNotInPool_Buffers=32
Serialization.BufferPool.InUse.CheckedOutAndNotCheckedIn_Buffers=32
Silo.StartTime=2018-05-24 07:37:41.245 GMT
Storage.Activate.Errors.Current=0
Storage.Activate.Total.Current=0
Storage.Azure.Table.ServerBusy.Current=0
Storage.Clear.Errors.Current=0
Storage.Clear.Latency=0.0199104 Secs
Storage.Clear.Total.Current=1360,      Delta=1
Storage.Read.Errors.Current=0
Storage.Read.Latency=0.0118666 Secs
Storage.Read.Total.Current=36787,      Delta=47
Storage.Write.Errors.Current=1
Storage.Write.Latency=0.0199485 Secs
Storage.Write.Total.Current=53727,      Delta=53
Streams.PubSub.Consumers.Added.Current=21484,      Delta=28
Streams.PubSub.Consumers.Removed.Current=0
Streams.PubSub.Consumers.Total.Current=21484,      Delta=28
Streams.PubSub.Producers.Added.Current=12121,      Delta=14
Streams.PubSub.Producers.Removed.Current=3389,      Delta=2
Streams.PubSub.Producers.Total.Current=8732,      Delta=12
SystemTarget..Current=4
Transactions.Abort.Total.Current=0
Transactions.Commit.Completed.Current=0
Transactions.Commit.InDoubt.Current=0
Transactions.Commit.QueueLength.Current=0
Transactions.Commit.Request.Current=0
Transactions.Start.Completed.Current=0
Transactions.Start.QueueLength.Current=0
Transactions.Start.Request.Current=0
Watchdog.NumHealthChecks.Current=1812,      Delta=1
I'm logging response times of every single grain method, so I can provide a graph for any Orleans grain method upon request.
 lwansbrough
on 31 May 2018
lwansbrough
on 31 May 2018
@ReubenBond We're experiencing the issue quite badly too.
Could you please describe your applications, focusing on which features of Orleans your apps are using, eg: storage + which provider, streams + which provider, clustering + which provider, where the clients are hosted (eg, alongside ASP.NET Core?), or any other details which might help me to reproduce this.
- We're using Azure Storage Provider: Table storage for grain persistence, reminders and membership and Blob storage for PubSub.
- We're using streams with SMS provider. We use out-of-silo stream clients.
- We're using reminders
- We have 3 silos in the cluster. Both silos and all clients are dotnet core 2 linux applications. Hosted in Docker in Kubernetes.
- We run Orleans 2.0.0-beta3
From the two sets of dumps which I have received, I see:
Both co-host with ASP.NET Core/Kestrel (maybe only because of Orleans Dashboard?)
We're not using ASP.NET Core or Kestrel.
Both use AdoNet for something (one for clustering, persistence, & reminders, the other for reminders only
We don't use ADO.NET for anything in Orleans (e.g. grain state, reminders, etc.). However, we do use it (via Dapper) in some custom grains to fetch/store some DB values.
Both have Orleans Dashboard
We don't have it.
my suspicion was that something in Azure Storage was causing increasing delays, but these two memory dumps that I have aren't using Azure Storage.
I had this suspicion too, but recently also found it wrong. Initially each time I saw a slowdown, it was reported by a grain that writes to its state and also saw "Slow access to Azure Table" log messages. However, recently I noticed these slowdowns are happening in grains that don't use any state at all.
My best guess, which also correlates with some of your findings, is Thread/Task pressure due to some internal Orleans bug. We aren't under any considerable load and most interestingly, we had been running in this configuration for a few months until the issue first happened. We did publish code changes tho, but I cannot really correlate the issue with them - the first time the issue happened was in 2-4 weeks since previous release.
The release was to make several grains reentrant and to ensure no API/DB calls are made on the Orleans's thread pool.
Subjectively, the frequency of issue repeating increases over time - from once 1-2 weeks to several times a week. For instance, the last time I was fixing it happened 1 day after the previous time.
Usually the issue happens on a single silo. Once happened, it never goes back to normal until that silo is restarted. It also affects all grains and likely streaming as well running on the silo.
Our delays are quite aggressive - "Queue wait time ..." messages report delays on the order of 30-120 seconds.
 ilyalukyanov
on 13 Jun 2018
ilyalukyanov
on 13 Jun 2018
@ilyalukyanov
We run Orleans 2.0.0-beta3
Can you try it with the latest release (2.0.3)? beta3 is fairly old, and we took quite a number of changes since it.
Even better, can you try a recent CI build from https://dotnet.myget.org/gallery/orleans-ci with the new scheduler rewritten by @dVakulen?
We are in the process of planning for 2.1, and this data would be crucial.
sergeybykov
on 14 Jun 2018
@sergeybykov yeah, upgrade to 2.0.3 is on the radar. I'll share updates when it's done.
I don't think I'll be able to try ci builds as we've not been able to reproduce the issue in test environments, so the version change would need to go to production.
Do you roughly know the timeframe for 2.1 at this stage? I appreciate it's not going to be accurate.
ilyalukyanov
on 14 Jun 2018
Even better, can you try a recent CI build from https://dotnet.myget.org/gallery/orleans-ci with the new scheduler rewritten by @dVakulen?
We are in the process of planning for 2.1, and this data would be crucial.
We're also looking forward for this to be released :)
 shlomiw
on 14 Jun 2018
shlomiw
on 14 Jun 2018
@sergeybykov is the new scheduler included in 2.0.3 ?
because i have a similar issue with management grain(not necessarily may be some other grain) taking several seconds,then callback get delayed for 30 seconds and slowing to a halt.
 mohamedhammad
on 18 Jun 2018
mohamedhammad
on 18 Jun 2018
No, you have to use the nightly builds.
SebastianStehle
on 18 Jun 2018
did it solve your problem ?
mohamedhammad
on 18 Jun 2018
Yes, it is much better with the nightly build.
SebastianStehle
on 18 Jun 2018
the silo is not going down anymore ?
mohamedhammad
on 18 Jun 2018
So far it is stable, but I also made performance improvements in my app and in the dashboard. So it is not easy to say, what had the biggest impact.
SebastianStehle
on 18 Jun 2018
what version of the dashboard you are using for now?
mohamedhammad
on 18 Jun 2018
@sergeybykov @DarkCow this is something i am struggling with and your description is exact
" These grain calls are fine T<12 hours, but stall T>12 hours. Some calls are fast, but they are interleaved with slow grain calls.
Task ... took elapsed time 0:00:00.4702115 for execution, which is longer than 00:00:00.2000000. Running on thread System.Threading.Thread
Response did not arrive on time in 00:00:30 for message ..."
but sometimes it go for days and at some point this pattern starts and i got this "Response did not arrive on time in 00:00:30 for message "
i am using orleans 1.4.2,it is fairly old,do you think upgrade to 2.03 would help or i should get a night build to get the new scheduler ?
mohamedhammad
on 19 Jun 2018
@mohamedhammad I'd suggest to start with 2.0.3, and consider trying nightly if you need to.
took elapsed time 0:00:00.4702115 for execution, which is longer than 00:00:00.2000000.
This is usually a sign of a blocking call (or calls): IO, call to web services, etc. Make sure they are all awaited properly. If grain threads get blocked by such code, timeouts inevitably happen soon after.
sergeybykov
on 19 Jun 2018
@sergeybykov (reviewed code for blockage,it is all awaited)
will try 2.0.3
i think it's better not to use .net core until it is fully tested.
should i use dot net framework ?
mohamedhammad
on 19 Jun 2018
We are in the process of moving our nightly tests to .NET Core. A number of users seem to run totally fine on it. But it's your choice in the end, of course.
sergeybykov
on 19 Jun 2018
A quick update from me with recent findings.
We've migrated all our components to 2.0.3 fairly easily also fixing a couple of minor issues. Planning to deploy changes to production within a month. Thus, my new findings are still on 2.0.0-beta3.
Now that we started to gradually restart the cluster every 24 hours, the issue has become less of a problem, but unfortunately didn't go away completely, which was against our expectations.
It seems like the issue happens for System Targets and Grains pretty much independently, i.e. any of the following states is possible:
- only grains are affected
- only system targets are affected
- both are affected
Often we don't let the issue develop and restart affected silo straight away, so potentially it might still eventually affect both system targets and grains if it didn't when the issue started.
Also I'm no longer sure the amount of time a silo is up is a prerequisite for the issue to happen. Now it seems more like some condition that is just more likely to happen if a silo runs longer. This is based on the following observation.
From ~12am to ~6am is almost dead time for our system when customer-related traffic drops to almost zero. At about 6am it starts to gradually develop to a certain constant (not high) load by 8-9am. Restarts are scheduled to 2am. A couple of times we noticed that the issue was starting on a silo already at 7-1:15am, i.e. after insignificant time from being restarted under insignificant load.
In the absence of customer-related load, the only things running are these two:
- One grain publishing to an SMS stream small messages every 5 seconds and 2 out-of-silo clients subscribed to the stream. Clients additionally call that grain every 10 minutes or so.
- One reminder that triggers every 1 minute (is it too frequent?) and several less frequent reminders (from 10 minutes to monthly).
I doubt this information is very relevant since it's for an outdated version and is very high level, but I thought I would still drop it here in case it helps to shed some light on this vague issue.
ilyalukyanov
on 22 Jun 2018
@ilyalukyanov among others in this thread i'm having the same behaviour,
i will try 2.0.3 if still having the same issue will get a night build in order to get the new scheduler, it is a supposed to help resolve that.
mohamedhammad
on 22 Jun 2018
@ilyalukyanov @mohamedhammad Thank you both for investigating this! Your data for 2.0.3 and nightly CI builds is critical for us, as we still haven't been able to reproduce this issue in the house.
sergeybykov
on 22 Jun 2018
will definitely keep this thread updated.
mohamedhammad
on 22 Jun 2018
Hi all. Writing as a non-expert dev but with a fair bit of experience now with Orleans 2.0.x, I had been struggling with stalling task processing. To date most of my work has been local (on a fast laptop) and I have been interested in stress-testing performance before deploying to real hardware etc. I found however that under sustained stress (> 80% CPU) for minutes, the silo would stop processing requests (CPU usage drops, grain time outs ensure. I should add though that the silo continues writing to the log -it doesn't hang). I varied the persistence (ADO.NET, Azure storage emulator, types of grains being persisted). There was no apparently no pattern to it, and the only solution would be to restart the silo. Naturally, I have scoured my code for Wait()s etc.
Solution: change from .NET Core to Framework for the silo process. Problem gone (or at least, not witnessed since). I can create grains without interruption at sustained high stress. Is there a difference in the task scheduler between the two?
If I can help by providing more information, I am happy to do so. (Not sure where to begin here, I'm afraid...)
Using Orleans 2.0.3, with ADO.NET and SQL Server Express for persistence.
 jballin82
on 25 Jun 2018
jballin82
on 25 Jun 2018
@jballin82 could you share your test project with me?
ReubenBond
on 25 Jun 2018
@ReubenBond @jballin82 would you keep updating this thread with any new findings ,this is very important to me as i am upgrading to 2.0.3 and want to decide to use core or framework.
mohamedhammad
on 25 Jun 2018
@ReubenBond I was afraid you'd ask that, but not immediately possible given some commercial constraints unfortunately. Any suggestions for a way forward? More diagnostic info perhaps?
jballin82
on 25 Jun 2018
@ReubenBond I have made an example which recreates the behaviour. Here are some screenshots of CPU activity:
While running, not yet stalled in Core: Note the erratic spikes.

Tasks stalled, in Core: CPU usage drops to near background level. Note the silo warnings about queue lengths...

Tasks starting, in Full: (it seems to ramp up steadily, fall, ramp again, and then stabilise at 100% after some minutes)

Tasks running in Full; occasional drops but rapid recovery to 100%:

I need to make the example self-contained in a VS solution for you but, once I do, how can I share this with you?
Jamie
jballin82
on 25 Jun 2018
Hugely appreciated, @jballin82.
If you could email it to [email protected], then I'll take a look asap.
EDIT: accidentally closed - serves me right for commenting on mobile at 5am
ReubenBond
on 25 Jun 2018
@jballin82 Thanks for the important info to help demystify the issue!
Have you tried a nightly build from https://dotnet.myget.org/gallery/orleans-ci that has the new scheduler? Other people were saying that it solved the issue for them. It would be interesting to know if that's also true for your case.
I assume you were running both tests with exact same configuration: Server GC, etc. Can you confirm?
sergeybykov
on 25 Jun 2018
@sergeybykov Yes, Sergey, indeed - same config.
I've just sent @ReubenBond the example.
I haven't tried the nightly builds - Orleans is cutting edge enough for me, I'm not quite ready to resort to such measures ;-)
Looking forward to hearing how you get on, (but also hoping I haven't done something totally daft...)
jballin82
on 26 Jun 2018
I suppose the sample in a profiler really helps here, but maybe offering ideas to someone and speculating a bit about the CPU consumption, the situation resembles also contention to some variable. Might be ConcurrentDictionary or a similar construct. I tried to check the latest merges like
https://github.com/dotnet/orleans/pulls?utf8=%E2%9C%93&q=is%3Apr+is%3Amerged+ConcurrentDictionary
https://github.com/dotnet/corefx/pulls?utf8=%E2%9C%93&q=is%3Apr+is%3Amerged+concurrentdictionary
https://github.com/dotnet/corefx/pulls?utf8=%E2%9C%93&q=is%3Apr+is%3Amerged+iocp
And so forth. I see in the CoreFx repo there are threading fixes specifically for SQL Server ADO.NET libraries and elsewhere too, but this problem seem to trouble others too.
 veikkoeeva
on 26 Jun 2018
veikkoeeva
on 26 Jun 2018
@sergeybykov when will the nightly build will be published as a proper nuget package? I hope I understand this right..
guysegal
on 27 Jun 2018
@jballin82 Can you make the example public?
SebastianStehle
on 30 Jun 2018
Update time.
I'm looking at this today. Apologies for the delay, I had issues running the repro from @jballin82 and had no Internet access - fixed now (bought a cellular modem while I wait for Telstra to get their act together.)
The repro uses ASP.NET and I thought that might be somehow important. I see that ASP.NET does create a whole bunch of threads and seems to slow things down on .NET Core significantly... However, ADO.NET is not required to reproduce this and removing the ADO.NET storage provider (swap for in-mem) and running @jballin82's example repo in Release mode allows me to reproduce this more quickly - within about 2 minutes, consistently.
I have not root-caused this yet. I see a very strong correlation between the failure and a (caught) InvalidOperationException from BlockingCollection<T>.TryTakeFromAny(...) (called from WorkQueue.Get()) or BlockingCollection<T>.TryTake() (called from WorkQueue.GetSystem()).
The 'interesting' thing is that the InvalidOperationException has the message "The underlying collection was modified from outside of the BlockingCollection<T>", but the underlying collection is ConcurrentBag<T> and it's constructed directly in the constructor call to the BlockingCollection<T>, i.e: new BlockingCollection<IWorkItem>(new ConcurrentBag<IWorkItem>()). In other words, we don't have any direct access to the underlying collection.
So I'm suspicious of changes to .NET Core's ConcurrentBag<T> implementation. I know a lot of performance work went into optimizing it for .NET Core. Of course, I haven't ruled out either that we're holding it wrong or that this is a red herring and the issue is in some totally separate location.
@jballin82 if you're happy for me to share a modified version of your repro, let me know.
EDIT: s/ConcurrentQueue/ConcurrentBag
xref https://github.com/dotnet/corefx/issues/30781 < I opened an issue in CoreFx for the BlockingCollection behavior.
ReubenBond
on 2 Jul 2018
Please do, @ReubenBond
jballin82
on 2 Jul 2018
Just in case someone wants too browse some changes: https://github.com/dotnet/corefx/pulls?utf8=%E2%9C%93&q=is%3Apr+is%3Amerged+concurrentbag, and the localization variable of that particular error message is https://github.com/dotnet/corefx/blob/c4ebdbe5f5fbf53ec73b2c2e16f610387945151f/src/System.Collections.Concurrent/src/Resources/Strings.resx#L100 .
veikkoeeva
on 2 Jul 2018
https://blogs.msdn.microsoft.com/dotnet/2017/06/07/performance-improvements-in-net-core/
both ConcurrentQueue
and ConcurrentBag were essentially completely rewritten for .NET Core 2.0, in PRs dotnet/corefx #14254 and dotnet/corefx #14126, respectively
To be clear, though, I have not confirmed that this is the root cause - it's just strongly correlated. I will continue with the investigation tomorrow.
Repro: StallingExample.zip
Note that different silo projects run on different package versions and you might need to delete one or more to make it build.
ReubenBond
on 2 Jul 2018
I can confirm that replacing the underlying collection in BlockingCollection<T> to ConcurrentQueue<T> rectifies the issue in the repro. With that, I consider that corefx bug to be the root cause of this issue. I can also confirm that this bug causes items which were added to the queue to become lost from the perspective of TryTake, as demonstrated in this updated gist:
The question now is: do we release 2.0.4 with this fix or do we aim for 2.1?
I do not expect much impact (outside of fixing this bug) when switching from ConcurrentBag<T> to ConcurrentQueue<T>, but there may be subtleties which are not yet apparent to me.
ReubenBond
on 3 Jul 2018
It would be great to have it on 2.0.4..
guysegal
on 3 Jul 2018
Maybe is better to copy the prev implementation of BlockingCollection to orleans source and use it until there is a bug in .net core
 ifle
on 3 Jul 2018
ifle
on 3 Jul 2018
I've opened #4736 with a workaround. It uses a runtime check so that we can preserve the current behavior when running on .NET Framework.
ReubenBond
on 3 Jul 2018
Another update: I needed to make a few changes to the build scripts so that we can create the right 2.0.4 packages. I'll open a PR for those changes tomorrow and try to start the release process so that we can attempt to release this week or early next week.
ReubenBond
on 4 Jul 2018
Hey @ReubenBond have you guys managed to decide on 2.0.4? Even a rough ETA would help. If more development needs to be done and you need hands, I'd be happy to help.
ilyalukyanov
on 13 Jul 2018
We are hoping to release it this week or early next. I misunderstood my teammates' schedules with the last message. Apologies for that.
ReubenBond
on 13 Jul 2018
@ReubenBond any update on this? We really need this fix on production.
 pfrendo
on 18 Jul 2018
pfrendo
on 18 Jul 2018
We have published v2.0.4 to nuget.org. It includes the workaround for the ConcurrentBag issue. Please try it and chime in to let us know if it resolves the issue for you.
A future .NET Core 2.1 servicing release will include the fix for ConcurrentBag, but currently the workaround is needed.
EDIT: apologies for the silence, @pfrendo
ReubenBond
on 20 Jul 2018
For my part, I can confirm that version 2.0.4 solves a huge performance issue I had. it was appearing in less than one minute under load.
Now everything works fine.
Thanks!
 srollinet
on 21 Jul 2018
srollinet
on 21 Jul 2018
Ditto on the performance improvements. Our system was slowing down by about +5 seconds per day. Now it's running smoothly.
lwansbrough
on 22 Jul 2018
Is anyone experiencing memory pressure issues? We started seeing out of memory exceptions after this update (after ~2 days of uptime). Could be my code.
lwansbrough
on 23 Jul 2018
Closing this because the issues appears to have been successfully resolved by the workaround in 2.0.4 😁
Thank you, everyone, so much for your patience and assistance in tracking this down and getting it resolved!
@lwansbrough please feel free to open an issue regarding memory pressure issues
ReubenBond
on 2 Aug 2018
@ReubenBond I can confirm it's working well 5-6 days+ with the same deployment and it's still working well. No memory leaks and exceptions that @lwansbrough mentioned
pfrendo
on 6 Aug 2018
Working for us too! Thanks a lot for fixing!
ilyalukyanov
on 13 Sep 2018
Related issues
 bobanco
·
3Comments
bobanco
·
3Comments
 Vlad-Stryapko
·
3Comments
Vlad-Stryapko
·
3Comments
 jdom
·
3Comments
jdom
·
3Comments
 danvanderboom
·
3Comments
danvanderboom
·
3Comments
 bwanner
·
5Comments
bwanner
·
5Comments
Most helpful comment
It would be great to have it on 2.0.4..