I have a simple clustering proof-of-concept where I run 3 silos, and have a client sending loads of messages. The source code is available and is part of my "Your First Orleans Cluster" article where I describe some of the observations that I point out in this issue.
I am basically creating a lot of random grains in a tight loop. The grain call simply returns a completed task and does nothing else.
while (true)
{
    var grainId = random.Next();
    var grain = GrainClient.GrainFactory.GetGrain<IUselessGrain>(grainId);
    grain.DoNothingAsync();
}
This is so heavy that within a few seconds, at about 50-80 thousand activations, the graph (from the Dashboard) flatlines and the silo effectively dies a silent death. Warnings and errors eventually show up in the console.
I also noticed that the activations seem to be all allocated on the same silo, which is strange given that due to the pseudo-randomness I would expect them to be at least nearly evenly distributed.
I eventually introduced a delay between message calls of 50ms, and it seems to keep up for a while. Even so, I noticed the odd behaviour of activations being allocated to a single node up to around 900-1,000 activations, after which they start getting distributed across other nodes.
I have tried this with both the MembershipTableGrain and SQL Server cluster membership. All silos are running on a single machine.
I realise that I'm effectively abusing the system with this code, but I'm very worried if Orleans can't keep up with a simple stress test of a few tens of thousand grains.
 dandago
All 22 comments
First of all, thank you very much for the blog post, actually a series of them! It's a very good tutorial for people learning about Orleans.
I see several things here.
The biggest one is that the tight loop doesn't await the calls to
DoNothingAsync(). Since it is very cheap to generate such calls, as the line only deep-copies the arguments, and doesn't send a message or even serializes it. So it is very easy to generate a higher message rate than a silo or a couple of silos can handle. The more realistic way to test this kind of scenario is to limit the number of in-flight requests (even if that number is high). We have theAsyncPipelinefor that.Activation of a new grain is a much more expensive procedure than processing a call by an already activated grain. This load generator creates a new grain ID for each call and never reuses the grain after that. This reduces the throughput significantly. A more realistic approach, consistent with most scenarios, is to activate a number of grains (even if a large one), and then send requests to them in a round-robin or some other distribution. Otherwise, you are using Orleans as a stateless system, and then
StatelessWorkergrains would be a better suited choice.Silos can be protected from getting overloaded via load shedding. There's
NodeConfiguration.LoadSheddingEnabledandNodeConfiguration.LoadSheddingLimitsettings for that. By default they are turned off though. With load shedding enabled, a silo will start rejecting client calls once it's CPU utilization consistently exceeds the set limit.In the code in the repo I don't see how you start multiple silos, and how you configure the client for that. I suspect that you start the client before the second (secondary) silo joins the cluster, and that's why you initially see an uneven distribution of grain activations. If you wait for the cluster to form, you should see a random distribution of grains from the start.
Running load generator (client) and silo(s) on the same physical machine is bad for benchmarking because the processes compete for system resources and trash each other's CPU caches. We strongly recommend putting each process on a different physical (or virtual) machine for any kind of serious measurement.
 sergeybykov
on 20 Jun 2017
sergeybykov
on 20 Jun 2017
Thanks @sergeybykov for the insight! You are right in that this wasn't a realistic scenario, and certainly not something I wanted to benchmark (otherwise I wouldn't have run everything on the same machine). What I wanted to achieve was simply to show (for the sake of the article) the distribution of grains across different silos. In doing so, however, I was surprised to observe the behaviour described earlier.
As for how I start the silos and client, it is a manual thing. The configuration is described in the article. If S is a silo and C is the client, I have tried both of the following orders: SCSS and SSSC, obtaining similar results. Having said that, in the latter case, I start the client only one or two seconds after all silos have started.
Some questions arise based on your answers (my numbering below does not follow yours):
- You mention that I "generate a higher message rate than a silo or a couple of silos can handle". What factors influence the limit on what a silo can handle?
- Why do I see the message rate just flatline rather than simply slow down?
- Where I can find more info about this AsyncPipeline? (searching the docs didn't give any results)
- What is a typical message rate I can expect a silo to handle (e.g. number of messages per second)? I'm aware Orleans is sometimes used for IoT or finance, and I believe something like 50 messages per second is not far-fetched in these industries.
- You mention that new activation is expensive, but what about calling
GetGrain<T>()on existing activations? Can I consistently call it to get a grain reference, or should I hold onto grain references?
dandago
on 20 Jun 2017
If S is a silo and C is the client, I have tried both of the following orders: SCSS and SSSC, obtaining similar results. Having said that, in the latter case, I start the client only one or two seconds after all silos have started.
Can you share how you configure secondary silos and the client in the multi-silo case? Are you waiting for the secondary silos to report that they successfully started and joined the primary (in the non-reliable configuration with MembershipTableGrain)?
In the reliable configuration (with SQL or Azure Table) do you wait for all silos to start up and join the cluster before starting the client? Is client also configured with the same cluster membership config?
What factors influence the limit on what a silo can handle?
In almost all case it is CPU, for actual processing of the requests and, as importantly, for serializing/deserializing method arguments. Hence the rate of requests a single silo can sustain may vary between 10K and 100K per second.
Why do I see the message rate just flatline rather than simply slow down?
Is that the rate that the silo reports or the client? I'd have to look at the specific metric. I suspect the silo reaches its capacity and plateaus. But it's hard to be certain without more data.
Where I can find more info about this AsyncPipeline? (searching the docs didn't give any results)
https://github.com/dotnet/orleans/blob/master/src/Orleans/Async/AsyncPipeline.cs. It's used in some tests (e.g. https://github.com/dotnet/orleans/blob/master/test/TesterAzureUtils/Streaming/StreamLimitTests.cs), although the majority of them still aren't on GitHub.
What is a typical message rate I can expect a silo to handle (e.g. number of messages per second)? I'm aware Orleans is sometimes used for IoT or finance, and I believe something like 50 messages per second is not far-fetched in these industries.
I assume you meant 50K. As I mentioned above, it's mostly about CPU cost of processing and serialization. Hence, for example, Immutable or simplification of data structures sent as arguments may help increase throughput.
You mention that new activation is expensive, but what about calling GetGrain
() on existing activations? Can I consistently call it to get a grain reference, or should I hold onto grain references?
GetGrain<T> is very cheap. You can call it every time or hold to the reference to reduce allocations. Either way is fine from the Orleans perspective.
sergeybykov
on 20 Jun 2017
Very helpful discussion, cheers!
 shlomiw
on 21 Jun 2017
shlomiw
on 21 Jun 2017
@sergeybykov I will give you a full reply later. In the meantime I have run another test with 2 silos and no delay. This test spawns only up to 100 random grains, so...
while (true)
{
    var grainId = random.Next(100);
    var grain = GrainClient.GrainFactory.GetGrain<IUselessGrain>(grainId);
    grain.DoNothingAsync();
}
Thus I have eliminated the expensive activation from the picture. After a bit, I see the same behaviour of flatlining, and silos erroring out:
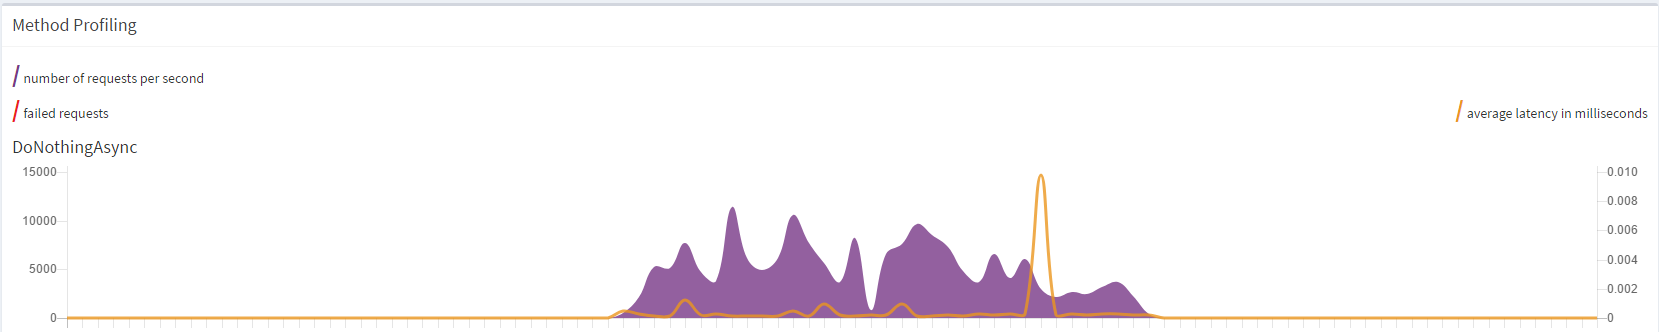
Just wanted to add this while I had the graph at hand.
dandago
on 21 Jun 2017
@sergeybykov
Can you share how you configure secondary silos and the client in the multi-silo case?
For the MembershipTableGrain scenario, it is exactly as described in the article, in the section "Running a 3-Node Cluster". As shown, I am simply varying the ports. The SeedNode is always the same though.
Are you waiting for the secondary silos to report that they successfully started and joined the primary (in the non-reliable configuration with MembershipTableGrain)?
Yes.
In the reliable configuration (with SQL or Azure Table) do you wait for all silos to start up and join the cluster before starting the client? Is client also configured with the same cluster membership config?
I do wait for them to start, and I assume they would have joined the cluster (not sure if they need additional handshaking after that).
I am not configuring the client in any special way in the SQL cluster membership scenario.
Is that the rate that the silo reports or the client? I'd have to look at the specific metric. I suspect the silo reaches its capacity and plateaus. But it's hard to be certain without more data.
It is reported by the silo, and I see it from the dashboard, as shown in my previous comment.
I assume you meant 50K
I actually meant 50 per second, but I'm glad you made that assumption! It means silos should handle a rate of 50k. Pity I can't seem to reach it on a single machine!
dandago
on 23 Jun 2017
Update: did another test with one client on one machine and one silo on another, and random grain ids limited to 1000 (otherwise the code is the same as in my comment with the graph). It behaved well and went up to around 8,000 requests per second. I think we can safely blame CPU since the same test when running both on local will cause the silo to explode.
Since I am only seeing a max of about 8,000 requests per second using minimal code, I suppose the rates of ~50K that you mention are across various silos in a cluster, and not on a single machine?
dandago
on 23 Jun 2017
50k is for a single silo, but in order to maximize throughput you need more then one client.
 gabikliot
on 23 Jun 2017
gabikliot
on 23 Jun 2017
The client can actually be a bottleneck?
dandago
on 23 Jun 2017
Client can only generate a certain amount of load. If u are testing the server, you need to generate enough load to maximize the server throughput. The easiest way is to have a number of clients.
gabikliot
on 24 Jun 2017
This is an excellent discussion. You have given me more insight into Orleans.
I have run similar tests, in my case I am using the dotnet variant (i.e. currently v2.0 TP).
Max throughput for me is around 8k per second, in both single machine (silo and client on same hardware) and multi-machine (separate physical hardware).
Both machines are relatively beefy 8-core/16-thread Intel i7's with 32G's of ram for the silo, and 16 for the client, and they communicate over a very healthy Gb ethernet, and although I cannot use the dashboard, as it is not yet dotnet core compliant, I am quite certain that hardware is not the limiting factor for me.
I'll keep experimenting using the feedback above.
Thank you for this Q&A session.
 Stefan-Z-Camilleri
on 24 Jun 2017
Stefan-Z-Camilleri
on 24 Jun 2017
I am running additional tests across machines, and it seems like the flatlining observed earlier is due to the client dying, not the silo. It's strange because on the client side, the CPU is nowhere near maxed out.
Output from the client side (lots of red errors like the one shown):
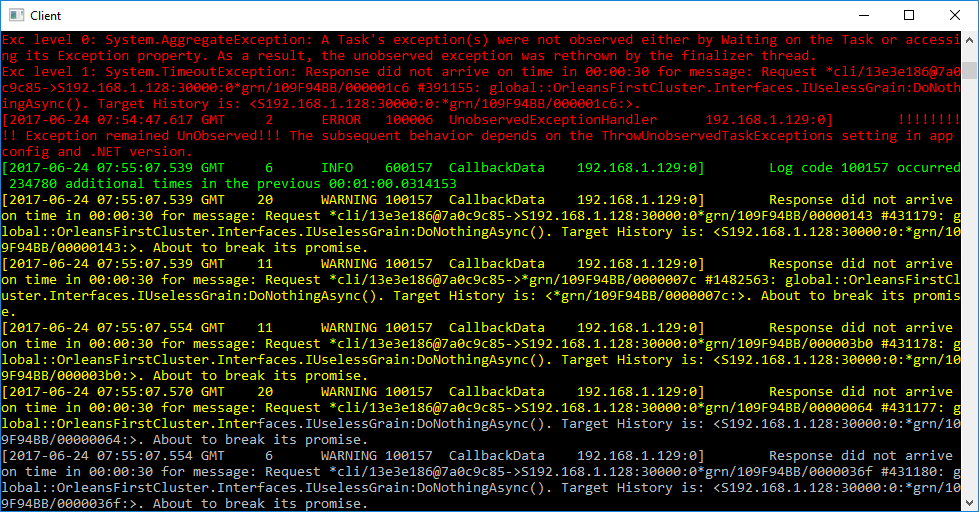
dandago
on 24 Jun 2017
The client crashes since you don't await the grain calls. The task returned from the grain call sometimes fails with TimeoutException (since you are generating too much traffic and eventually some of the calls timeout). Since the failed task is not awaited, it causes "unobservered exception" and by default in .NET it crashes the process.
https://msdn.microsoft.com/en-us/library/system.threading.tasks.taskscheduler.unobservedtaskexception(v=vs.110).aspx
You can either configure the process not to crash in this case, or even better: await the task. That was Sergey's first and biggest comment.
gabikliot
on 24 Jun 2017
Actually, it does not crash the process by default, as explained in the same link you quoted (emphasis mine):
To make it easier for developers to write asynchronous code based on tasks, the .NET Framework 4.5 changes the default exception behavior for unobserved exceptions. Although unobserved exceptions still raise the UnobservedTaskException exception, the process does not terminate by default. Instead, the exception is handled by the runtime after the event is raised, regardless of whether an event handler observes the exception. This behavior can be configured. Starting with the .NET Framework 4.5, you can use the configuration element to revert to the behavior of the .NET Framework 4 and terminate the process:
Yes, I could await the calls, but the whole point of the experiment was to see how the system performs if I don't. This is a realistic scenario for when we receive a lot of event data and want to maximise throughput since we don't care about it being ordered.
dandago
on 24 Jun 2017
Just make sure it is configured correctly. I think it is in some app config file.
gabikliot
on 24 Jun 2017
This is a realistic scenario for when we receive a lot of event data and want to maximise throughput since we don't care about it being ordered.
My understanding is that in this case you should use one-way calls. They're already merged in 1.5 RC.
Failing that, you should .Ignore() them so that if they do throw they don't crash the client. Unobserved exceptions may not kill the process anymore, but your observations indicate they leave the Orleans client (or your test code) in an unhappy state.
 kogir
on 24 Jun 2017
kogir
on 24 Jun 2017
Yes, I could await the calls, but the whole point of the experiment was to see how the system performs if I don't. This is a realistic scenario for when we receive a lot of event data and want to maximise throughput since we don't care about it being ordered.
Each Task is supposed to be awaited or explicitly .Ignore()'ed, as @kogir pointed out. Keep also in mind that by not awaiting the Tasks you aren't really saving much or anything because the responses still get sent back and processed by the runtime on the client.
As I already mentioned above, we use AsyncPipeline for this kind of purposes. You can configure it to a high size (e.g. 10K or 20K of in-flight requests), but it will block you client thread when you try to exceed that number. That makes it really easy to generate a high volume of events and measure the sustained peak throughput without overloading the cluster.
As @gabikliot rightly pointed out, a single client process/thread is usually not enough to generate sufficient load for a silo due to high parallelism on the silo side. With AsyncPipeline, you get a stable load generated by a single client, and you can easily add another one to see the difference in total throughput.
sergeybykov
on 30 Jun 2017
Thanks for the pointers - I am doing some tests as we speak.
Just one additional question though. Given that I am just calling a dummy method with no parameters, and there are no complex objects to serialize etc, why does it use so much CPU? What is it actually doing?
dandago
on 30 Jun 2017
While there's still serialization of message headers and other information, I suspect the main factor is spin locks used within the queues. They are optimized for high-throughput workloads, and skew the CPU monitoring on underutilized systems. Dashboard might be a factor, too. This is purely speculation without running your code, but based on our prior experience.
sergeybykov
on 30 Jun 2017
@sergeybykov What would you think, would there be worth to consider hybrid mutex locking? This seem to come up often in practice and people are running (testing etc.) the system locally too, probably many people are testing on shared single-core systems on Azure (where spinning probably is particularly bad).
 veikkoeeva
on 30 Jun 2017
veikkoeeva
on 30 Jun 2017
Just to leave a note here as an success case/testimony in terms of performance.
My former company had a customer base of 800k payment terminals spread around Brazil with all of then talking to our payment processing platform running in Azure.
Before I met Orleans, the v1 of our platform was able to handle with 18 (big 36 core 128gb) servers somewhere around 8k transactions per second (full EMV financial transactions end to end).
After I met Orleans and spent some time with @gabikliot on Skype explaining our solution and listening a lot to his advices, we rewrote our whole platform on top of Orleans and released v2.
After several experiments and redesign, we were able to reduce our infrastructure to 5 silos in the cluster and 7 clients as frontend handling somewhere around 13k tps and using smaller servers.
 galvesribeiro
on 15 Jul 2017
galvesribeiro
on 15 Jul 2017
@dandago I don't see anything tangible left to do here. So I'll close it. Feel free to reopen if needed.
sergeybykov
on 25 Jul 2017
Related issues
 jt4000
·
3Comments
jt4000
·
3Comments
 scharada
·
3Comments
scharada
·
3Comments
 bobanco
·
3Comments
bobanco
·
3Comments
 Vlad-Stryapko
·
3Comments
Vlad-Stryapko
·
3Comments
 danvanderboom
·
3Comments
danvanderboom
·
3Comments
Most helpful comment
Just to leave a note here as an success case/testimony in terms of performance.
My former company had a customer base of 800k payment terminals spread around Brazil with all of then talking to our payment processing platform running in Azure.
Before I met Orleans, the v1 of our platform was able to handle with 18 (big 36 core 128gb) servers somewhere around 8k transactions per second (full EMV financial transactions end to end).
After I met Orleans and spent some time with @gabikliot on Skype explaining our solution and listening a lot to his advices, we rewrote our whole platform on top of Orleans and released v2.
After several experiments and redesign, we were able to reduce our infrastructure to 5 silos in the cluster and 7 clients as frontend handling somewhere around 13k tps and using smaller servers.