Origin: High CPU usage of 'origin master' process
On several of my deployed environments, the origin master process has excessive permanent CPU usage (around 100%) even if the cluster should be mostly idle (no pod changes).
Version
oc v3.6.1+008f2d5
kubernetes v1.6.1+5115d708d7
features: Basic-Auth GSSAPI Kerberos SPNEGO

Server https://XXXXXXXXXXXXXXX:8443
openshift v3.6.1+008f2d5
kubernetes v1.6.1+5115d708d7
Steps To Reproduce
Happens on 3 of my environments, but not on others. On one of them, the bug started showing after I reconfigured the environment to use mandatory http proxies but I doubt that proxies are responsible for the high CPU usage.
Current Result
In top, the origin master process permanently uses around 100% CPU and the system load has a floor of 1 or so.
Expected Result
The host should not be loaded and origin master CPU usage should be at 15% or less during normal activity.
Additional Information
Our environments do not have too many pods, typical number is between 50 (test environment in one VM/host) to around 250 pods (production environment on several physical hosts).
Typical top first lines:
top - 08:59:01 up 79 days, 31 min,  2 users,  load average: 3.20, 2.17, 1.57
Tasks: 1944 total,   2 running, 586 sleeping,   0 stopped,   1 zombie
%Cpu(s): 27.7 us, 15.3 sy,  0.1 ni, 56.6 id,  0.1 wa,  0.0 hi,  0.3 si,  0.0 st
KiB Mem : 13201092+total, 10554044+free, 14012704 used, 12457768 buff/cache
KiB Swap:  1679356 total,  1599228 free,    80128 used. 11526048+avail Mem

   PID USER      PR  NI    VIRT    RES    SHR S  %CPU %MEM     TIME+ COMMAND
110627 root      20   0 12.668g 727016 114860 S  74.0  0.6  64:10.95 /usr/bin/openshift start master --config=/etc/origin/master/master-config.yaml --loglevel=2
 57109 root      20   0 2080192 408432  88672 S  59.2  0.3 300:00.89 /usr/bin/openshift start node --config=/etc/origin/node/node-config.yaml --loglevel=2
 47765 1000060+  20   0 1876608 1.721g  25136 S  41.1  1.4 241:12.29 /bin/prometheus -storage.local.retention=720h -storage.local.target-heap-size=2863311530 -storage.local.path=/data -config.file=/etc/prometheus/prometheus.yml -web.external-url=https://prometheus-moni+
 45836 1000050+  20   0 6939612 465012  18852 S   9.9  0.4  70:48.93 /bin/java -Xms256m -Xmx1g -Djava.awt.headless=true -XX:+UseParNewGC -XX:+UseConcMarkSweepGC -XX:CMSInitiatingOccupancyFraction=75 -XX:+UseCMSInitiatingOccupancyOnly -XX:+HeapDumpOnOutOfMemoryError -XX+
Strace output, lots of futex-related calls like this:
select(0, NULL, NULL, NULL, {0, 3})     = 0 (Timeout)
futex(0xc0023f0, FUTEX_WAIT, 0, NULL)   = -1 EAGAIN (Resource temporarily unavailable)
futex(0xbffe0f8, FUTEX_WAKE, 1)         = 1
futex(0xbffe0e0, FUTEX_WAKE, 1)         = 1
futex(0xbffe0f8, FUTEX_WAKE, 1)         = 1
futex(0xbffe0e0, FUTEX_WAKE, 1)         = 1
futex(0xbffe0f8, FUTEX_WAKE, 1)         = 1
Journal of origin-master.service at loglevel 5 does not say much except that it syncs statefulsets every 30s or so:
Apr 06 09:01:08 openshift-host origin-master[110627]: I0406 09:01:08.676936  110627 rest.go:324] Starting watch for /api/v1/namespaces, rv=23227 labels= fields= timeout=5m54s
Apr 06 09:01:14 openshift-host origin-master[110627]: I0406 09:01:14.738307  110627 rest.go:324] Starting watch for /api/v1/resourcequotas, rv=23227 labels= fields= timeout=6m50s
Apr 06 09:01:18 openshift-host origin-master[110627]: I0406 09:01:18.927080  110627 rest.go:324] Starting watch for /api/v1/services, rv=23227 labels= fields= timeout=5m50s
Apr 06 09:01:21 openshift-host origin-master[110627]: I0406 09:01:21.831669  110627 stateful_set.go:420] Syncing StatefulSet backends/redis-wisdom2-sentinel with 1 pods
Apr 06 09:01:21 openshift-host origin-master[110627]: I0406 09:01:21.831736  110627 stateful_set.go:425] Succesfully synced StatefulSet backends/redis-wisdom2-sentinel successful
Apr 06 09:01:21 openshift-host origin-master[110627]: I0406 09:01:21.831771  110627 stateful_set.go:420] Syncing StatefulSet backends/redis-se with 1 pods
Apr 06 09:01:21 openshift-host origin-master[110627]: I0406 09:01:21.831785  110627 stateful_set.go:425] Succesfully synced StatefulSet backends/redis-se successful
Apr 06 09:01:21 openshift-host origin-master[110627]: I0406 09:01:21.831812  110627 stateful_set.go:420] Syncing StatefulSet backends/redis-se-sentinel with 1 pods
Apr 06 09:01:21 openshift-host origin-master[110627]: I0406 09:01:21.831824  110627 stateful_set.go:425] Succesfully synced StatefulSet backends/redis-se-sentinel successful
Apr 06 09:01:21 openshift-host origin-master[110627]: I0406 09:01:21.831847  110627 stateful_set.go:420] Syncing StatefulSet backends/redis-sidekiq with 1 pods
Apr 06 09:01:21 openshift-host origin-master[110627]: I0406 09:01:21.831860  110627 stateful_set.go:425] Succesfully synced StatefulSet backends/redis-sidekiq successful
Apr 06 09:01:21 openshift-host origin-master[110627]: I0406 09:01:21.831883  110627 stateful_set.go:420] Syncing StatefulSet backends/redis-wisdom2 with 1 pods
Apr 06 09:01:21 openshift-host origin-master[110627]: I0406 09:01:21.831895  110627 stateful_set.go:425] Succesfully synced StatefulSet backends/redis-wisdom2 successful
Apr 06 09:01:21 openshift-host origin-master[110627]: I0406 09:01:21.831919  110627 stateful_set.go:420] Syncing StatefulSet backends/graphdb with 1 pods
Apr 06 09:01:21 openshift-host origin-master[110627]: I0406 09:01:21.831932  110627 stateful_set.go:425] Succesfully synced StatefulSet backends/graphdb successful
Apr 06 09:01:21 openshift-host origin-master[110627]: I0406 09:01:21.831956  110627 stateful_set.go:420] Syncing StatefulSet backends/elasticsearch with 1 pods
Apr 06 09:01:21 openshift-host origin-master[110627]: I0406 09:01:21.831968  110627 stateful_set.go:425] Succesfully synced StatefulSet backends/elasticsearch successful
Apr 06 09:01:21 openshift-host origin-master[110627]: I0406 09:01:21.831990  110627 stateful_set.go:420] Syncing StatefulSet backends/mysql with 1 pods
Apr 06 09:01:21 openshift-host origin-master[110627]: I0406 09:01:21.832003  110627 stateful_set.go:425] Succesfully synced StatefulSet backends/mysql successful
Apr 06 09:01:21 openshift-host origin-master[110627]: I0406 09:01:21.832026  110627 stateful_set.go:420] Syncing StatefulSet backends/rabbitmq with 1 pods
Apr 06 09:01:21 openshift-host origin-master[110627]: I0406 09:01:21.832038  110627 stateful_set.go:425] Succesfully synced StatefulSet backends/rabbitmq successful
Apr 06 09:01:21 openshift-host origin-master[110627]: I0406 09:01:21.832061  110627 stateful_set.go:420] Syncing StatefulSet backends/redis-sidekiq-sentinel with 1 pods
Apr 06 09:01:21 openshift-host origin-master[110627]: I0406 09:01:21.832082  110627 stateful_set.go:425] Succesfully synced StatefulSet backends/redis-sidekiq-sentinel successful
Apr 06 09:01:21 openshift-host origin-master[110627]: I0406 09:01:21.832114  110627 stateful_set.go:420] Syncing StatefulSet backends/mongodb with 1 pods
Apr 06 09:01:21 openshift-host origin-master[110627]: I0406 09:01:21.832126  110627 stateful_set.go:425] Succesfully synced StatefulSet backends/mongodb successful
Apr 06 09:01:23 openshift-host origin-master[110627]: I0406 09:01:23.947883  110627 rest.go:324] Starting watch for /oapi/v1/hostsubnets, rv=23227 labels= fields= timeout=6m11s
Apr 06 09:01:25 openshift-host origin-master[110627]: I0406 09:01:25.163958  110627 rest.go:324] Starting watch for /api/v1/namespaces, rv=23227 labels= fields= timeout=8m18s
Apr 06 09:01:25 openshift-host origin-master[110627]: I0406 09:01:25.184510  110627 rest.go:324] Starting watch for /api/v1/pods, rv=23244 labels= fields= timeout=7m15s
pprof.rb cpu profile has more than 50% of time spent in runtime.futex:
$ export PPROF_BINARY_PATH=$PWD ; go tool pprof  http://localhost:6060/debug/pprof/profile?debug=1
Fetching profile over HTTP from http://localhost:6060/debug/pprof/profile?debug=1
Saved profile in /home/julien/pprof/pprof.openshift.samples.cpu.009.pb.gz
File: openshift
Type: cpu
Entering interactive mode (type "help" for commands, "o" for options)
(pprof) top
Showing nodes accounting for 14.28s, 67.07% of 21.29s total
Dropped 659 nodes (cum <= 0.11s)
Showing top 10 nodes out of 130
      flat  flat%   sum%        cum   cum%
    10.61s 49.84% 49.84%     10.61s 49.84%  runtime.futex
     1.01s  4.74% 54.58%      1.01s  4.74%  runtime/internal/atomic.Xchg
     0.77s  3.62% 58.20%      0.77s  3.62%  runtime.usleep
     0.41s  1.93% 60.12%      0.61s  2.87%  runtime.mallocgc
     0.31s  1.46% 61.58%      1.48s  6.95%  runtime.gentraceback
     0.28s  1.32% 62.89%      0.88s  4.13%  runtime.pcvalue
     0.24s  1.13% 64.02%      0.24s  1.13%  runtime.readvarint
     0.22s  1.03% 65.05%      0.23s  1.08%  runtime.findfunc
     0.22s  1.03% 66.09%      0.32s  1.50%  runtime.runqempty
     0.21s  0.99% 67.07%      0.45s  2.11%  runtime.step
(pprof)
The full pprof cpu graph is shown here: 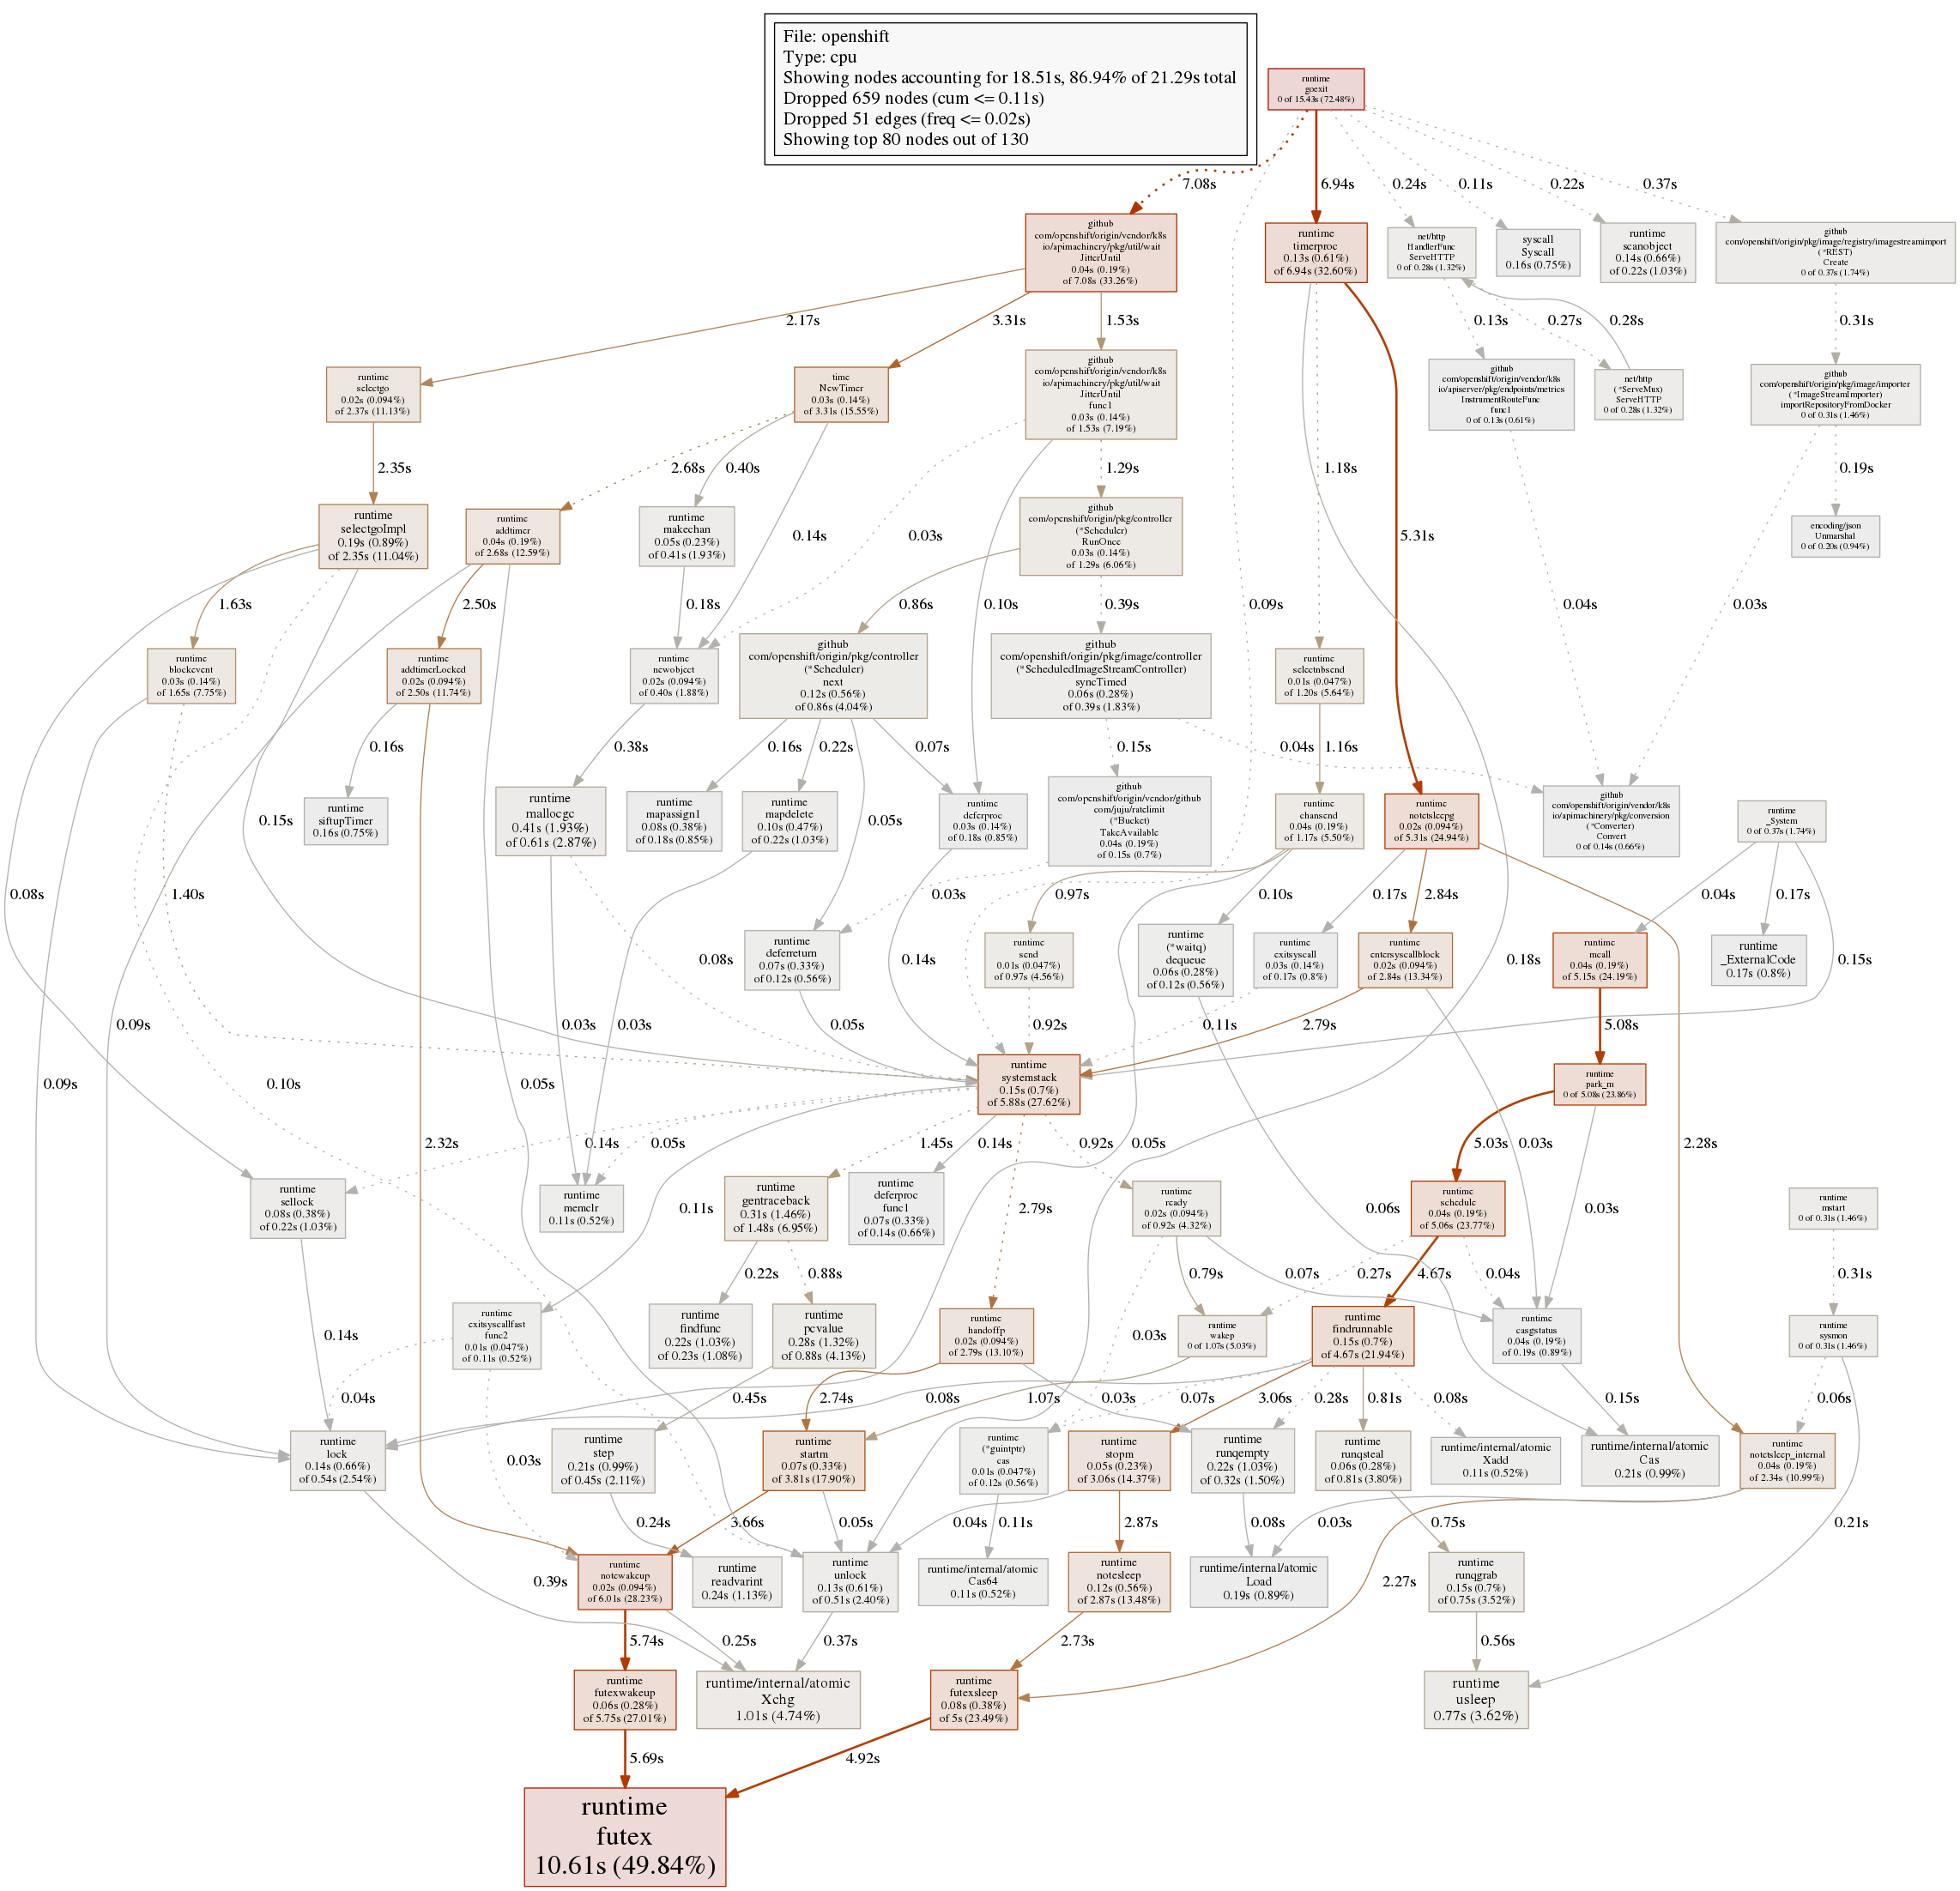
 jperville
All 9 comments
/sig master
 mfojtik
on 6 Apr 2018
mfojtik
on 6 Apr 2018
Issues go stale after 90d of inactivity.
Mark the issue as fresh by commenting /remove-lifecycle stale.
Stale issues rot after an additional 30d of inactivity and eventually close.
Exclude this issue from closing by commenting /lifecycle frozen.
If this issue is safe to close now please do so with /close.
/lifecycle stale
 openshift-bot
on 8 Jul 2018
openshift-bot
on 8 Jul 2018
/remove-lifecycle stale
jperville
on 9 Jul 2018
Issues go stale after 90d of inactivity.
Mark the issue as fresh by commenting /remove-lifecycle stale.
Stale issues rot after an additional 30d of inactivity and eventually close.
Exclude this issue from closing by commenting /lifecycle frozen.
If this issue is safe to close now please do so with /close.
/lifecycle stale
openshift-bot
on 7 Oct 2018
Stale issues rot after 30d of inactivity.
Mark the issue as fresh by commenting /remove-lifecycle rotten.
Rotten issues close after an additional 30d of inactivity.
Exclude this issue from closing by commenting /lifecycle frozen.
If this issue is safe to close now please do so with /close.
/lifecycle rotten
/remove-lifecycle stale
openshift-bot
on 6 Nov 2018
/remove-lifecycle stale
jperville
on 7 Nov 2018
Rotten issues close after 30d of inactivity.
Reopen the issue by commenting /reopen.
Mark the issue as fresh by commenting /remove-lifecycle rotten.
Exclude this issue from closing again by commenting /lifecycle frozen.
/close
openshift-bot
on 11 Dec 2018
@openshift-bot: Closing this issue.
In response to this:
Rotten issues close after 30d of inactivity.
Reopen the issue by commenting
/reopen.
Mark the issue as fresh by commenting/remove-lifecycle rotten.
Exclude this issue from closing again by commenting/lifecycle frozen./close
Instructions for interacting with me using PR comments are available here. If you have questions or suggestions related to my behavior, please file an issue against the kubernetes/test-infra repository.
 openshift-ci-robot
on 11 Dec 2018
openshift-ci-robot
on 11 Dec 2018
We suffer from the same problem. First version we used was Origin v3.9.0 using oc cluster up on CentOS 7.6 on VirtualBox, our VM dies after a day of high CPU usage. Same problem exists with version v3.11.0. Any hints what may cause it would be really appreciated.
> top
...
  PID USER      PR  NI    VIRT    RES    SHR S  %CPU %MEM     TIME+ COMMAND
11644 root      20   0 1745080 554148  24912 S 176.3  5.5 744:06.45 hypershift
11497 root      20   0 1331992 113348  22124 S  61.2  1.1 455:38.37 hyperkube
16219 root      20   0 1189716  77620  20076 S  59.9  0.8 354:17.34 hypershift
10994 root      20   0   11.6g 212216  15288 S  33.6  2.1 290:46.44 openshift
 9243 root      20   0 2461020  96844  22036 S  26.6  1.0 207:18.51 hyperkube
11236 root      20   0 1112092  48120  18452 S  15.1  0.5 141:21.57 hyperkube
 4152 root      20   0 1663956  72948  14936 S   8.6  0.7  83:44.43 dockerd-current

> uname -a
Linux hostname 3.10.0-957.1.3.el7.x86_64 #1 SMP Thu Nov 29 14:49:43 UTC 2018 x86_64 x86_64 x86_64 GNU/Linux

> free -m
              total        used        free      shared  buff/cache   available
Mem:           9836        4345         148         298        5343        4544
Swap:          1227          45        1182
We get a lot of futex in strace -p PID as well:
futex(0xb3ce168, FUTEX_WAIT, 0, NULL)   = -1 EAGAIN (Resource temporarily unavailable)
futex(0xb3ce168, FUTEX_WAIT, 0, NULL)   = -1 EAGAIN (Resource temporarily unavailable)
futex(0xb3ce168, FUTEX_WAIT, 0, NULL)   = 0
futex(0xb3ce168, FUTEX_WAIT, 0, NULL)   = -1 EAGAIN (Resource temporarily unavailable)
futex(0xb3ce168, FUTEX_WAIT, 0, NULL)   = 0
epoll_pwait(4, [{EPOLLOUT, {u32=2081923304, u64=139674418389224}}], 128, 0, NULL, 0) = 1
futex(0xc4203ee548, FUTEX_WAKE, 1)      = 1
epoll_pwait(4, [], 128, 0, NULL, 842434412448) = 0
futex(0xb3ce168, FUTEX_WAIT, 0, NULL)   = 0
futex(0xb3ce168, FUTEX_WAIT, 0, NULL)   = 0
futex(0xb3ce168, FUTEX_WAIT, 0, NULL)   = 0
futex(0xb3ce168, FUTEX_WAIT, 0, NULL)   = -1 EAGAIN (Resource temporarily unavailable)
and
futex(0xc42047f148, FUTEX_WAKE, 1)      = 1
futex(0xc421330548, FUTEX_WAKE, 1)      = 1
futex(0xb3d23c0, FUTEX_WAIT, 0, {0, 2996038}) = -1 ETIMEDOUT (Connection timed out)
futex(0xc420c4a548, FUTEX_WAKE, 1)      = 1
futex(0xb3d23c0, FUTEX_WAIT, 0, {0, 11681341}) = -1 ETIMEDOUT (Connection timed out)
futex(0xc42047f148, FUTEX_WAKE, 1)      = 1
futex(0xc4200d6148, FUTEX_WAKE, 1)      = 1
futex(0xb3d23c0, FUTEX_WAIT, 0, {0, 57759136}) = -1 ETIMEDOUT (Connection timed out)
futex(0xc420c4a548, FUTEX_WAKE, 1)      = 1
futex(0xb3d23c0, FUTEX_WAIT, 0, {0, 44773172}) = -1 ETIMEDOUT (Connection timed out)
futex(0xc4200d6148, FUTEX_WAKE, 1)      = 1
futex(0xb3d23c0, FUTEX_WAIT, 0, {0, 6958062}) = -1 ETIMEDOUT (Connection timed out)
futex(0xc421330548, FUTEX_WAKE, 1)      = 1
futex(0xb3d23c0, FUTEX_WAIT, 0, {0, 19845014}) = -1 ETIMEDOUT (Connection timed out)
futex(0xc421330548, FUTEX_WAKE, 1)      = 1
 dlakatos847
on 21 Dec 2018
dlakatos847
on 21 Dec 2018
Related issues
 syui
·
3Comments
syui
·
3Comments
 edseymour
·
3Comments
edseymour
·
3Comments
 guangxuli
·
4Comments
guangxuli
·
4Comments
 akram
·
3Comments
akram
·
3Comments
 crobby
·
4Comments
crobby
·
4Comments
Most helpful comment
We suffer from the same problem. First version we used was Origin v3.9.0 using
oc cluster upon CentOS 7.6 on VirtualBox, our VM dies after a day of high CPU usage. Same problem exists with version v3.11.0. Any hints what may cause it would be really appreciated.We get a lot of futex in
strace -p PIDas well:and