Operator-sdk: How to setup my IDEA to debug the operator in golang locally?
Type of question
Debug/Development env
Question
What did you do?
How to setup my IDEA to debug the operator in golang locally?
What did you expect to see?
I expected to be able to setup/config my IDEA for when the command operator-sdk up local --namespace= be executed I can debug the code.
Environment
- operator-sdk version: operator-sdk version v0.5.0+git
- Kubernetes version information:
Client Version: version.Info{Major:"1", Minor:"13", GitVersion:"v1.13.4", GitCommit:"c27b913fddd1a6c480c229191a087698aa92f0b1", GitTreeState:"clean", BuildDate:"2019-03-01T23:34:27Z", GoVersion:"go1.12", Compiler:"gc", Platform:"darwin/amd64"}
Server Version: version.Info{Major:"1", Minor:"11+", GitVersion:"v1.11.0+d4cacc0", GitCommit:"d4cacc0", GitTreeState:"clean", BuildDate:"2019-04-04T19:38:01Z", GoVersion:"go1.10.3", Compiler:"gc", Platform:"linux/amd64"}
- Kubernetes cluster kind: minishift/minikube
Additional context
MacOSX/IntellijIDEA
 camilamacedo86
All 5 comments
Hi @camilamacedo86, I don't know much about IDEA, haven't used it yet. But what the operator-sdk up local command does is it just starts the operator locally by doing a go build and then exec the binary file with the args you passed to it. Hopefully, that is of help?
 lilic
on 12 Apr 2019
lilic
on 12 Apr 2019
Hi @camilamacedo86, if you what, use can use the same approach used with Vscode.
using this commands it works for me
export WATCH_NAMESPACE=default
dlv --listen=:2345 --headless=true --api-version=2 exec ./build/_output/bin/memcached-operator-local --
then attach to process using this vs code conf
{
    // Use IntelliSense to learn about possible attributes.
    // Hover to view descriptions of existing attributes.
    // For more information, visit: https://go.microsoft.com/fwlink/?linkid=830387
    "version": "0.2.0",
    "configurations": [
        {
            "name": "test",
            "type": "go",
            "request": "launch",
            "mode": "remote",
            "remotePath": "${workspaceFolder}/cmd/manager/main.go",
            "port": 2345,
            "host": "127.0.0.1",
            "program": "${workspaceFolder}",
            "env": {},
            "args": []
        }
    ]
}
obviously you need to compile it first.
I hope this can be help
 devopsgym
on 28 Apr 2019
devopsgym
on 28 Apr 2019
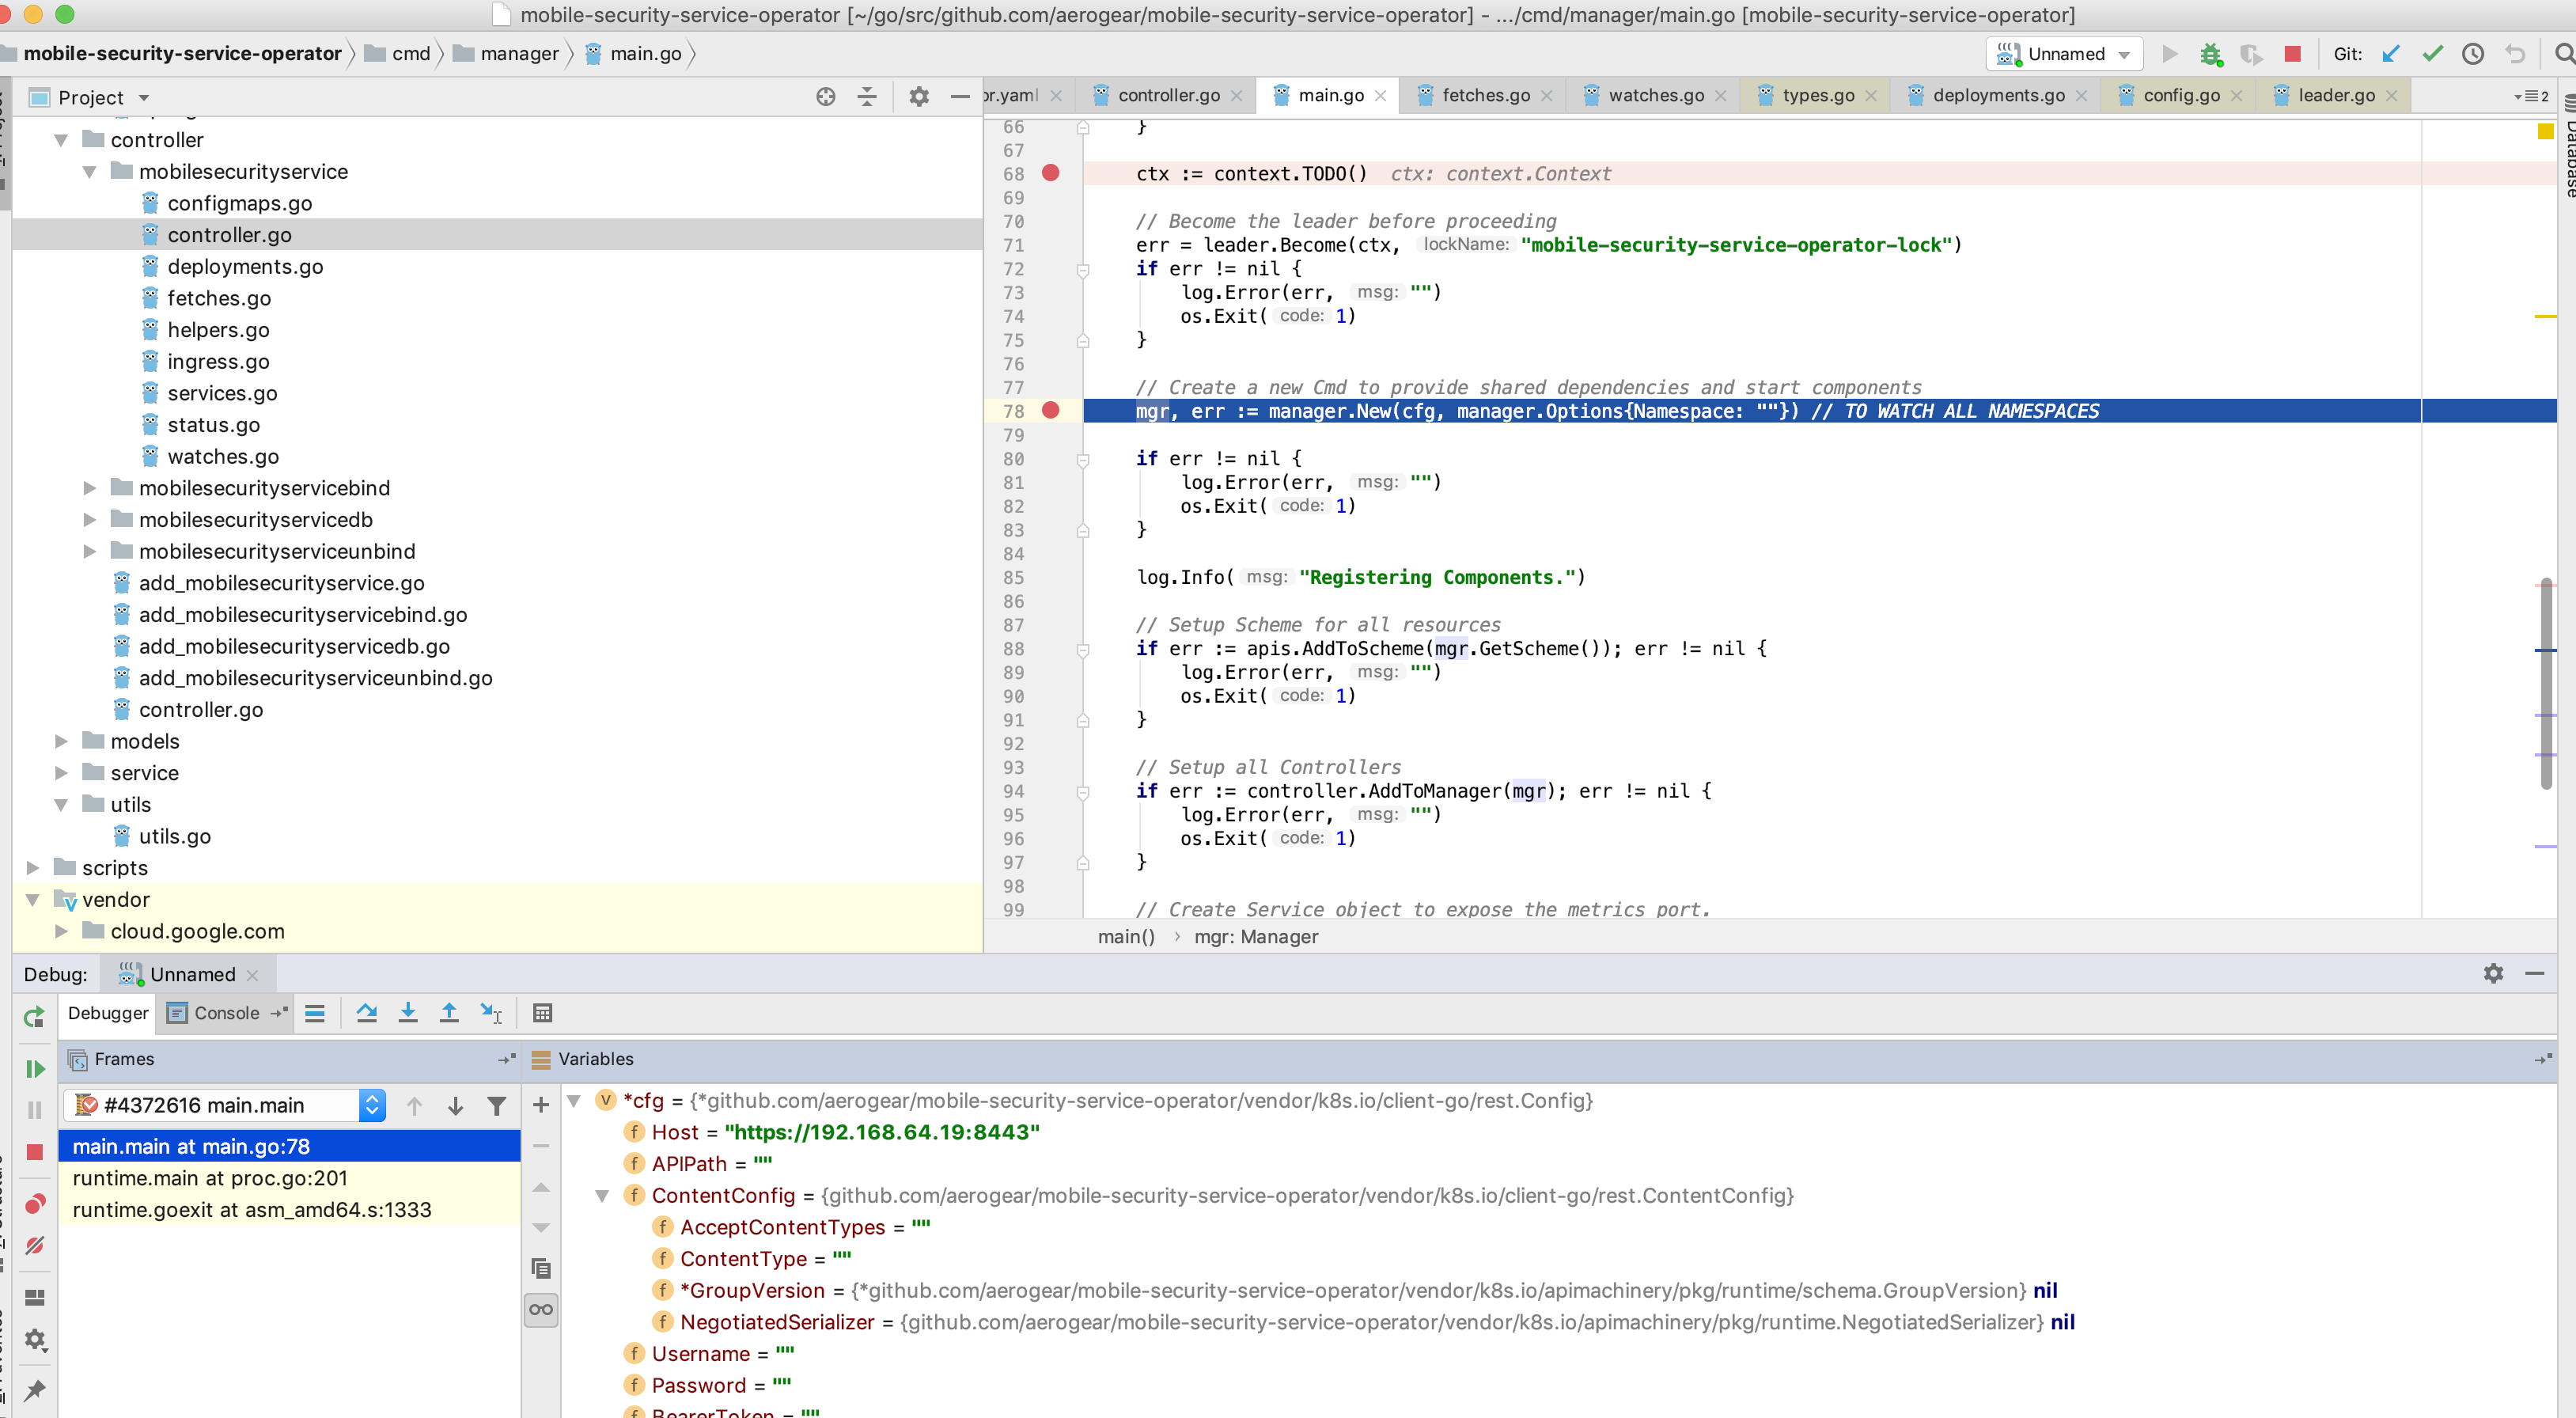
@devopsgym really tks it worked for me as follows.
- Run
export WATCH_NAMESPACE=default - From the dir where has the main.go run
$ dlv debug --headless --listen=:2345 --api-version=2 - From the IntelliJ IDEA setup and use the go remote debugs as follows.

- Now, just add the breakpoints and check it working :-)
camilamacedo86
on 28 Apr 2019
Closing this issue since shows solved.
camilamacedo86
on 28 Apr 2019
Hi - I cannot get the debugger to stop at the breakpoints after doing the above. Like, I create a CR and expected the breakpoint for the reconcile to kick in. But, it never stopped.
@camilamacedo86
 meragodbole
on 26 Jul 2019
meragodbole
on 26 Jul 2019
Related issues
 gyliu513
·
3Comments
gyliu513
·
3Comments
 ricardozanini
·
4Comments
ricardozanini
·
4Comments
 ffoysal
·
5Comments
ffoysal
·
3Comments
ffoysal
·
5Comments
ffoysal
·
3Comments
 joelanford
·
3Comments
joelanford
·
3Comments
Most helpful comment
Hi @camilamacedo86, if you what, use can use the same approach used with Vscode.
using this commands it works for me
export WATCH_NAMESPACE=defaultthen attach to process using this vs code conf
obviously you need to compile it first.
I hope this can be help