Openlibrary: Graphs not showing (JS error)
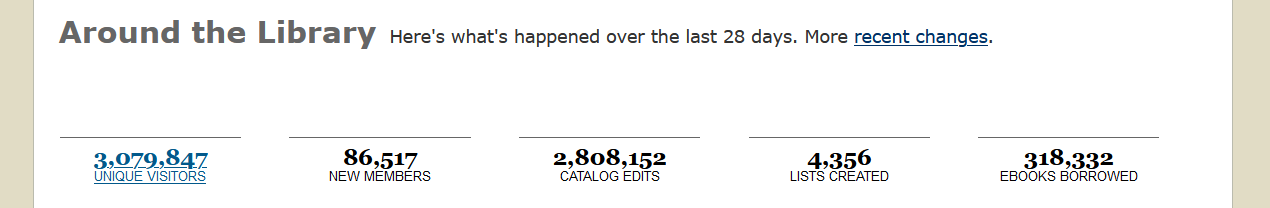
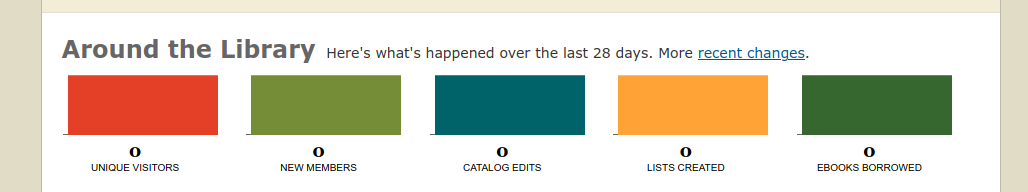
The graphs on the homepage and /stats are not displayed; the numbers are in the HTML, but not showing up. Getting the JS error: Possible Unhandled Promise Rejection: ReferenceError: assignment to undeclared variable insertSteps in https://openlibrary.org/static/build/graphs.bcd36affe16d84907807.js:7
Evidence / Screenshot (if possible)
Relevant url?
Details
- Logged in (Y/N)? Y
- Browser type/version? FF81
- Operating system? Win10
- Environment (prod/dev/local)? prod
Proposal & Constraints
Related files
Stakeholders
@jamesachamp
 cdrini
All 11 comments
Same error, file, and line as #3924, so this might be a dupe.
 SouthGoingZax
on 24 Oct 2020
SouthGoingZax
on 24 Oct 2020
I have not yet done any extensive testing but, so far, it looks like upgrading flot to the latest version has resolved this error. I can't yet confirm the upgrade didn't break a thousand other things ... I'm new to the codebase and project in general so I'm really not sure what all pages might be affected by this change. Any tips there would be appreciated.
Upgrading packages like these requires a solid test suite so I'm diverting my attention to testing
 perryjr
on 28 Oct 2020
perryjr
on 28 Oct 2020
As perryjr said, I tried to upgrade jquery-migrate at /vendor/js/jquery-migrate in the folder, and the warning was removed from the development environment
 ArunTeltia
on 30 Oct 2020
ArunTeltia
on 30 Oct 2020
@SouthGoingZax #3924 is more about http/https issue. This issue is specifically a JS issue (the data is there, but the JS is not showing). @jamesachamp would you be able to take a look at this one?
cdrini
on 30 Oct 2020
I think that @perryjr is on the correct path. insertSteps is used twice in vendor/js/flot without being declared, hence the error. It's probably best to update this, as it is quite outdated.
This was running successfully rather recently. I'm assuming that some configuration changed that is causing this to be executed in strict mode.
@cdrini Out of curiosity, is there some benefit to having libraries in vendor/js? Is this a practice that we are transitioning away from?
 jamesachamp
on 31 Oct 2020
jamesachamp
on 31 Oct 2020
Being new to the codebase I'm a little out of my depth, but I'd love to look over someone's shoulder during the upgrade process
perryjr
on 31 Oct 2020
@jamesachamp exactly it's an old practice; likely before npm existed :P I'm curious as to what caused these to break in the first place; they were working ~before this issue was opened. But if updating fixes it, that seems like a good option. I don't think flot is used in too many places.
cdrini
on 31 Oct 2020
@cdrini I'm not sure what caused it to break, but whatever it was happened on or before 15 October (this is when Mek noticed the issue).
Flot is only used in graphs/plot.js. The functions defined in this file are used to initialize the graphs here.
@perryjr If you want, I can work on this and outline the process in this thread. Regardless of who works on this, it would be helpful to have some dummy data to use in plot.js unit tests.
@cdrini do you see any harm in pulling data from the live server for this? We should be able to run the following in web to get what we need:
import simplejson
from openlibrary.core import admin

stats = admin.get_stats()
print(simplejson.dumps(stats["visitors"].get_counts(28, True)))
@jamesachamp go nuts. I'm just trying to absorb as much as possible so I can become useful
perryjr
on 2 Nov 2020
@jamesachamp Feel free to give that a shot :+1: You can also copy the data from the HTML of openlibrary.org; e.g.
<script type="text/json+graph" id="graph-json-visitors-graph">[[1602028800000, 0], [1602115200000, 0], [1602201600000, 0], [1602288000000, 0], [1602374400000, 0], [1602460800000, 0], [1602547200000, 0], [1602633600000, 525663], [1602720000000, 523638], [1602806400000, 523579], [1602892800000, 501134], [1602979200000, 495633], [1603065600000, 510200], [1603152000000, 557641], [1603238400000, 305487], [1603324800000, 280896], [1603411200000, 262399], [1603497600000, 237382], [1603584000000, 221989], [1603670400000, 229289], [1603756800000, 271567], [1603843200000, 257964], [1603929600000, 252625], [1604016000000, 264504], [1604102400000, 256518], [1604188800000, 226789], [1604275200000, 229868], [1604361600000, 249702]]</script>
<script type="text/json+graph" id="graph-json-members-graph">[[1602028800000, 3704], [1602115200000, 3101], [1602201600000, 2837], [1602288000000, 3761], [1602374400000, 3931], [1602460800000, 3217], [1602547200000, 3543], [1602633600000, 3102], [1602720000000, 2782], [1602806400000, 3864], [1602892800000, 3362], [1602979200000, 2626], [1603065600000, 3039], [1603152000000, 3009], [1603238400000, 2902], [1603324800000, 2676], [1603411200000, 2604], [1603497600000, 2485], [1603584000000, 2044], [1603670400000, 2992], [1603756800000, 3271], [1603843200000, 3100], [1603929600000, 2824], [1604016000000, 2642], [1604102400000, 2022], [1604188800000, 2246], [1604275200000, 3010], [1604361600000, 1881]]</script>
<script type="text/json+graph" id="graph-json-edits-graph">[[1602028800000, 99532], [1602115200000, 113629], [1602201600000, 206745], [1602288000000, 10950], [1602374400000, 127988], [1602460800000, 121739], [1602547200000, 101474], [1602633600000, 103284], [1602720000000, 100104], [1602806400000, 110261], [1602892800000, 266250], [1602979200000, 118467], [1603065600000, 82754], [1603152000000, 79492], [1603238400000, 155032], [1603324800000, 104573], [1603411200000, 7114], [1603497600000, 6080], [1603584000000, 5407], [1603670400000, 10506], [1603756800000, 13473], [1603843200000, 249503], [1603929600000, 111611], [1604016000000, 134452], [1604102400000, 67856], [1604188800000, 19511], [1604275200000, 130954], [1604361600000, 92344]]</script>
<script type="text/json+graph" id="graph-json-lists-graph">[[1602028800000, 136], [1602115200000, 52], [1602201600000, 23], [1602288000000, 672], [1602374400000, 23], [1602460800000, 197], [1602547200000, 45], [1602633600000, 26], [1602720000000, 28], [1602806400000, 63], [1602892800000, 574], [1602979200000, 331], [1603065600000, 96], [1603152000000, 31], [1603238400000, 29], [1603324800000, 31], [1603411200000, 29], [1603497600000, 26], [1603584000000, 12], [1603670400000, 20], [1603756800000, 77], [1603843200000, 27], [1603929600000, 41], [1604016000000, 37], [1604102400000, 16], [1604188800000, 29], [1604275200000, 31], [1604361600000, 23]]</script>
<script type="text/json+graph" id="graph-json-ebooks-graph">[[1602007020000, 12754.0], [1602093420000, 12282.0], [1602179820000, 11429.0], [1602266220000, 9230.0], [1602352620000, 9729.0], [1602439020000, 11581.0], [1602525420000, 12262.0], [1602611820000, 11571.0], [1602698220000, 11341.0], [1602784620000, 11051.0], [1602871020000, 9935.0], [1602957420000, 9048.0], [1603043820000, 11505.0], [1603130220000, 11936.0], [1603216620000, 11726.0], [1603303020000, 11010.0], [1603389420000, 10844.0], [1603475820000, 9328.0], [1603562220000, 7067.0], [1603648620000, 11393.0], [1603735020000, 12141.0], [1603821420000, 11727.0], [1603907820000, 11489.0], [1603994220000, 11125.0], [1604080620000, 8605.0], [1604167020000, 8193.0], [1604253420000, 10806.0], [1604339820000, 11595.0]]</script>
You can also copy the data from the HTML of openlibrary.org; e.g.
Not sure how I missed that...
I wound up upgrading Flot to 0.8.3, which was the highest version in npm that properly rendered the graphs without code changes. The next highest version is 2.1.2, which caused the graphs to render as a solid rectangle:
I think that it's worthwhile to upgrade to a higher major version, but I think that another issue should be opened for that purpose. We can also use that as an opportunity to add unit tests and DRY up plot.js.
jamesachamp
on 4 Nov 2020
Related issues
 BrittanyBunk
·
4Comments
cdrini
·
4Comments
cdrini
·
4Comments
BrittanyBunk
·
4Comments
cdrini
·
4Comments
cdrini
·
4Comments
 cclauss
·
3Comments
cclauss
·
3Comments
 nemobis
·
5Comments
nemobis
·
5Comments