Openlibrary: Investigate jump in /books/* load times
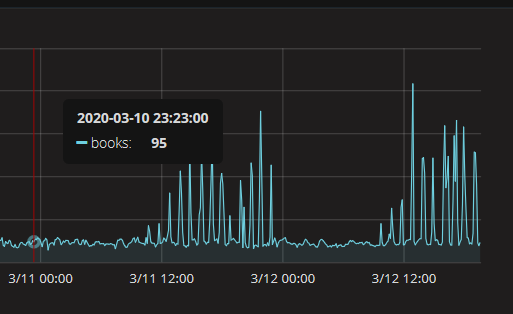
/books/* load time; the deploy is ~where the cursor is.
Stakeholders
@mekarpeles @tfmorris @hornc
 cdrini
All 13 comments
Likely related to the deploy: https://github.com/internetarchive/openlibrary/releases/tag/deploy-2020-03-10
Note that's not exactly what went out that day; here's what went out specifically that day:
cdrini
on 12 Mar 2020
We determined it's unlikely related to the new solr, since edition pages don't hit the new solr, and the /search and /authors load times (which definitely do hit solr) appear unaffected.
cdrini
on 12 Mar 2020
Here's an example _profile link for analyzing what's taking a lot of time; although we might need to do an un-cached one to get a good profile: https://openlibrary.org/books/OL26923946M/Less?_profile=true
cdrini
on 12 Mar 2020
Thank you for this @cdrini. Let's make sure this gets discussed also during our next community call as Open Mic. I'm adding it now to our mtg agenda
 mekarpeles
on 12 Mar 2020
mekarpeles
on 12 Mar 2020
What's the vertical axis scale on that graph? What does "95" at the cursor represent?
From a quick skim of the diff, I see a few candidates worth investigating:
- Changes to affiliate link generation (with prices)
- Added test user.is_librarian() on edition page
- Showing book preview on more pages
- Change from iteritems() to items() for Python 3. The assumption is that all lists on the page are small, but perhaps there's some underlying large list somewhere.
Since the performance profile shows lots of time in SSL/connection code, my first suspicion would be the code that's getting prices from either Amazon or BWB (or both).
It doesn't seem like pricing info should block rendering of the page.
 tfmorris
on 17 Mar 2020
tfmorris
on 17 Mar 2020
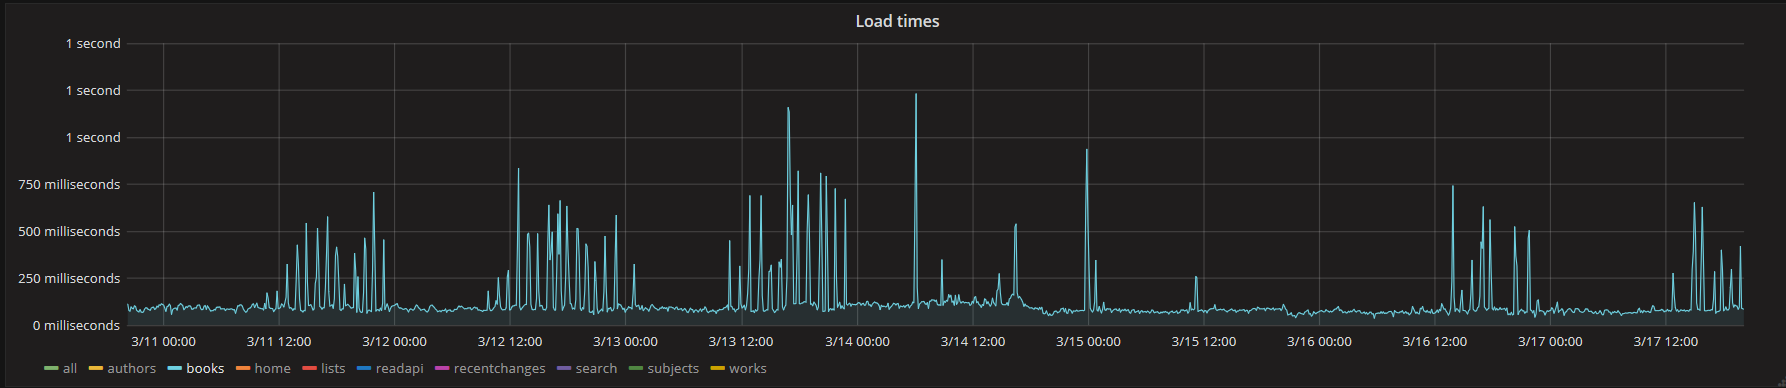
Here it is with axes:
cdrini
on 17 Mar 2020
Thanks. So 95 msec typical, spiking to 750-1200 msec. That seems much lower than the 4250 msec that the profile is showing, but perhaps that's mostly profiling overhead.
The line that jumps out at me is:
4 2.172 0.543 2.653 0.663 vendors.py:97(get_products)
That's 2.7 seconds of time wasted getting vendor info from Amazon and BWB!
The high SSL handshake times also make me suspicious that perhaps SSL connections are not getting reused and getting created anew for each request.
```took 4.24991512299 seconds
72030 function calls (54675 primitive calls) in 4.250 seconds
Ordered by: internal time, call count
List reduced from 1488 to 40 due to restriction <40>
ncalls tottime percall cumtime percall filename:lineno(function)
4 2.172 0.543 2.653 0.663 vendors.py:97(get_products)
5 0.798 0.160 0.798 0.160 SSL.py:1795(recv)
114 0.295 0.003 1.107 0.010 socket.py:406(readline)
49 0.200 0.004 0.200 0.004 SteadyDB.py:538(tough_method)
1 0.149 0.149 0.149 0.149 SSL.py:1925(do_handshake)
101 0.111 0.001 0.111 0.001 statsd.py:61(send)
195 0.102 0.001 0.102 0.001 socket.py:223(meth)
256 0.067 0.000 0.067 0.000 memcache.py:1118(readline)
43 0.027 0.001 0.027 0.001 SteadyDB.py:402(commit)
3197/43 0.016 0.000 0.020 0.000 connection.py:450(_process)
```
tfmorris
on 17 Mar 2020
Are Amazon and BWB request times instrumented? They should be so that they can be tracked since they're a key external dependency.
tfmorris
on 17 Mar 2020
I don't believe there are any stats for them; adding some would be a great next step for this issue.
cdrini
on 17 Mar 2020
I think the most likely culprit is #3118 which was merged and deployed with with a large number of unresolved review comments from @hornc @cclauss and me, a clear case of "Not enough time to do it right, but enough to do it twice."
I addition to the confusing specification of the rate limiting, which I commented on, the implementation is also just plain wrong. With the default throttling of 0.9, the implementation will wait 1.1111111 seconds before even sending the first request!
That 1.1 seconds shows up in the graph as those spikes for any uncached edition page.
tfmorris
on 17 Mar 2020
@mekarpeles said on Slack that he agreed with the analysis, but I'm unsure who's working on fixing it.
Although there are a number of problems with #3118, fixing this particular performance issue is probably just a couple of line patch.
tfmorris
on 25 Mar 2020
P2 for now since prices currently disabled
cdrini
on 27 Apr 2020
If by prices you are talking about the Amazon and BWB prices, then they are enabled now. Is this still a problem?
 SouthGoingZax
on 24 Oct 2020
SouthGoingZax
on 24 Oct 2020
Related issues
 Yashs911
·
5Comments
Yashs911
·
5Comments
 BrittanyBunk
·
4Comments
BrittanyBunk
·
5Comments
cdrini
·
4Comments
cdrini
·
4Comments
BrittanyBunk
·
4Comments
BrittanyBunk
·
5Comments
cdrini
·
4Comments
cdrini
·
4Comments