Openj9: [Performance] Is OpenJ9 slower than Hotspot in this specific case?
While trying to find the fastest way to copy content from one array to another, I found this case where, at first glance, Hotspot seems to outperform OpenJ9:
- Hotspot: ~ 1.193 secs
- _OpenJ9: ~ 1.46 secs_
Both of them are average values.
I repeated the process 10 times each, so Hotspot and OpenJ9 had time to optimize their compiled bytecode after each run.
Here's the code I'm using to perform the test:
Test Class --> Just copy & paste
package test;

import java.util.ArrayList;
import java.util.Collection;

public final class main {
  public main () {
    final long start = System.currentTimeMillis();
    @SuppressWarnings("serial")
    final ArrayList<String> test1 = new ArrayList<String>() {{
      int counter = 0;
      for (@SuppressWarnings("unused") final Object object : new Object[Short.MAX_VALUE * (Short.MAX_VALUE / 16)]) {
        if (counter == 1000) {
          this.add("Hi!");
        }
        else {
          this.add(null);
        }
        counter++;
      }
    }};
    System.out.println(main.containsNull(test1));
    final long end = System.currentTimeMillis();
    System.out.println(String.valueOf((end - start)/1000D) + " seconds");
  }
  public static final <Generic> Collection<Generic> containsNull (final Collection<Generic> genericCollection) {
    if ( null == genericCollection ) {
      throw new RuntimeException("No null collections allowed!");
    }
    final Collection<Generic> result_collection;
    final ArrayList<Generic> tmp_arrayList = new ArrayList<Generic>(genericCollection.size());
    for (final Generic generic : genericCollection) {
      if (generic != null) {
        tmp_arrayList.add(generic);
      }
    }
    tmp_arrayList.trimToSize();
    result_collection = tmp_arrayList;
    return result_collection;
  }
}
What could be happening?
If I recall correctly, once I read somewhere on the internet that OpenJ9 was way faster than Hotspot, at the cost of being more CPU intensive, whereas Hotspot was the opposite (+ RAM / - CPU).
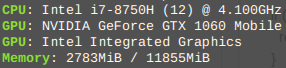
PC Specs
This may be trivial for some people, but i'm concerned over this topic 'cause, although I made this test just to show what's happening, things get worse when the array gets bigger, and the difference starts to become more and more noticeable...and this software I'm developing isn't going to run on this specific PC, but on lower end ones, with even bigger loads, so any improvement in this area will be welcome, no matter how big. Also, in my opinion, I'm pretty sure OpenJ9 is the best, as I've seen other areas where this VM is way better than Hotspot, so I'm confident that this can be improved...
I'd do bigger tests, but I hate waiting...
I have no clue over what's happening here.
Also any improvements/critics on my code are welcome...
P.S: Also I read about _System.arrayCopy vs Arrays.copyOf_,but anyways it seems both VM's now use System.arrayCopy internally when Arrays.copyOf is invoked...
Lastly, If you're wondering why I'm using ArrayLists instead of normal arrays, it's because my PC ran faster when using these instead of normal arrays.
EDIT: I almost forgot:
Hotspot

OpenJ9
 guekho64
All 13 comments
Thanks for reporting this @guekho64.
Can you provide the commandline options being used for both Hotspot and OpenJ9?
The benchmark looks to be very allocation heavy so different initial heap sizes may result in very different behaviour.
 DanHeidinga
on 1 May 2019
DanHeidinga
on 1 May 2019
Sorry for not posting them too. Initially I didn't use any VM arguments, but once I saw the results, I ran the final tests with these:
-Xmx1G -Xms1G
guekho64
on 2 May 2019
@DanHeidinga Any updates on this?
guekho64
on 6 May 2019
Just saying your testcase is very poorly done, this is not how you write micro benchmarks in Java.
Rewrite your benchmark to JMH, then post results again.
 FSichinger
on 6 May 2019
FSichinger
on 6 May 2019
@guekho64 Apologies it's going to take me a bit to get back to this. Currently working on a couple of other things related to startup improvements
DanHeidinga
on 7 May 2019
@DanHeidinga Ok, I undestand there are more important issues to solve before this one.
With some luck, maybe this issue will be solved without even noticing it...
guekho64
on 8 May 2019
@DanHeidinga I smell some clever use of the module system as hinted in @mstoodle's Testarossa slides from 2016. Dream come true, maybe?
 kimec
on 21 May 2019
kimec
on 21 May 2019
@charliegracie You had mentioned some analysis of this workload. Can you share it here?
DanHeidinga
on 23 May 2019
Hi @guekho64 I am taking a look at the test you provided. By only running the code 10 times neither Hotspot or OpenJ9 will have much opportunity to optimize the code being executed.
I am assuming that the part you want to measure is the loop adding values to the ArrayList because you mentioned optimizations around array copy, etc. Can you confirm if this is correct?
If my assumptions are correct can you confirm that this modified version of your program still reflects what you are trying to measure?
import java.util.ArrayList;
import java.util.Collection;

public final class Test5651 {
    public static void main(String[] args) {
        int arraySize = 1001;
        Object[] array = new Object[arraySize];
        // Warmup to give the JIT time to compile the hot paths
        for (int i = 0; i < 3001; i++) {
            ArrayList<String> test1 = testMethod(array);
            if (1 != Test5651.containsNull(test1).size()) {
                System.err.println("Error with test");
                System.exit(-1);
            }
        }
        //Do some GCs to get the heap close to its initial state
        System.gc();
        System.gc();

        //runtime loop count
        arraySize = Short.MAX_VALUE * (Short.MAX_VALUE / 16);
        array = new Object[arraySize];

        //Actual runtime testing
        for (int i = 0; i < 20; i++) {
            final long start = System.currentTimeMillis();
            ArrayList<String> test1 = testMethod(array);
            Collection<String> result = Test5651.containsNull(test1);
            final long end = System.currentTimeMillis();
            System.out.println(result);
            System.out.println(String.valueOf((end - start)/1000D) + " seconds");
            // After each test iteration perfrom some GCs to get the heap close to its initial state
            System.gc();
            System.gc();
        }
    }

    public static final ArrayList<String> testMethod(Object[] arrayData) {
        @SuppressWarnings("serial")
        final ArrayList<String> test1 = new ArrayList<String>() {{
            int counter = 0;
            for (@SuppressWarnings("unused") final Object object : arrayData) {
                if (counter == 1000) {
                    this.add("Hi!");
                }
                else {
                    this.add(null);
                }
                counter++;
            }
        }};
        return test1;
    }

    public static final <Generic> Collection<Generic> containsNull(final Collection<Generic> genericCollection) {
        if (null == genericCollection) {
            throw new RuntimeException("No null collections allowed!");
        }
        final Collection<Generic> result_collection;
        final ArrayList<Generic> tmp_arrayList = new ArrayList<Generic>(genericCollection.size());
        for (final Generic generic : genericCollection) {
            if (generic != null) {
                tmp_arrayList.add(generic);
            }
        }
        tmp_arrayList.trimToSize();
        result_collection = tmp_arrayList;
        return result_collection;
    }
}
 charliegracie
on 24 May 2019
charliegracie
on 24 May 2019
Sorry for not paying attention to this lately, I've been doin' other things in the meantime. I'll try your code as soon as I can @charliegracie.
Thanks for your attention!
guekho64
on 1 Jun 2019
@charliegracie Finally I've tested the code. I added some extra text for the sake of readability:
OpenJ9 VM
1° run
1.384 seconds
2° run
0.964 seconds
3° run
0.913 seconds
4° run
0.523 seconds
5° run
0.427 seconds
6° run
0.619 seconds
7° run
0.346 seconds
8° run
0.34 seconds
9° run
0.339 seconds
10° run
0.346 seconds
11° run
0.38 seconds
12° run
0.352 seconds
13° run
0.37 seconds
14° run
0.356 seconds
15° run
0.314 seconds
16° run
0.298 seconds
17° run
0.319 seconds
18° run
0.304 seconds
19° run
0.297 seconds
20° run
0.309 seconds

Average time: 0.475 seconds

Average time (Ignoring 1° run): 0.4271579 seconds
Hotspot VM
1° run
0.745 seconds
2° run
0.488 seconds
3° run
0.452 seconds
4° run
0.467 seconds
5° run
0.448 seconds
6° run
0.446 seconds
7° run
0.419 seconds
8° run
0.457 seconds
9° run
0.446 seconds
10° run
0.458 seconds
11° run
0.451 seconds
12° run
0.445 seconds
13° run
0.466 seconds
14° run
0.453 seconds
15° run
0.478 seconds
16° run
0.442 seconds
17° run
0.446 seconds
18° run
0.435 seconds
19° run
0.434 seconds
20° run
0.455 seconds

Average time: 0.46655 seconds

Average time (Ignoring 1° run): 0.45189473 seconds
After these tests, I can say that, although Hotspot's way faster from a cold start than OpenJ9, it doesn't optimize code as much as the latter does, but it has to warm up a bit before starting to do so...
These tests were run without any extra command line arguments (Aside from -Xmx10G -Xms 10G), and maybe with a little further VM tuning, OpenJ9 may be able to cut down some seconds...
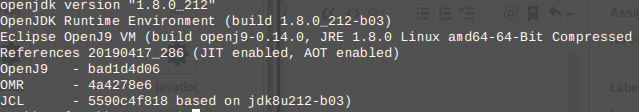
Also, both tests were run with Java12 _AdoptOpenJDK_ builds, which were:
---- Hotspot

----- OpenJ9

After seeing this, I suppose that I'll use Hotspot in the meantime, while OpenJ9 gets improved over this area, mainly because there's nothing like a fast & smooth program startup almost immediately after double-clicking an icon...
Fortunately, for other situations I still prefer OpenJ9 :face_with_head_bandage:
guekho64
on 26 Jun 2019
@guekho64 Can you try running with -Xshareclasses? This enables OpenJ9 to save class metadata and AOT JIT code so that subsequent runs are faster.
DanHeidinga
on 27 Jun 2019
@DanHeidinga
OpenJ9
1° run
1.848 seconds
2° run
1.1 seconds
3° run
0.697 seconds
4° run
0.839 seconds
5° run
0.549 seconds
6° run
0.427 seconds
7° run
0.365 seconds
8° run
0.448 seconds
9° run
0.446 seconds
10° run
0.447 seconds
11° run
0.453 seconds
12° run
0.449 seconds
13° run
0.443 seconds
14° run
0.442 seconds
15° run
0.445 seconds
16° run
0.441 seconds
17° run
0.469 seconds
18° run
0.45 seconds
19° run
0.453 seconds
20° run
0.447 seconds

Average time: 0.5829 seconds

Average time (Ignoring 1° run): 0.5163158 seconds
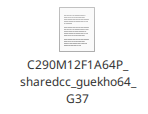
After the last execution, this folder was generated in $HOME/ And it only contains:OpenJ9, 2° test

1° run
1.256 seconds
2° run
0.645 seconds
3° run
0.401 seconds
4° run
0.385 seconds
5° run
0.385 seconds
6° run
0.392 seconds
7° run
0.346 seconds
8° run
0.436 seconds
9° run
0.435 seconds
10° run
0.441 seconds
11° run
0.437 seconds
12° run
0.436 seconds
13° run
0.438 seconds
14° run
0.439 seconds
15° run
0.436 seconds
16° run
0.439 seconds
17° run
0.438 seconds
18° run
0.44 seconds
19° run
0.434 seconds
20° run
0.439 seconds

Average time: 0.4749 seconds

Average time (Ignoring 1° run): 0.43378946 seconds
Hotspot
1° run
1.016 seconds
2° run
0.697 seconds
3° run
0.435 seconds
4° run
0.393 seconds
5° run
0.336 seconds
6° run
0.318 seconds
7° run
0.32 seconds
8° run
0.318 seconds
9° run
0.32 seconds
10° run
0.316 seconds
11° run
0.322 seconds
12° run
0.316 seconds
13° run
0.32 seconds
14° run
0.316 seconds
15° run
0.32 seconds
16° run
0.316 seconds
17° run
0.32 seconds
18° run
0.318 seconds
19° run
0.321 seconds
20° run
0.319 seconds

Average time: 0.38285 seconds

Average time (Ignoring 1° run): 0.34952632 seconds
I'm a bit confused after seeing these results, as it seems that even with -Xshareclasses, _OpenJ9_ doesn't improve its timing as expected (I already knew what -Xshareclasses does)
Could it be that, after upgrading the kernel, the results could get altered?
In my last comment, I was using 5.1.0-13.1-liquorix-amd64, whereas today I upgraded it to 5.1.0-15.1-liquorix-amd64, so...yeah, I don't know what else could be involved into this, apart from the own test and the different VM's (Which are the same as the last comment: Java 12 from AdoptOpenJDK)...
guekho64
on 28 Jun 2019
Related issues
 JasonFengJ9
·
3Comments
JasonFengJ9
·
3Comments
 hrstoyanov
·
4Comments
hrstoyanov
·
4Comments
 pshipton
·
3Comments
pshipton
·
3Comments
 Mesbah-Alam
·
5Comments
Mesbah-Alam
·
5Comments
 mikezhang1234567890
·
5Comments
mikezhang1234567890
·
5Comments
Most helpful comment
@guekho64 Apologies it's going to take me a bit to get back to this. Currently working on a couple of other things related to startup improvements