Openj9: JTReg test fail - Macos java8 : sun/rmi/rmic/manifestClassPath/run.sh
Failure link
https://ci.adoptopenjdk.net/view/Test_openjdk/job/openjdk8_j9_openjdktest_x86-64_macos/133/console
- test category: JTreg jdk_rim
- test suite name: jdk_rmi
- OS/architecture (macos):
- OpenJDK version (i.e. 8u202-b08):
- build level (i.e. -version output, with public shas):
07:25:09  OpenJDK Runtime Environment (build 1.8.0_202-internal-201903120454-b08)
07:25:09  Eclipse OpenJ9 VM (build master-1b67870e0, JRE 1.8.0 Mac OS X amd64-64-Bit Compressed References 20190312_182 (JIT enabled, AOT enabled)
07:25:09  OpenJ9   - 1b67870e0
07:25:09  OMR      - da32e2b9
07:25:09  JCL      - 9dc1c4d81c based on )
Optional info
- intermittent failure (yes|no): yes
- regression or new test: regression
Failure output
09:03:12  /Users/jenkins/workspace/openjdk8_j9_openjdktest_x86-64_macos/openjdkbinary/j2sdk-image/jre/bin/../../bin/java -ea -esa -Xmx512m -Xcompressedrefs -Djava.ext.dirs=jars/sub -cp . Main
09:03:12  PASS: succeeded as expected
09:03:12  rm -rf pkg Main.java MainI.java Main.class MainI.class Main_Stub.class
09:03:12  rm -rf jars MANIFEST.MF A.jar B.zip
09:03:12  FAIL: 2 tests failed
09:03:12  STDERR:
09:03:12  Note: Main.java uses or overrides a deprecated API.
09:03:12  Note: Recompile with -Xlint:deprecation for details.
09:03:12  Unhandled exception
09:03:12  Type=Segmentation error vmState=0x0005ffff
09:03:12  J9Generic_Signal_Number=00000004 Signal_Number=0000000b Error_Value=00000000 Signal_Code=00000000
09:03:12  Handler1=000000000DACF6A0 Handler2=000000000DCF23C0
09:03:12  RDI=000000000F47CCB5 RSI=00000000B0110384 RAX=0000000000000000 RBX=000000000F47CCB5
09:03:12  RCX=0000000000000000 RDX=00007FEC98D008D0 R8=00000000FFFFFFF3 R9=000000000000000D
09:03:12  R10=00007FEC98D008D0 R11=2000000000000000 R12=000000002D2899A0 R13=000000002D2899A0
09:03:12  R14=00000000FFFFFFF3 R15=0000000000000000
09:03:12  RIP=00007FFF8E54CA93 GS=0000 FS=0000 RSP=00000000B0110358
09:03:12  RFlags=0000000000010202 CS=002B RBP=00000000B0110370 ERR=2AE7000000000000
09:03:12  TRAPNO=000000000000000D CPU=0000000000000000 FAULTVADDR=000000002AE70000
09:03:12  XMM0 0000000000000000 (f: 0.000000, d: 0.000000e+00)
09:03:12  XMM1 000000ff00000000 (f: 0.000000, d: 5.411089e-312)
09:03:12  XMM2 000000ff00000000 (f: 0.000000, d: 5.411089e-312)
09:03:12  XMM3 0000025800000000 (f: 0.000000, d: 1.273197e-311)
09:03:12  XMM4 0000009600000320 (f: 800.000000, d: 3.182994e-312)
09:03:12  XMM5 0000000000000000 (f: 0.000000, d: 0.000000e+00)
09:03:12  XMM6 0000025800000000 (f: 0.000000, d: 1.273197e-311)
09:03:12  XMM7 0000009600000320 (f: 800.000000, d: 3.182994e-312)
09:03:12  XMM8 0000006400000008 (f: 8.000000, d: 2.121996e-312)
09:03:12  XMM9 0000000000000000 (f: 0.000000, d: 0.000000e+00)
09:03:12  XMM10 0000000000000000 (f: 0.000000, d: 0.000000e+00)
09:03:12  XMM11 0000000000000000 (f: 0.000000, d: 0.000000e+00)
09:03:12  XMM12 0000000000000000 (f: 0.000000, d: 0.000000e+00)
09:03:12  XMM13 0000000000000000 (f: 0.000000, d: 0.000000e+00)
09:03:12  XMM14 0000000000000000 (f: 0.000000, d: 0.000000e+00)
09:03:12  XMM15 0000000000000000 (f: 0.000000, d: 0.000000e+00)
09:03:12  Module=/usr/lib/system/libsystem_c.dylib
09:03:12  Module_base_address=00007FFF8E4EE000 Symbol=__findenv
09:03:12  Symbol_address=00007FFF8E54CA39
09:03:12
09:03:12  Method_being_compiled=sun/misc/Unsafe.setMemory(Ljava/lang/Object;JJB)V
09:03:12  Target=2_90_20190312_182 (Mac OS X 10.10.5)
09:03:12  CPU=amd64 (2 logical CPUs) (0x80000000 RAM)
09:03:12  ----------- Stack Backtrace -----------
09:03:12  ---------------------------------------
09:03:12  JVMDUMP039I Processing dump event "gpf", detail "" at 2019/03/12 01:02:27 - please wait.
09:03:12  JVMDUMP032I JVM requested System dump using '/Users/jenkins/workspace/openjdk8_j9_openjdktest_x86-64_macos/jvmtest/openjdk_regression/work/sun/rmi/rmic/manifestClassPath/run/core.20190312.010227.15203.0001.dmp' in response to an event
09:03:12  JVMDUMP012E Error in System dump: The core file created by child process with pid = 15204 was not found. Expected to find core file with name "/cores/core.15204"
09:03:12  JVMDUMP032I JVM requested Java dump using '/Users/jenkins/workspace/openjdk8_j9_openjdktest_x86-64_macos/jvmtest/openjdk_regression/work/sun/rmi/rmic/manifestClassPath/run/javacore.20190312.010227.15203.0002.txt' in response to an event
09:03:12  JVMDUMP010I Java dump written to /Users/jenkins/workspace/openjdk8_j9_openjdktest_x86-64_macos/jvmtest/openjdk_regression/work/sun/rmi/rmic/manifestClassPath/run/javacore.20190312.010227.15203.0002.txt
09:03:12  JVMDUMP032I JVM requested Snap dump using '/Users/jenkins/workspace/openjdk8_j9_openjdktest_x86-64_macos/jvmtest/openjdk_regression/work/sun/rmi/rmic/manifestClassPath/run/Snap.20190312.010227.15203.0003.trc' in response to an event
09:03:12  JVMDUMP010I Snap dump written to /Users/jenkins/workspace/openjdk8_j9_openjdktest_x86-64_macos/jvmtest/openjdk_regression/work/sun/rmi/rmic/manifestClassPath/run/Snap.20190312.010227.15203.0003.trc
09:03:12  JVMDUMP007I JVM Requesting JIT dump using '/Users/jenkins/workspace/openjdk8_j9_openjdktest_x86-64_macos/jvmtest/openjdk_regression/work/sun/rmi/rmic/manifestClassPath/run/jitdump.20190312.010227.15203.0004.dmp'
09:03:12  JVMDUMP010I JIT dump written to /Users/jenkins/workspace/openjdk8_j9_openjdktest_x86-64_macos/jvmtest/openjdk_regression/work/sun/rmi/rmic/manifestClassPath/run/jitdump.20190312.010227.15203.0004.dmp
09:03:12  JVMDUMP013I Processed dump event "gpf", detail "".
09:03:12  Exception in thread "main" java.rmi.StubNotFoundException: Stub class not found: Main_Stub; nested exception is:
09:03:12    java.lang.ClassNotFoundException: Main_Stub
09:03:12    at sun.rmi.server.Util.createStub(Util.java:297)
09:03:12    at sun.rmi.server.Util.createProxy(Util.java:142)
09:03:12    at sun.rmi.server.UnicastServerRef.exportObject(UnicastServerRef.java:225)
09:03:12    at java.rmi.server.UnicastRemoteObject.exportObject(UnicastRemoteObject.java:383)
09:03:12    at java.rmi.server.UnicastRemoteObject.exportObject(UnicastRemoteObject.java:301)
09:03:12    at Main.main(Main.java:10)
09:03:12  Caused by: java.lang.ClassNotFoundException: Main_Stub
09:03:12    at java.lang.Class.forNameImpl(Native Method)
09:03:12    at java.lang.Class.forName(Class.java:403)
09:03:12    at sun.rmi.server.Util.createStub(Util.java:292)
09:03:12    ... 5 more
09:03:12  Note: Main.java uses or overrides a deprecated API.
09:03:12  Note: Recompile with -Xlint:deprecation for details.
09:03:12  rerun:
09:03:12  cd /Users/jenkins/workspace/openjdk8_j9_openjdktest_x86-64_macos/jvmtest/openjdk_regression/work/sun/rmi/rmic/manifestClassPath/run && \
09:03:12  HOME=/Users/jenkins \
09:03:12  PATH=/bin:/usr/bin \
09:03:12  TESTSRC=/Users/jenkins/workspace/openjdk8_j9_openjdktest_x86-64_macos/openjdk-tests/openjdk_regression/openjdk-jdk/jdk/test/sun/rmi/rmic/manifestClassPath \
09:03:12  TESTSRCPATH=/Users/jenkins/workspace/openjdk8_j9_openjdktest_x86-64_macos/openjdk-tests/openjdk_regression/openjdk-jdk/jdk/test/sun/rmi/rmic/manifestClassPath \
09:03:12  TESTCLASSES=/Users/jenkins/workspace/openjdk8_j9_openjdktest_x86-64_macos/jvmtest/openjdk_regression/work/classes/0/sun/rmi/rmic/manifestClassPath \
09:03:12  TESTCLASSPATH=/Users/jenkins/workspace/openjdk8_j9_openjdktest_x86-64_macos/jvmtest/openjdk_regression/work/classes/0/sun/rmi/rmic/manifestClassPath \
09:03:12  COMPILEJAVA=/Users/jenkins/workspace/openjdk8_j9_openjdktest_x86-64_macos/openjdkbinary/j2sdk-image/jre/bin/../.. \
09:03:12  TESTJAVA=/Users/jenkins/workspace/openjdk8_j9_openjdktest_x86-64_macos/openjdkbinary/j2sdk-image/jre/bin/../.. \
09:03:12  TESTVMOPTS='-ea -esa -Xmx512m -Xcompressedrefs' \
09:03:12  TESTTOOLVMOPTS='-J-ea -J-esa -J-Xmx512m -J-Xcompressedrefs' \
09:03:12  TESTJAVACOPTS= \
09:03:12  TESTJAVAOPTS= \
09:03:12  TESTTIMEOUTFACTOR=8.0 \
09:03:12  TESTROOT=/Users/jenkins/workspace/openjdk8_j9_openjdktest_x86-64_macos/openjdk-tests/openjdk_regression/openjdk-jdk/jdk/test \
09:03:12  FS=/ \
09:03:12  PS=: \
09:03:12  NULL=/dev/null \
09:03:12      sh \
09:03:12          /Users/jenkins/workspace/openjdk8_j9_openjdktest_x86-64_macos/openjdk-tests/openjdk_regression/openjdk-jdk/jdk/test/sun/rmi/rmic/manifestClassPath/run.sh
09:03:12
09:03:12  TEST RESULT: Failed. Execution failed: exit code 1
Include the test name
 sophia-guo
All 52 comments
Crash compiling method:
09:03:12 Method_being_compiled=sun/misc/Unsafe.setMemory(Ljava/lang/Object;JJB)V
fyi @andrewcraik
 DanHeidinga
on 12 Mar 2019
DanHeidinga
on 12 Mar 2019
@DanHeidinga do you have any kind of backtrace for the crashing thread? something very weird since this is OSX specific...
 andrewcraik
on 12 Mar 2019
andrewcraik
on 12 Mar 2019
@sophia-guo Do you have the javacore / system core from this test failure? I've checked the jenkins results files and can only find the JTR files.
DanHeidinga
on 13 Mar 2019
There is a core attached to the similar recent failure in #5046
https://ci.eclipse.org/openj9/job/Test-sanity.functional-JDK8-osx_x86-64_cmprssptrs/230/artifact/functional_test_output.tar.gz
@andrewcraik
 pshipton
on 15 Mar 2019
pshipton
on 15 Mar 2019
FYI @cathyzhyi Can you take a look at the core Peter mentioned in the comment above? If it's not downloaded somewhere soon it'll be automatically removed
DanHeidinga
on 15 Mar 2019
fyi I copied the result file to /team/triage/openj9-5046
pshipton
on 15 Mar 2019
@pshipton do you know where can I find the sdk generating the coredump?
 cathyzhyi
on 18 Mar 2019
cathyzhyi
on 18 Mar 2019
@sophia-guo Is there a way to find the binary generating the coredump so that I can look at the back trace of the crashing?
cathyzhyi
on 20 Mar 2019
@sophia-guo since this is an issue getting some attention could you please reply to @cathyzhyi ?
andrewcraik
on 25 Mar 2019
@andrewcraik sorry, missed the message.
@cathyzhyi according to the java -version information:
07:25:09  OpenJDK Runtime Environment (build 1.8.0_202-internal-201903120454-b08)
07:25:09  Eclipse OpenJ9 VM (build master-1b67870e0, JRE 1.8.0 Mac OS X amd64-64-Bit Compressed References 20190312_182 (JIT enabled, AOT enabled)
07:25:09  OpenJ9   - 1b67870e0
07:25:09  OMR      - da32e2b9
07:25:09  JCL      - 9dc1c4d81c based on )
Ok so I have used lldb to get a backtrace:
    frame #14: 0x00007fff9620c7d5 libsystem_c.dylib`__findenv + 85
    frame #15: 0x00007fff9620c868 libsystem_c.dylib`getenv + 29
    frame #16: 0x0000000006ab37f8 libj9prt29.dylib`omrsysinfo_get_env + 24
    frame #17: 0x0000000006d79191 libj9jit29.dylib`feGetEnv(char const*) + 81
    frame #18: 0x0000000006dbaa18 libj9jit29.dylib`J9::X86::CPU::queryX86TargetCPUID() + 136
    frame #19: 0x0000000006dbad6e libj9jit29.dylib`OMR::X86::CPU::getX86ProcessorVendorId() + 14
    frame #20: 0x000000000720d93b libj9jit29.dylib`TR_X86ProcessorInfo::initialize() + 75
    frame #21: 0x000000000720db50 libj9jit29.dylib`OMR::X86::CodeGenerator::initialize(TR::Compilation*) + 32
    frame #22: 0x000000000725a477 libj9jit29.dylib`OMR::X86::AMD64::CodeGenerator::CodeGenerator() + 423
    frame #23: 0x0000000006c58550 libj9jit29.dylib`J9::CodeGenerator::CodeGenerator() + 32
    frame #24: 0x0000000006d92fb1 libj9jit29.dylib`J9::X86::CodeGenerator::CodeGenerator() + 17
    frame #25: 0x0000000006f1d999 libj9jit29.dylib`OMR::Compilation::Compilation(int, OMR_VMThread*, TR_FrontEnd*, TR_ResolvedMethod*, TR::IlGenRequest&, TR::Options&, TR::Region&, TR_Memory*, TR_OptimizationPlan*) + 4569
    frame #26: 0x0000000006c71b60 libj9jit29.dylib`J9::Compilation::Compilation(int, J9VMThread*, TR_FrontEnd*, TR_ResolvedMethod*, TR::IlGenRequest&, TR::Options&, TR::Region&, TR_Memory*, TR_OptimizationPlan*, TR_RelocationRuntime*) + 96
    frame #27: 0x0000000006c8ea05 libj9jit29.dylib`TR::CompilationInfoPerThreadBase::wrappedCompile(J9PortLibrary*, void*) + 4405
    frame #28: 0x0000000006aac277 libj9prt29.dylib`omrsig_protect + 983
    frame #29: 0x0000000006c887fa libj9jit29.dylib`TR::CompilationInfoPerThreadBase::compile(J9VMThread*, TR_MethodToBeCompiled*, J9::J9SegmentProvider&) + 954
    frame #30: 0x0000000006c87d64 libj9jit29.dylib`TR::CompilationInfoPerThread::processEntry(TR_MethodToBeCompiled&, J9::J9SegmentProvider&) + 484
    frame #31: 0x0000000006c86ef8 libj9jit29.dylib`TR::CompilationInfoPerThread::processEntries() + 408
    frame #32: 0x0000000006c86ace libj9jit29.dylib`protectedCompilationThreadProc(J9PortLibrary*, TR::CompilationInfoPerThread*) + 190
    frame #33: 0x0000000006aac277 libj9prt29.dylib`omrsig_protect + 983
    frame #34: 0x0000000006c8500b libj9jit29.dylib`compilationThreadProc(void*) + 939
    frame #35: 0x0000000005fe80b9 libj9thr29.dylib`thread_wrapper + 361
    frame #36: 0x00007fff909de99d libsystem_pthread.dylib`_pthread_body + 131
    frame #37: 0x00007fff909de91a libsystem_pthread.dylib`_pthread_start + 168
    frame #38: 0x00007fff909dc351 libsystem_pthread.dylib`thread_start + 13
so looking at the code the queryX86TargetCPUID includes code from x/runtime/X86Runtime.hpp which does call feGetEnv with the string "TR_DisableAVX".
looking at the disassembly of __findenv we see the string TR_DisableAVX is available in registers rbx and rdi. From what I can find __findenv(name, offset) and name being the first argument and the string being available in rdi matches up. offset is an int pointer what will be updated with a result and is not involved.
This seems to suggest there is something wrong with the state of the system at the point where we called the omrsysinfo_get_env. I note that OSX does not supply a thread safe getenv. I don't see us trying to putenv to the TR_DisableAVX so the usual problem of the put value being freed doesn't seem to be the problem. I'm not sure if this is some kind of init related problem or it is a threading problem. @DanHeidinga and @pshipton since this seems to be related to the port library could you find someone to take a look? I'm not really sure what the issue is since the feGetEnv call looks normal.
andrewcraik
on 26 Mar 2019
@sharon-wang Can you take a look at this? @babsingh has done a bunch of the mac bringup work and is a good resource for help with mac-specific issues.
DanHeidinga
on 26 Mar 2019
From adoptopenjdk test history [1], there was no recent failure as this PR.
Tried a 100x internal jenkins grinder against latest nightly build, all passed (BUILD_LIST: openjdk_regression, CUSTOM_TARGET: sun/rmi/rmic/manifestClassPath/run.sh)
@sophia-guo could you check if this failure can be reproduced at latest adoptopenjdk builds?
[1] https://ci.adoptopenjdk.net/view/Test_openjdk/job/openjdk8_j9_openjdktest_x86-64_macos
 JasonFengJ9
on 26 Mar 2019
JasonFengJ9
on 26 Mar 2019
There is a failure in https://github.com/eclipse/openj9/issues/5046 which is crashing in __findenv as well so I don't know that the problem has actually gone away - it seems to be able to manifest in a number of different cases. FYI @JasonFengJ9 and @sophia-guo and @sharon-wang
andrewcraik
on 26 Mar 2019
@JasonFengJ9 The test has been excluded so there will be no failure as this PR from AdoptOpenJDK test history.
Tried a 20x AdoptOpenJDK with latest nightly build it wasn't reproduced.
sophia-guo
on 26 Mar 2019
Does a grinder from one of the failures in #5046 reproduce? There seems to be a gremlin running around though maybe it has been fixed I worry it is just infrequent.
andrewcraik
on 26 Mar 2019
@andrewcraik not able to reproduce the failure in #5046 yet (300x with cmdLineTester_SCCommandLineOptionTests_1). Am going to try a few more.
JasonFengJ9
on 28 Mar 2019
@JasonFengJ9 Ok well if it is gone I guess that is good news - I'm happy to proceed at your discression on whether to close or not since I think the issue is portlib/OS and not JIT as such. Thank you for the continued investigation.
andrewcraik
on 28 Mar 2019
After a few unsuccessful attempts to reproduce the failure with internal jenkins grinder, I am wondering if this can only be reproduced at external machines. We might need run larger grinders on either adoptopenjdk or eclipse sites.
@pshipton @sophia-guo could you help?
BUILD_LIST: openjdk_regression
CUSTOM_TARGET: sun/rmi/rmic/manifestClassPath/run.sh
or
TARGET: cmdLineTester_SCCommandLineOptionTests_1
The failures were reported against both JDK11 and JDK8, so either SDK can be used.
JasonFengJ9
on 28 Mar 2019
Trying a single run at OpenJ9 https://ci.eclipse.org/openj9/view/Test_grinder/job/Test-Grinder/340/
pshipton
on 28 Mar 2019
https://ci.eclipse.org/openj9/view/Test_grinder/job/Test-Grinder/340/ failed to get the nightly build from Adopt. @smlambert
pshipton
on 28 Mar 2019
pshipton
on 28 Mar 2019
Not sure what is wrong now
11:05:38  get jdk binary...
11:05:38  --sdkdir is set to customized. Therefore, skip download jdk binary
11:05:38  ls: */: No such file or directory
https://ci.eclipse.org/openj9/view/Test_grinder/job/Test-Grinder/340/ is the issue https://github.com/AdoptOpenJDK/openjdk-tests/issues/1033
https://ci.eclipse.org/openj9/view/Test_grinder/job/Test-Grinder/341/ I don't have permission to check the configuration or rerun. Could you try to rerun with set TARGET as jdk_custom? My guess is the TARGET is empty.
@pshipton
sophia-guo
on 28 Mar 2019
Yes the TARGET was empty. Started a new build https://ci.eclipse.org/openj9/view/Test_grinder/job/Test-Grinder/342/
pshipton
on 28 Mar 2019
100x on AdoptOpenJDK with target CUSTOM_TARGET: sun/rmi/rmic/manifestClassPath/run.sh https://ci.adoptopenjdk.net/view/Test_grinder/job/Grinder/1386/
Passed
sophia-guo
on 28 Mar 2019
https://ci.eclipse.org/openj9/view/Test_grinder/job/Test-Grinder/343/console
I got further, but still problems
14:41:44  Error: JAVA_HOME is not defined correctly.
14:41:44    We cannot execute /Users/jenkins/workspace/Test-Grinder/openjdkbinary/j2sdk-image/bin/../../bin/java
14:41:44  make: *** [compile] Error 1
@pshipton parameters JDK_VERSION=8 and JDK_IMPL=openj9 helped me get past that error
 sharon-wang
on 28 Mar 2019
sharon-wang
on 28 Mar 2019
ok thanks. The instructions say that AUTO_DETECT is supposed to figure that out.
https://ci.eclipse.org/openj9/view/Test_grinder/job/Test-Grinder/344/
pshipton
on 28 Mar 2019
That worked, so trying 50 iterations
https://ci.eclipse.org/openj9/view/Test_grinder/job/Test-Grinder/345/
pshipton
on 28 Mar 2019
Trying 60 iterations each
https://ci.eclipse.org/openj9/view/Test_grinder/job/Test-Grinder/346/
https://ci.eclipse.org/openj9/view/Test_grinder/job/Test-Grinder/347/
https://ci.eclipse.org/openj9/view/Test_grinder/job/Test-Grinder/348/
https://ci.eclipse.org/openj9/view/Test_grinder/job/Test-Grinder/349/
pshipton
on 28 Mar 2019
Another 80 per
https://ci.eclipse.org/openj9/view/Test_grinder/job/Test-Grinder/350/
https://ci.eclipse.org/openj9/view/Test_grinder/job/Test-Grinder/351/
https://ci.eclipse.org/openj9/view/Test_grinder/job/Test-Grinder/352/
https://ci.eclipse.org/openj9/view/Test_grinder/job/Test-Grinder/353/
pshipton
on 28 Mar 2019
Maybe try a grinder with the SDK [1] failed the test initially.
JasonFengJ9
on 28 Mar 2019
Already started another set, 120 per. Will try the older SDK after.
https://ci.eclipse.org/openj9/view/Test_grinder/job/Test-Grinder/354/
https://ci.eclipse.org/openj9/view/Test_grinder/job/Test-Grinder/355/
https://ci.eclipse.org/openj9/view/Test_grinder/job/Test-Grinder/356/
https://ci.eclipse.org/openj9/view/Test_grinder/job/Test-Grinder/357/
pshipton
on 28 Mar 2019
80 per with the original failing JVM as per https://github.com/eclipse/openj9/issues/5061#issuecomment-477767234
https://ci.eclipse.org/openj9/view/Test_grinder/job/Test-Grinder/358/
https://ci.eclipse.org/openj9/view/Test_grinder/job/Test-Grinder/359/
pshipton
on 28 Mar 2019
Thanks @pshipton @sophia-guo
Given none of grinders reproduced the failure, I am leaning toward re-enabling this test and close the issue.
If the crash occurs again, we can re-open it.
JasonFengJ9
on 29 Mar 2019
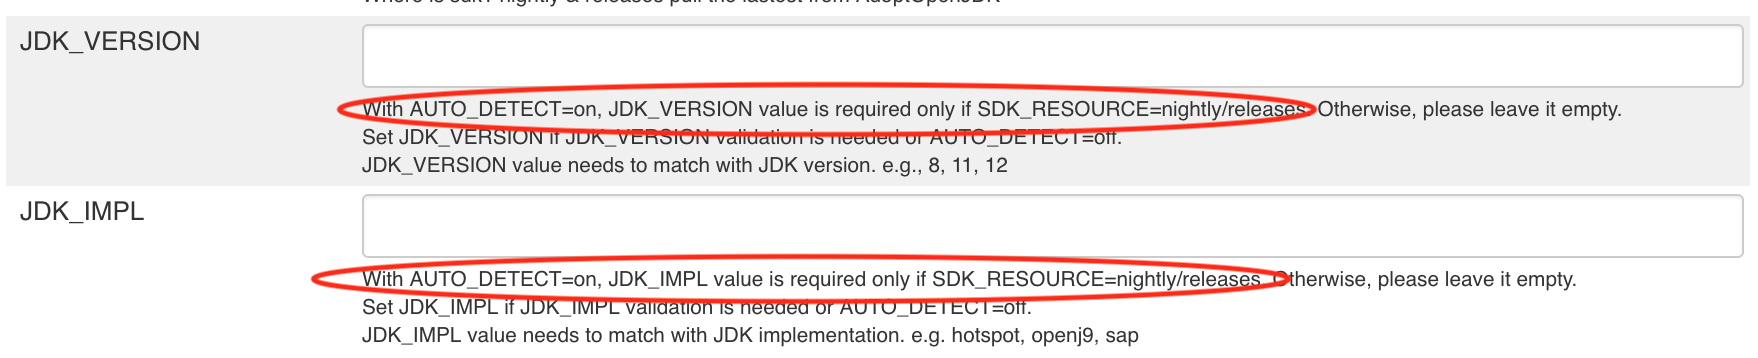
I am thinking we should change the default setting for Grinder to be AUTO_DETECT off, as the common use case for Grinders seems to be asking for a "nightly" build.
In that case, you must instruct on which JDK_IMPL and JDK_VERSION ahead of time, so we know what Adopt API URL to build. Auto-detect works if you give a link to a CUSTOMIZED_SDK_URL, because we then just fetch the SDK directly from that location.
We added a note in the fine print of the Grinder job, but I think no one sees it.
 smlambert
on 29 Mar 2019
smlambert
on 29 Mar 2019
Thanks @smlambert quick action on https://github.com/AdoptOpenJDK/openjdk-tests/pull/1045 and also pointed out that the test might not be excluded at first place due to a platform code typo https://github.com/AdoptOpenJDK/openjdk-tests/pull/1045#pullrequestreview-220514363.
This explains why the grinders for this test still run.
JasonFengJ9
on 29 Mar 2019
@smlambert I am setting a customized URL. When I didn't set JDK_VERSION and JDK_IMPL I got https://github.com/eclipse/openj9/issues/5061#issuecomment-477726113
I have AUTO_DETECT on, but needed to set values for the grinders to work.
pshipton
on 29 Mar 2019
I see, so sounds like may be a bug related to recent changes https://github.com/eclipse/openj9/pull/5155
smlambert
on 29 Mar 2019
Looked at the native stacktrace from the core file https://github.com/eclipse/openj9/issues/5061#issuecomment-473422243
    frame #12: 0x0000000006aad625 libj9prt29.dylib`masterSynchSignalHandler + 613
    frame #13: 0x00007fff9804152a libsystem_platform.dylib`_sigtramp + 26
    frame #14: 0x00007fff9620c7d5 libsystem_c.dylib`__findenv + 85
    frame #15: 0x00007fff9620c868 libsystem_c.dylib`getenv + 29
    frame #16: 0x0000000006ab37f8 libj9prt29.dylib`omrsysinfo_get_env + 24
    frame #17: 0x0000000006d79191 libj9jit29.dylib`feGetEnv(char const*) + 81
    frame #18: 0x0000000006dbaa18 libj9jit29.dylib`J9::X86::CPU::queryX86TargetCPUID() + 136
As per port/unix/omrsysinfo.c
omrsysinfo_get_env(struct OMRPortLibrary *portLibrary, const char *envVar, char *infoString, uintptr_t bufSize)
{
    char *value = (char *)getenv(envVar);  <---- the call led to Segmentation error
    uintptr_t len;
I am guessing envVar was a null or something bogus which came from the caller libj9jit29.dylib feGetEnv(char const*). It doesn't appear port library played a role here.
JasonFengJ9
on 29 Mar 2019
@JasonFengJ9 I have checked the core and the envVar is a static string and definitely not null. That is why I passed it for investigation by those with OSX expertise. The queryX86TargetCPUID as no dynamic strings for any feGetEnv. I think this is a platform issue.
andrewcraik
on 2 Apr 2019
@andrewcraik here are some findings with much appreciated help from @babsingh.
There are three calls to 'omrsysinfo_get_env' in feGetEnv2 (lines 1938, 1944, 1950), but the exact source of failure could not be pinpointed, since the problem appears to be not reproducible.
https://github.com/eclipse/openj9/blob/127ba34f1b6b2338beeed7ca1cf2e393640fae66/runtime/compiler/runtime/Runtime.cpp#L1930-L1956
This issue does not appear to be a portlib issue, since omrsysinfo_get_env passes the const string directly to getenv without changing anything.
Since the segfault originates from _findenv from libsystem_c.dylib, this could be a machine-specific failure. Recording the machine information (hostname, IP, Xcode version, etc.) would be helpful if the issue occurs again in the future.
The OSX implementation of getEnv is not thread-safe, as you noted earlier, so memory corruption is possible and appears to be a known issue.
Man page for Mac OS getenv: https://developer.apple.com/library/archive/documentation/System/Conceptual/ManPages_iPhoneOS/man3/getenv.3.html
The doc notes the following bug:
 Successive calls to setenv() or putenv() assigning a differently sized
 value to the same name will result in a memory leak.  The FreeBSD semantics
 for these functions (namely, that the contents of value are copied
 and that old values remain accessible indefinitely) make this bug
 unavoidable.  Future versions may eliminate one or both of these semantic
 guarantees in order to fix the bug.
sharon-wang
on 2 Apr 2019
@sharon-wang thanks for the additional analysis - I didn't think it was the portlib it is just that I have never worked on OSX so was hoping for some help with the OS part of the analysis (which you gave - thanks!). I agree that it is very weird. The constant strings are passed through. I did do a codebase grep for putenv and there are none related to any of the JIT env vars so the usual dealloc of the value put into an env var doesn't seem to be in play here.
The vast majority of the feGetEnv calls in the JIT simply check the result for NULL / not NULL so we don't even really care what is in the string (and that would mean the usual putenv wouldn't be a problem because the non-NULL result is all we would care about we wouldn't even try to read the string).
It may be a machine issue so recording the history is a good idea. I also wasn't sure if the failure was due to some kind of timing weirdness related to the dylib loading vs other shared library loading...
We'll have to monitor to see if it reproduces again in the near future - it is a worrying problem, but it is not clear why it is a problem especially given the _findenv failure point.
andrewcraik
on 3 Apr 2019
There are two potential issues in the getEnv code. I've opened a pull request to address them. They likely aren't the cause of this failure, but may as well clean up the code while we're looking at it.
DanHeidinga
on 3 Apr 2019
Will be interesting to see a core with those clean-ups if it happens again after the PR merges.
andrewcraik
on 3 Apr 2019
The failure was seen again - https://ci.eclipse.org/openj9/view/Test/job/Test-sanity.functional-JDK11-osx_x86-64_cmprssptrs/307/tapResults/
DanHeidinga
on 8 Apr 2019
new crash looks very similar - still in __findenv at what looks to be the same spot. I can't seem to find the core so not having much luck going further. Looks like whatever the issue is wasn't fixed by 5340 :(
andrewcraik
on 10 Apr 2019
@andrewcraik I copied the core files to /team:
- Old core file (renamed): /team/triage/openj9-5046/corefiles_15Mar19.tar.gz
- New core file: /team/triage/openj9-5046/corefiles_11Apr19.tar.gz
Machine where the failure occurred: osx1011-x86-2 (setup for building Java 8; has XCode 4 and 7)
Stack (similar but different starting point):
    frame #13: 0x00007fff8cb2a52a libsystem_platform.dylib`_sigtramp + 26
    frame #14: 0x00007fff8638d7d5 libsystem_c.dylib`__findenv + 85
    frame #15: 0x00007fff8638d868 libsystem_c.dylib`getenv + 29
    frame #16: 0x000000000fe96178 libj9prt29.dylib`omrsysinfo_get_env + 24
    frame #17: 0x0000000010156d47 libj9jit29.dylib`feGetEnv(char const*) + 71
    frame #18: 0x000000001019873e libj9jit29.dylib`J9::X86::CPU::queryX86TargetCPUID() + 126
    frame #19: 0x0000000010198ade libj9jit29.dylib`OMR::X86::CPU::getX86ProcessorFeatureFlags2() + 14
    frame #20: 0x000000001060dbdb libj9jit29.dylib`TR_X86IntegerMultiplyDecomposer::hasDecomposition(long long) + 139
    frame #21: 0x000000001060deb0 libj9jit29.dylib`OMR::X86::CodeGenerator::initialize(TR::Compilation*) + 32
Potential next steps:
1) Is there a bug in libsystem_c.dylib (Xcode related)? Is there an issue with osx1011-x86-2?
2) Due to no thread-safety, getenv may end up using stale pointers resulting in the segfault. Just looking at the core file won't be sufficient to comprehend, fix or tag this as a thread-safety issue. We will need to use valgrind and lldb (live debugging) to identify memory corruption in the multi-threaded environment. For live debugging, we need to reproduce the issue locally. Running the test in a grinder or locally hasn't reproduced the issue; also, an indicator that this may be a machine specific issue. Probably, we may need a micro-test which invokes the above JIT code path repeatedly in a multi-threaded setting for reproducing the failure.
3) I don't think omrsysinfo_get_env is guaranteed to be thread-safe. if this issue is related to thread-safety, it's best to handle it in feGetEnv/feGetEnv2 (localized scope). Can we read the environment variable(s) once at startup (single-threaded), cache the value, and read the cached value later? This will allow us to avoid calls to omrsysinfo_get_env in a multi-threaded setting. If this is not possible i.e. the latest env. var. value is needed every time, then a synchronization data-structure (such as omrthread_monitor_t) will need to be used.
 babsingh
on 11 Apr 2019
babsingh
on 11 Apr 2019
Assuming that https://github.com/eclipse/openj9/issues/5153 is the same issue, which it appears to be, the issue has shown up in both osx1011-x86-1 and osx1011-x86-2 so likely not machine specific.
 theresa-m
on 13 Nov 2019
pshipton
on 10 Dec 2020
theresa-m
on 13 Nov 2019
pshipton
on 10 Dec 2020
Related issues
 xliang6
·
3Comments
xliang6
·
3Comments
 JamesKingdon
·
5Comments
JasonFengJ9
·
5Comments
DanHeidinga
·
4Comments
JamesKingdon
·
5Comments
JasonFengJ9
·
5Comments
DanHeidinga
·
4Comments
 mikezhang1234567890
·
5Comments
mikezhang1234567890
·
5Comments
Most helpful comment
There are two potential issues in the getEnv code. I've opened a pull request to address them. They likely aren't the cause of this failure, but may as well clean up the code while we're looking at it.
PR: https://github.com/eclipse/openj9/pull/5340