Openhab-addons: [knx] Device status cannot be polled
On some installations, apparently the device status polling does not work as expected:
As a result, the following symptoms can be observed:
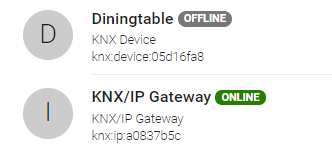
- the
device-Things areOFFLINE - the log contains warnings like
2018-03-18 08:19:54.209 [WARN ] [Xnet/IP Tunneling 192.168.10.26:3671] - response timeout waiting for confirmation
tuwien.auto.calimero.KNXTimeoutException: no confirmation reply received for 3.1.101->3.1.23 L_Data.req, system priority hop count 6 repeat, tpdu 80
    at tuwien.auto.calimero.knxnetip.ClientConnection.doExtraBlockingModes(ClientConnection.java:244) ~[?:?]
    at tuwien.auto.calimero.knxnetip.ConnectionBase.send(ConnectionBase.java:258) ~[?:?]
    at tuwien.auto.calimero.knxnetip.KNXnetIPTunnel.send(KNXnetIPTunnel.java:178) ~[?:?]
    at tuwien.auto.calimero.link.KNXNetworkLinkIP.onSend(KNXNetworkLinkIP.java:243) ~[?:?]
    at tuwien.auto.calimero.link.AbstractLink.send(AbstractLink.java:351) ~[?:?]
    at tuwien.auto.calimero.link.KNXNetworkLinkIP.sendRequestWait(KNXNetworkLinkIP.java:222) ~[?:?]
    at tuwien.auto.calimero.mgmt.TransportLayerImpl.connect(TransportLayerImpl.java:327) ~[?:?]
    at tuwien.auto.calimero.mgmt.ManagementClientImpl.send(ManagementClientImpl.java:796) ~[?:?]
    at tuwien.auto.calimero.mgmt.ManagementClientImpl.sendWait2(ManagementClientImpl.java:824) ~[?:?]
    at tuwien.auto.calimero.mgmt.ManagementClientImpl.readDeviceDesc(ManagementClientImpl.java:447) ~[?:?]
    at tuwien.auto.calimero.mgmt.ManagementProceduresImpl.isAddressOccupied(ManagementProceduresImpl.java:310) ~[?:?]
    at org.openhab.binding.knx.internal.client.AbstractKNXClient.isReachable(AbstractKNXClient.java:338) ~[?:?]
    at org.openhab.binding.knx.handler.AbstractKNXThingHandler.pollDeviceStatus(AbstractKNXThingHandler.java:144) ~[?:?]
    at org.openhab.binding.knx.handler.AbstractKNXThingHandler.lambda$1(AbstractKNXThingHandler.java:184) ~[?:?]
    at java.util.concurrent.Executors$RunnableAdapter.call(Executors.java:511) [?:?]
    at java.util.concurrent.FutureTask.runAndReset(FutureTask.java:308) [?:?]
    at java.util.concurrent.ScheduledThreadPoolExecutor$ScheduledFutureTask.access$301(ScheduledThreadPoolExecutor.java:180) [?:?]
    at java.util.concurrent.ScheduledThreadPoolExecutor$ScheduledFutureTask.run(ScheduledThreadPoolExecutor.java:294) [?:?]
    at java.util.concurrent.ThreadPoolExecutor.runWorker(ThreadPoolExecutor.java:1149) [?:?]
    at java.util.concurrent.ThreadPoolExecutor$Worker.run(ThreadPoolExecutor.java:624) [?:?]
    at java.lang.Thread.run(Thread.java:748) [?:?]
The communication though works perfectly fine, i.e. they can be used despite the fact that they are displayed as OFFLINE.
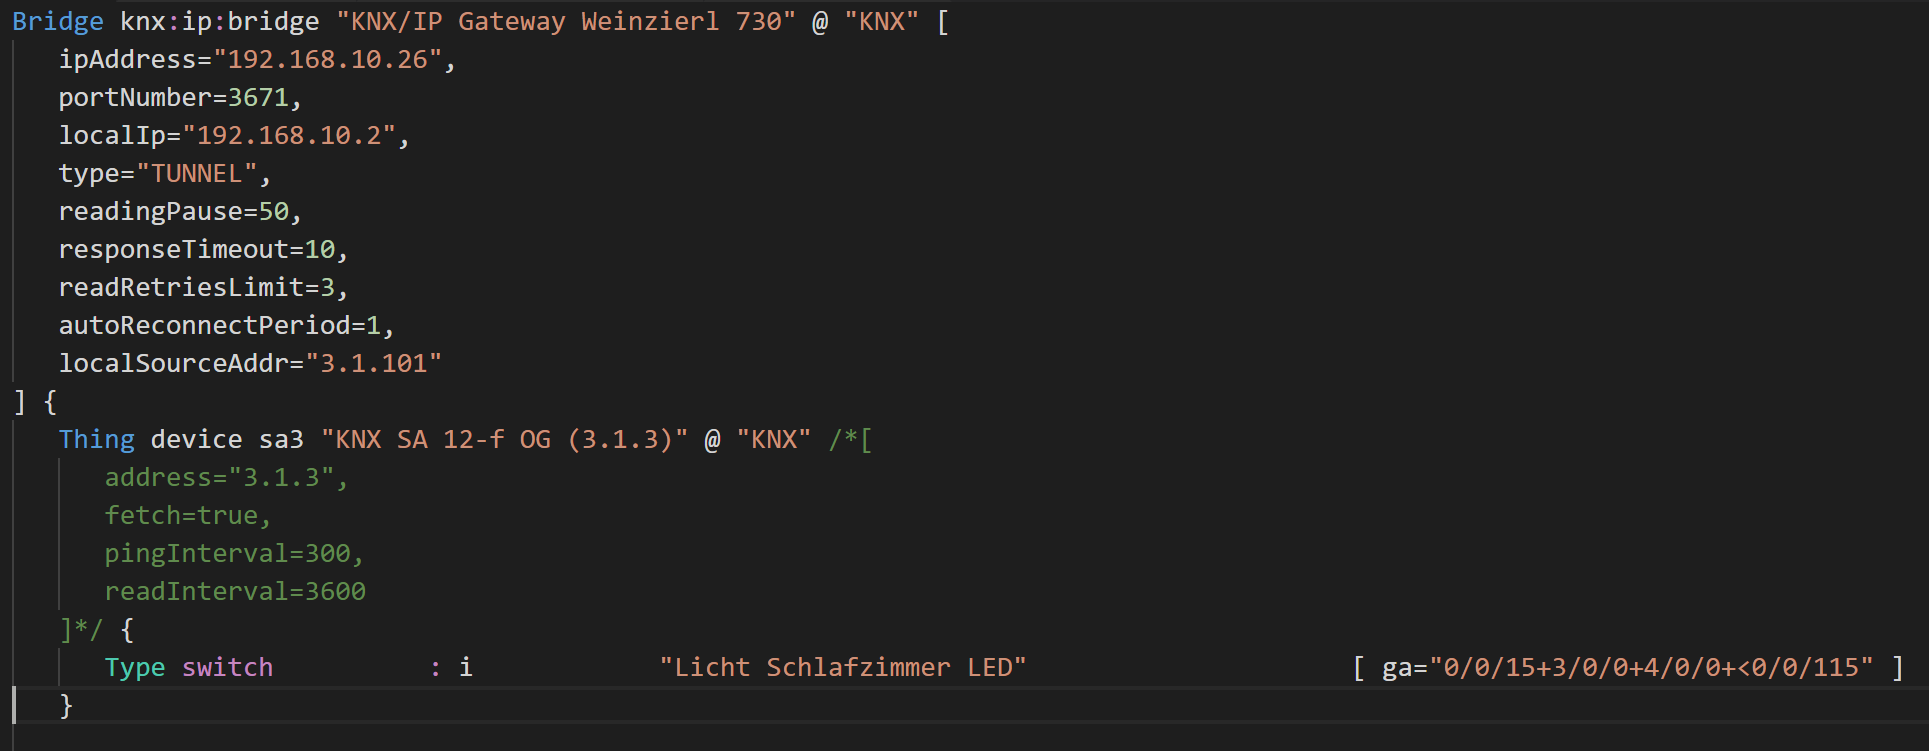
As possible work-around is to remove (or comment-out) the address="1.2.3" configuration parameter from such things.
Any help in understanding the reasons why it doesn't work on some systems/configurations is appreciated!
 sjka
sjka
All 9 comments
Might this be related to the issue which I regularly faced after switching to OH 2 stable? Cf.
https://community.openhab.org/t/regular-knx-link-loss-since-upgrade-to-2-2/37658
The current solution works but it's still strange as hadn't changed anything during the upgrade from 2.2 unstable to stable...
 GoldenEyeCF
on 22 Mar 2018
GoldenEyeCF
on 22 Mar 2018
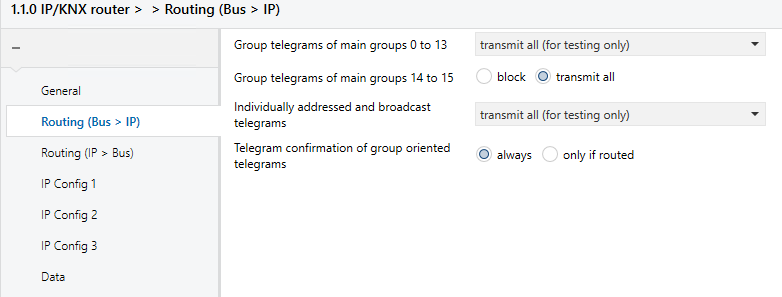
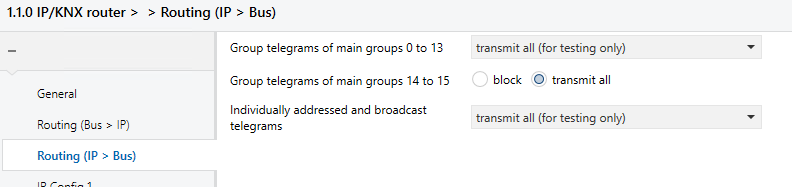
Maybe, this can be a Interface configuration problem.
Did not verify, but with standard configuration, some Interfaces block addresses above 13. So KNX2 cannot ask for device information from KNX bus.
 lewie
on 22 Mar 2018
lewie
on 22 Mar 2018
Hi,
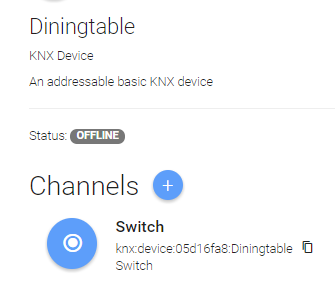
i have this problem; the things are showing as offline in paperui, even though the device is working and seems to answer.
Not sure if this might be a Hager KNX-RF issue, as all my end devices is KNX-RF devices.
This device is a TR210 Dimmer, connected to the bus by a TR131A mediacoupler and a TH210 router;
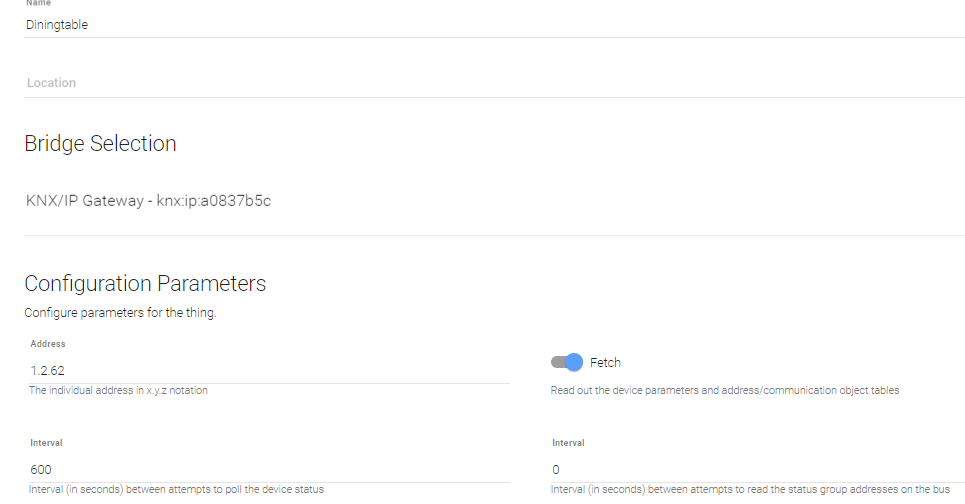
2018-03-15 12:42:05.907 [DEBUG] [.knx.handler.AbstractKNXThingHandler] - 'knx:device:05d16fa8' will be polled every 600s 2018-03-15 12:42:05.937 [TRACE] [nx.internal.client.AbstractKNXClient] - Sending a Group Read Request telegram for 0/0/56 2018-03-15 12:42:05.938 [DEBUG] [calimero.link.10.0.0.1:3671 ] - send (wait for confirmation) 0.0.0->0/0/56 L_Data.req, low priority hop count 6 repeat, tpdu 00 00 2018-03-15 12:42:05.939 [TRACE] [ip.KNXnet/IP Tunneling 10.0.0.1:3671] - sending cEMI frame seq 139, WaitForCon, attempt 1 (channel 75) 06 10 04 20 00 15 04 4b 8b 00 11 00 bc e0 00 00 00 38 01 00 00 2018-03-15 12:42:05.941 [TRACE] [ip.KNXnet/IP Tunneling 10.0.0.1:3671] - received service ack 139 from /10.0.0.1:3671 (channel 75) 2018-03-15 12:42:05.956 [DEBUG] [ip.KNXnet/IP Tunneling 10.0.0.1:3671] - received request seq 162 (channel 75) cEMI L-Data.con 1.1.254->0/0/56 2018-03-15 12:42:05.957 [DEBUG] [calimero.link.10.0.0.1:3671 ] - confirmation of 0/0/56 2018-03-15 12:42:05.957 [TRACE] [calimero.link.10.0.0.1:3671 ] - send 0.0.0->0/0/56 succeeded 2018-03-15 12:42:05.958 [TRACE] [limero.process.process 10.0.0.1:3671] - sent group read request to 0/0/56 2018-03-15 12:42:06.044 [TRACE] [ip.KNXnet/IP Tunneling 10.0.0.1:3671] - received request seq 163 (channel 75) cEMI 29 00 bc e0 12 3e 00 38 01 00 40 2018-03-15 12:42:06.045 [DEBUG] [calimero.link.10.0.0.1:3671 ] - indication 1.2.62->0/0/56 L_Data.ind, low priority hop count 6, tpdu 00 40 2018-03-15 12:42:06.045 [TRACE] [nx.internal.client.AbstractKNXClient] - Received a Group Read Response telegram from '1.2.62' to '0/0/56' 2018-03-15 12:42:06.045 [DEBUG] [.internal.handler.DeviceThingHandler] - Thing 'knx:device:05d16fa8' received a Group Write telegram from '1.2.62' for destination '0/0/56' 2018-03-15 12:42:06.046 [TRACE] [.internal.handler.DeviceThingHandler] - Thing 'knx:device:05d16fa8' processes a Group Write telegram for destination '0/0/56' for channel 'knx:device:05d16fa8:Diningtable' 2018-03-15 12:42:06.047 [TRACE] [g.knx.internal.dpt.KNXCoreTypeMapper] - toType datapoint DPT = 1.001 2018-03-15 12:42:06.909 [DEBUG] [.knx.handler.AbstractKNXThingHandler] - Polling individual address '1.2.62' 2018-03-15 12:42:06.910 [TRACE] [calimero.mgmt.TL 10.0.0.1:3671 ] - created co destination for 1.2.62 2018-03-15 12:42:06.910 [DEBUG] [calimero.link.10.0.0.1:3671 ] - send (wait for confirmation) 0.0.0->1.2.62 L_Data.req, system priority hop count 6 repeat, tpdu 80 2018-03-15 12:42:06.911 [TRACE] [ip.KNXnet/IP Tunneling 10.0.0.1:3671] - sending cEMI frame seq 140, WaitForCon, attempt 1 (channel 75) 06 10 04 20 00 14 04 4b 8c 00 11 00 b0 60 00 00 12 3e 00 80 2018-03-15 12:42:06.912 [TRACE] [ip.KNXnet/IP Tunneling 10.0.0.1:3671] - received service ack 140 from /10.0.0.1:3671 (channel 75) 2018-03-15 12:42:06.927 [DEBUG] [ip.KNXnet/IP Tunneling 10.0.0.1:3671] - received request seq 164 (channel 75) cEMI L-Data.con 1.1.254->1.2.62 2018-03-15 12:42:06.928 [DEBUG] [calimero.link.10.0.0.1:3671 ] - confirmation of 1.2.62 2018-03-15 12:42:06.929 [TRACE] [calimero.link.10.0.0.1:3671 ] - send 0.0.0->1.2.62 succeeded 2018-03-15 12:42:06.930 [TRACE] [calimero.mgmt.TL 10.0.0.1:3671 ] - connected with 1.2.62 2018-03-15 12:42:06.930 [TRACE] [calimero.mgmt.TL 10.0.0.1:3671 ] - sending data connected to 1.2.62, attempt 1 2018-03-15 12:42:06.931 [DEBUG] [calimero.link.10.0.0.1:3671 ] - send (wait for confirmation) 0.0.0->1.2.62 L_Data.req, low priority hop count 6 repeat, tpdu 43 00 2018-03-15 12:42:06.931 [TRACE] [ip.KNXnet/IP Tunneling 10.0.0.1:3671] - sending cEMI frame seq 141, WaitForCon, attempt 1 (channel 75) 06 10 04 20 00 15 04 4b 8d 00 11 00 bc 60 00 00 12 3e 01 43 00 2018-03-15 12:42:06.932 [TRACE] [ip.KNXnet/IP Tunneling 10.0.0.1:3671] - received service ack 141 from /10.0.0.1:3671 (channel 75) 2018-03-15 12:42:06.949 [DEBUG] [ip.KNXnet/IP Tunneling 10.0.0.1:3671] - received request seq 165 (channel 75) cEMI L-Data.con 1.1.254->1.2.62 2018-03-15 12:42:06.950 [DEBUG] [calimero.link.10.0.0.1:3671 ] - confirmation of 1.2.62 2018-03-15 12:42:06.950 [TRACE] [calimero.link.10.0.0.1:3671 ] - send 0.0.0->1.2.62 succeeded 2018-03-15 12:42:09.951 [TRACE] [calimero.mgmt.TL 10.0.0.1:3671 ] - sending data connected to 1.2.62, attempt 2 2018-03-15 12:42:09.952 [DEBUG] [calimero.link.10.0.0.1:3671 ] - send (wait for confirmation) 0.0.0->1.2.62 L_Data.req, low priority hop count 6 repeat, tpdu 43 00 2018-03-15 12:42:09.952 [TRACE] [ip.KNXnet/IP Tunneling 10.0.0.1:3671] - sending cEMI frame seq 142, WaitForCon, attempt 1 (channel 75) 06 10 04 20 00 15 04 4b 8e 00 11 00 bc 60 00 00 12 3e 01 43 00 2018-03-15 12:42:09.953 [TRACE] [ip.KNXnet/IP Tunneling 10.0.0.1:3671] - received service ack 142 from /10.0.0.1:3671 (channel 75) 2018-03-15 12:42:09.970 [DEBUG] [ip.KNXnet/IP Tunneling 10.0.0.1:3671] - received request seq 166 (channel 75) cEMI L-Data.con 1.1.254->1.2.62 2018-03-15 12:42:09.970 [DEBUG] [calimero.link.10.0.0.1:3671 ] - confirmation of 1.2.62 2018-03-15 12:42:09.971 [TRACE] [calimero.link.10.0.0.1:3671 ] - send 0.0.0->1.2.62 succeeded 2018-03-15 12:42:12.971 [TRACE] [calimero.mgmt.TL 10.0.0.1:3671 ] - sending data connected to 1.2.62, attempt 3 2018-03-15 12:42:12.972 [DEBUG] [calimero.link.10.0.0.1:3671 ] - send (wait for confirmation) 0.0.0->1.2.62 L_Data.req, low priority hop count 6 repeat, tpdu 43 00 2018-03-15 12:42:12.972 [TRACE] [ip.KNXnet/IP Tunneling 10.0.0.1:3671] - sending cEMI frame seq 143, WaitForCon, attempt 1 (channel 75) 06 10 04 20 00 15 04 4b 8f 00 11 00 bc 60 00 00 12 3e 01 43 00 2018-03-15 12:42:12.974 [TRACE] [ip.KNXnet/IP Tunneling 10.0.0.1:3671] - received service ack 143 from /10.0.0.1:3671 (channel 75) 2018-03-15 12:42:12.990 [DEBUG] [ip.KNXnet/IP Tunneling 10.0.0.1:3671] - received request seq 167 (channel 75) cEMI L-Data.con 1.1.254->1.2.62 2018-03-15 12:42:12.991 [DEBUG] [calimero.link.10.0.0.1:3671 ] - confirmation of 1.2.62 2018-03-15 12:42:12.991 [TRACE] [calimero.link.10.0.0.1:3671 ] - send 0.0.0->1.2.62 succeeded 2018-03-15 12:42:15.992 [TRACE] [calimero.mgmt.TL 10.0.0.1:3671 ] - sending data connected to 1.2.62, attempt 4 2018-03-15 12:42:15.993 [DEBUG] [calimero.link.10.0.0.1:3671 ] - send (wait for confirmation) 0.0.0->1.2.62 L_Data.req, low priority hop count 6 repeat, tpdu 43 00 2018-03-15 12:42:15.993 [TRACE] [ip.KNXnet/IP Tunneling 10.0.0.1:3671] - sending cEMI frame seq 144, WaitForCon, attempt 1 (channel 75) 06 10 04 20 00 15 04 4b 90 00 11 00 bc 60 00 00 12 3e 01 43 00 2018-03-15 12:42:15.994 [TRACE] [ip.KNXnet/IP Tunneling 10.0.0.1:3671] - received service ack 144 from /10.0.0.1:3671 (channel 75) 2018-03-15 12:42:16.011 [DEBUG] [ip.KNXnet/IP Tunneling 10.0.0.1:3671] - received request seq 168 (channel 75) cEMI L-Data.con 1.1.254->1.2.62 2018-03-15 12:42:16.012 [DEBUG] [calimero.link.10.0.0.1:3671 ] - confirmation of 1.2.62 2018-03-15 12:42:16.012 [TRACE] [calimero.link.10.0.0.1:3671 ] - send 0.0.0->1.2.62 succeeded 2018-03-15 12:42:19.013 [DEBUG] [calimero.link.10.0.0.1:3671 ] - send (wait for confirmation) 0.0.0->1.2.62 L_Data.req, system priority hop count 6 repeat, tpdu 81 2018-03-15 12:42:19.014 [TRACE] [ip.KNXnet/IP Tunneling 10.0.0.1:3671] - sending cEMI frame seq 145, WaitForCon, attempt 1 (channel 75) 06 10 04 20 00 14 04 4b 91 00 11 00 b0 60 00 00 12 3e 00 81 2018-03-15 12:42:19.015 [TRACE] [ip.KNXnet/IP Tunneling 10.0.0.1:3671] - received service ack 145 from /10.0.0.1:3671 (channel 75) 2018-03-15 12:42:19.030 [DEBUG] [ip.KNXnet/IP Tunneling 10.0.0.1:3671] - received request seq 169 (channel 75) cEMI L-Data.con 1.1.254->1.2.62 2018-03-15 12:42:19.030 [DEBUG] [calimero.link.10.0.0.1:3671 ] - confirmation of 1.2.62 2018-03-15 12:42:19.031 [TRACE] [calimero.link.10.0.0.1:3671 ] - send 0.0.0->1.2.62 succeeded 2018-03-15 12:42:19.031 [TRACE] [calimero.mgmt.TL 10.0.0.1:3671 ] - disconnected from 1.2.62>
I dont think its a router config issue (for me atleast) - as i allow the traffic;
Any thoughts?
 sikksakk
on 22 Mar 2018
sikksakk
on 22 Mar 2018
@sikksakk, You tested exactly what I meant.
With this configuration, the router is not the cause.
No, I have no thoughts at the moment.
lewie
on 23 Mar 2018
@sjka Simon, on a separate note but related to polling the KNX devices, and based on my own experience with the KNX Basic binding, I would opt to change the behaviour of the Handler slightly, in the sense that the polling or not polling of the device depends solely on the value of the pingInterval, and not the presence of the device address in the configuration of the Thing. For example, if pingInterval = 0 -> no polling. Having the address in the config, with no polling, is interesting to have for further enhancements of the binding. As you mentioned before a long time, either the whole bus is up, or the whole bus is down, so the polling mechanism is somewhat an auxiliary nice to have feature but nothing more....
 kgoderis
on 23 Mar 2018
kgoderis
on 23 Mar 2018
Yes, I vaguely remember that - I guess it was too tempting to leave it in, as it was working pretty nicely on those installations where it actually worked at all.
Nevertheless, with @lewie having no idea anymore and seeing @sikksakk's results, I share your conclusion! I will drop the ONLINE/OFFLINE polling and only keep the device property polling as an optional "nice-to-have" feature, which won't really hurt if it is not working.
sjka
on 23 Mar 2018
As a knx installation maybe has more than one line, it's easy to have situations where parts of the whole system are down, e.g. shorted external line, line coupler down, one power supply down...
I don't know how knx RF will fit, I don't own any of them, but also this part would be nice to be monitored.
 udo1toni
on 24 Mar 2018
udo1toni
on 24 Mar 2018
I have so many of these errors after switching to KNX2.
Reduced my config to minimum.
Each time I switch with OpenHAB the command is executed two times and a OpenHAB Error appears:


 maschenborn
on 25 Mar 2018
maschenborn
on 25 Mar 2018
@maschenborn This issue is about the device polling - please don't hijack it with other problems and open another issue for this!
sjka
on 26 Mar 2018
Related issues
 martinvw
·
5Comments
martinvw
·
5Comments
 d3rh3ld
·
4Comments
d3rh3ld
·
4Comments
 J-N-K
·
6Comments
J-N-K
·
6Comments
 mjcumming
·
5Comments
mjcumming
·
5Comments
 pfink
·
4Comments
pfink
·
4Comments
Most helpful comment
@sjka Simon, on a separate note but related to polling the KNX devices, and based on my own experience with the KNX Basic binding, I would opt to change the behaviour of the Handler slightly, in the sense that the polling or not polling of the device depends solely on the value of the pingInterval, and not the presence of the device address in the configuration of the Thing. For example, if pingInterval = 0 -> no polling. Having the address in the config, with no polling, is interesting to have for further enhancements of the binding. As you mentioned before a long time, either the whole bus is up, or the whole bus is down, so the polling mechanism is somewhat an auxiliary nice to have feature but nothing more....