Openbci_gui: Enhancement: New widget to display L and R spectrogram
Problem
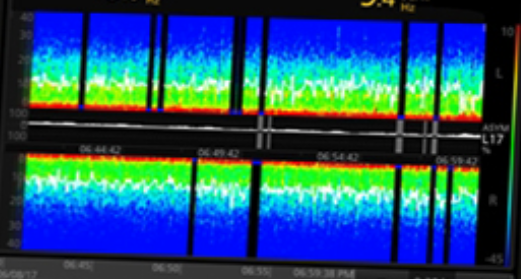
It would be great to have a widget that displays the spectrogram of left and right brain halves.
The spectra should be displayed such that easy comparison of L/R is possible
--> Display R and L on top of each other but inverted
The Masimo Sedline device has this
http://www.masimo.com/products/continuous/root/root-sedline/
Expected
Make a similar widget that displays last 30 minutes of the power spectrum like the Masimo does.
There could be also a display highlighting easily difference
Electrodes to be used for L and R should be selectable.
That is an interesting feature for anaesthesia pain assessment+ treatment, drugs/ medication abuse awareness etc.etc.
Operating System and Version
N/A
GUI Version
N/A
Running standalone app
N/A
Type of OpenBCI Board
N/A
Are you using a WiFi Shield?
N/A
 jps2000
All 31 comments
Its just a dual spectrogram known from Audio Analysis. They plot also a line showing a kind of center frequency.
jps2000
on 19 Dec 2018
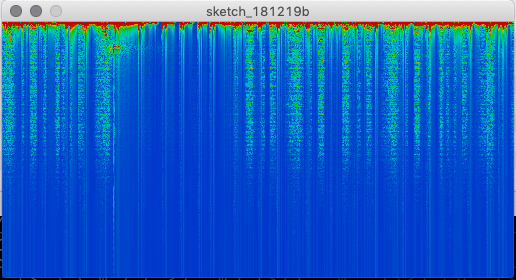
 retiutut
on 19 Dec 2018
retiutut
on 19 Dec 2018
Sounds good😁, just needs log color scale I think
I suggest that we first brainstorm how such a widget should look like.
Here some of my thoughts:
There are 3 kinds of data presentations
- Instant information ( like the FFT, band plot, EMG, focus etc,)
-->shows what is just now - short period information like time series, accelerometer etc
-->shows what happened the last 10 -20 seconds. It needs some"decoding" or interpretation effort by the user and provides correlation information ( like movement causes artifact) - long period information
-->shows what happened during the last 15 to 30 minutes
That is good for slower changes like drugs, sleep etc
The proposed spectrogram it something like that.
All these 3 fundamental display facilities should be available.
jps2000
on 19 Dec 2018
Continued..
This long period information or trend displays may show also
a) EMG ( Bandpass around 30Hz + rectifying) to see relaxation or tension
b) EOG ( Electrooculogram) Bandpass ( ~1Hz + rectifying).
c) others like traces for breathing pattern etc ( Aux channels)
So what we have then is a kind of polysomnograph ( see wiki)
The EOG events coming from REM for example are rather short events.
To analyze these in detail in a trend representation a kind of magnifyier would be great. So moving over the trend display expands the timespan to about 5 seconds.
Not easy to code however......
Such a function is also known in some scopes where have a main and a delayed timebase. The latter starting at a certain point much faster.
Probably this is easier to code because it is "just" combining trend and time series display.
Not easy to code however......
jps2000
on 21 Dec 2018
@retiutut
would be great to see some progress here.
I believe once this widget is available many will love it as real time trend monitor. Something like this is missing now in OpenBCI.
jps2000
on 21 Aug 2019
@jps2000 Will do!
retiutut
on 27 Aug 2019
@jps2000 Early prototype work:
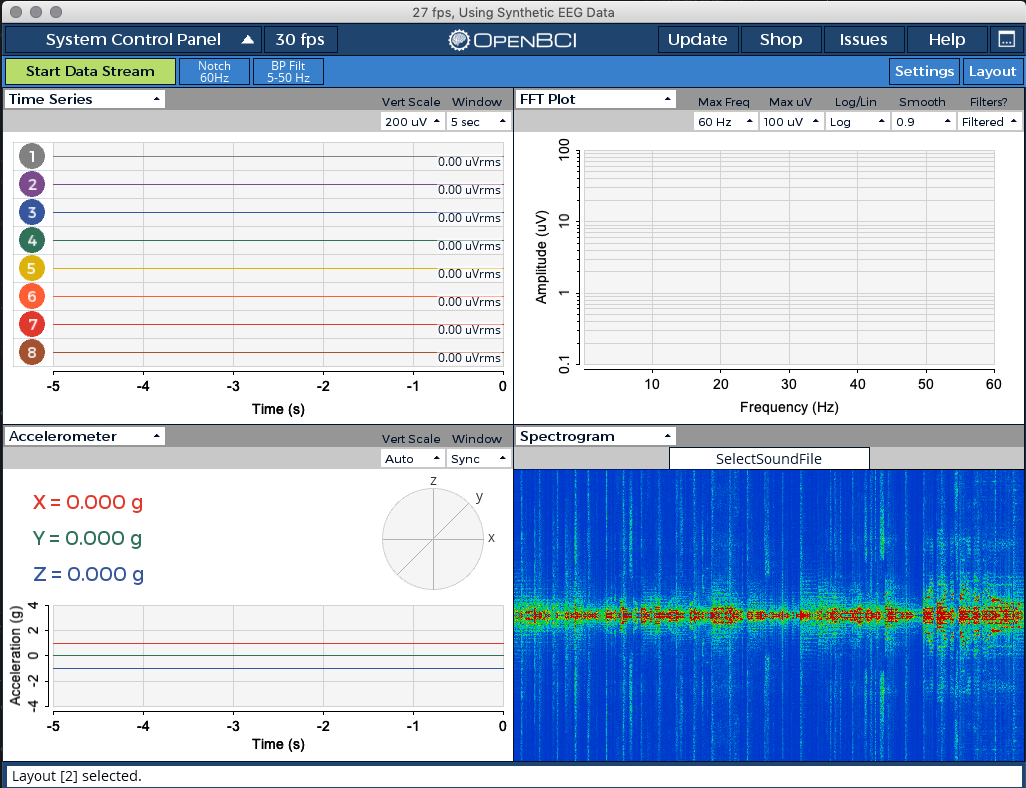
Got it to fit and resize within a widget. Just like before, still using FFT from an audio file to make coding the look of the Spectrogram more fun. Though to note, now using 2 FFTs, one for left channel and one for right channel. We should be able to do the same with EEG signals!
Still need to work through all of the details you have mentioned here.
Left = Top, Right = Bottom
retiutut
on 23 Sep 2019
To start off you could first dedicate channel 1 to L and channel 2 to R. Frequency scale 0-40Hz linear, L/R horizontally mirrored, Time scale 30 min length (last 30 min), showing actual time , Record button for screen shots. (jpg or tiff).
In case you want / need to do it different to Masimo you can plot it vertically ( vertical time axis , widget format portrait, Then the power spectrum is growing from the bottom like a hourglass.
This may look quite nice and it it obvious what is L and what R.
What do you think?
jps2000
on 23 Sep 2019
[x] To start off you could first dedicate channel 1 to L and channel 2 to R. (aka ChannelSelect for L and R)
[x] Add ChannelSelect feature to Spectrogram Widget
[x] Implement ChannelSelect as an average of the selected channels
[x] Frequency scale 0-40Hz linear,
_L/R horizontally mirrored (In case you want / need to do it different to Masimo you can plot it vertically ( vertical time axis , widget format portrait, Then the power spectrum is growing from the bottom like a hourglass.) (Orientation dropdown)_ This is now issue #660
[x] Time scale 30 min length (last 30 min),
[x] showing actual time ,
[x] Record button for screen shots. (jpg or tiff). (name using actual time)
retiutut
on 28 Sep 2019
Great
I see no need for log/ lin dropdown and frequency limit change at the moment--> skip
Channel select is more important. For example to have check boxes for channels ( odd ch numbers left, even numbers right. 1,3 left, 2,4 right. You need to sum the selected channels like you do in the FFT widget. Not more, otherwise you need to do it differently for ganglion and cyton.
jps2000
on 28 Sep 2019
Upgrading this to high priority! Planning to work on this soon so the first version of Spectrogram widget can be included with 4.1.7! I will continue to use this thread as a guide.
@jps2000 Thank you for your help thus far!
retiutut
on 22 Oct 2019
@jps2000 How many points per second do we need? An average FFT of each second?
60*30 = 1800 points/pixels-wide for 30 mins of data
retiutut
on 11 Nov 2019
Yes 1 second update is also what Masimo is doing
jps2000
on 11 Nov 2019
Notes for me for later:
Yes 1 second update is also what Masimo is doing
@daniellasry helped decouple the scrolling from the framerate 💯 , might even be better as a Java TimerTask (maybe).
60*30 = 1800 points/pixels-wide for 30 mins of data
This will delay the release of this widget to GUI 5.0, as we will need some type of simple Image Scaling algorithm. Very doable, but there are already discrepancies when the GUI is resized or you move the spectrogram widget to another container of a different size.
retiutut
on 13 Nov 2019
Image scaling is done!
retiutut
on 30 Nov 2019
retiutut
on 1 Dec 2019
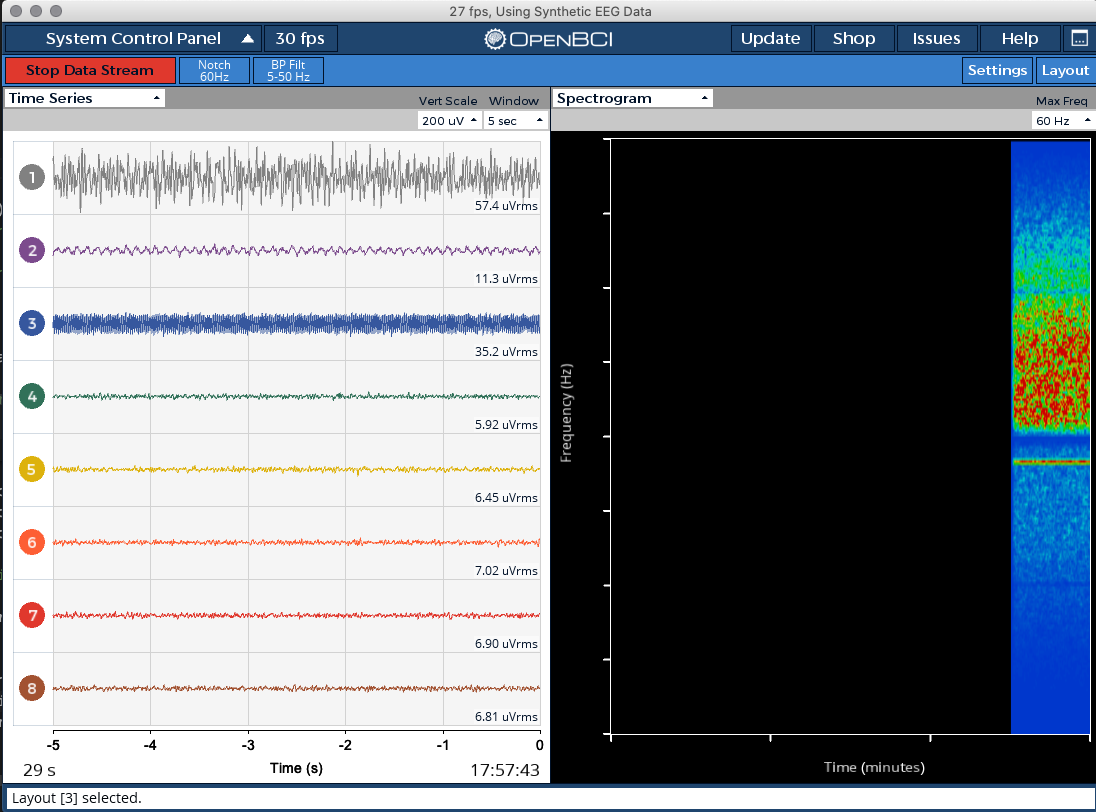
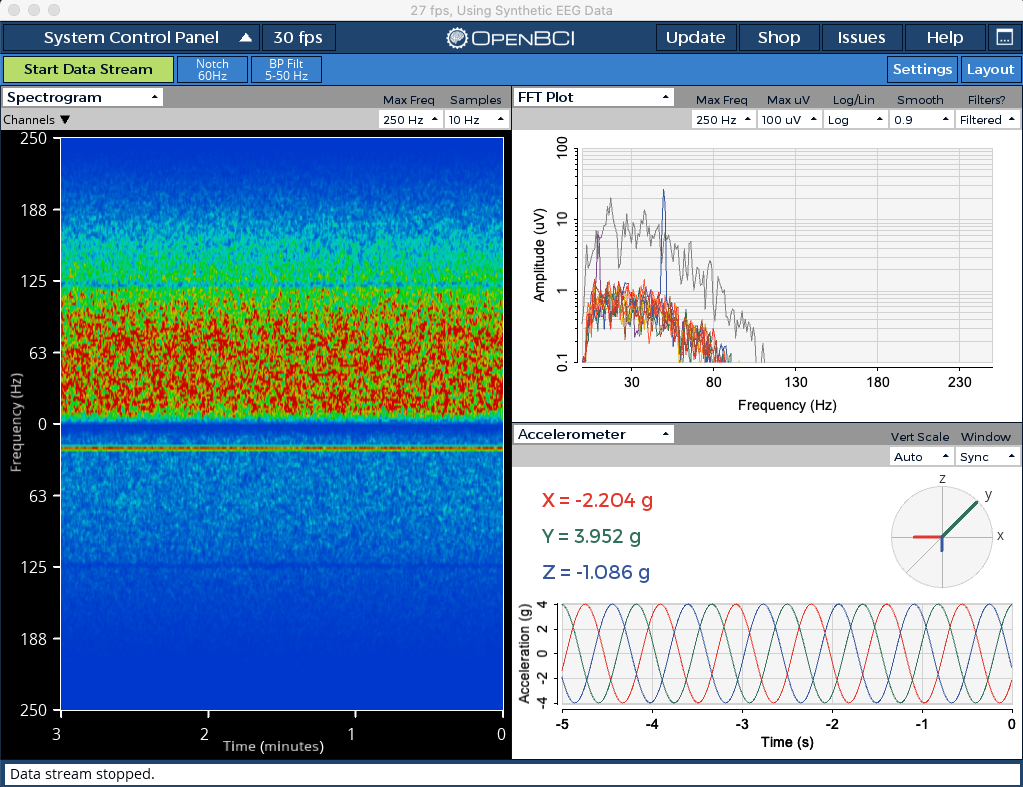
Still graphing linear scale, but most of the front-end and settings are done. I might change the number of ticks for 250Hz (only this option)Max Freq so that I don't have to round 187.5 and 62.5.
retiutut
on 1 Dec 2019
Hi @retiutut Congratulations for the huge progress.
Let me comment something - of course you may have noticed already some pending issues.
Frequency reading is probably not correct . You can easily check that by looking for a sharp line at 60Hz.( Mains interference, filter off.)
Then max frequency is too high. Should be 0-40 Hz. To prevent aliasing effects also use low pass filtering.
Max frequency select is probably not needed, The brain waves are always the same.
What may make sense is a kinda setting of the amplitude to color relation but this should be logarithmic as in the FFT
Try to make 2 separate boxes for L and R to have them clearly separated
Masimo indicate signal problems by a white bar. This could be done when the amplitudes is out of range. But lets discuss this later- step by step.
Is it "easily" possible to turn the graph vertically (by 90 degree)
Then it would be a kinda waterfall, it is clear what is left and what is right, It differs from Masimo and for the observer it is more easy to see differences between left and right ( in my opinion, may be others see this differently)
jps2000
on 1 Dec 2019
I will make the standard Max Freq 40 Hz, options for 250 will be available for testing and other unforeseen applications.
Try to make 2 separate boxes for L and R to have them clearly separated
- [x] I can draw a line right through the middle at 0Hz. This helps save on space and displays more data.
Is it "easily" possible to turn the graph vertically (by 90 degree) ✅
Rather than change how I am drawing pixels, I am simply going to do a rotate() on the image, and of course the axes will need to change. 😄
I will keep posting pictures as I continue to meet the requirements listed here. Drawing a vertical Log scale between the axis ticks is going to take more work, still using 1/1 pixel/Hz ratio in the data image.
retiutut
on 1 Dec 2019
Agree
Have a thick line @ 0 Hz
250Hz is too much ( Sample rate Nyquist Shannon Theorem) but 100Hz may be ok. Then you can easily check 50/ 60Hz signals coming :-)
You do not need a log scale in frequency
The transfer amplitude to color should be logarithmic thats all
Time axis should contain at least start time in HH:MM:SS or just this format every 10 minutes
( See masimo screen shot above)
Lets keep posting and commenting
jps2000
on 1 Dec 2019
Peter, hi.
I think it's great that Richard is adding the spectrogram capability to the GUI. Long long ago Chip Audette had a hacked version of the GUI that did this. And this new capability has many more features / advantages.
At the same time, if you are building some type of app that you will use in your clinical work, are you aware of some of the VPL Visual Programming Language development environments that allow complete customization of graphics output, recording, labeling, event recognition, advanced DSP operations, etc.?
The one that comes to mind for ease of use is National Instruments LabView IDE. Click the categories here to view the various DSP and graphing capabilities.
https://zone.ni.com/reference/en-XX/help/371361R-01/lvconcepts/labview_documentation_resources/
[I hope that is displaying in English vs German, somehow NI's stupid IP address tracking is forcing me into German pages.]
National Instruments LabView toolbox has extensive VPL Visual Programming Language capability for all kinds of DSP operations, graphing, etc. etc. And is already Cyton compatible. I know of one neurofeedback company, Zengar / NeurOptimal that has built a very sophisticated app using LabView as a base. This type of customization via VPL widgets and property panels, makes it easy.
For those with academic logins, LabView is essentially free.
https://openbci.com/forum/index.php?p=/discussion/274/labview-openbci-toolkit
Other VPLs are also available that allow easy customization via property boxes that control the operation of element blocks. These are all arranged graphically on the screen with lines indicating data stream flow. VPL's I'm aware of include LabView and: BioEra, OpenViBE, neuromore, NeuroPype, BrainBay, etc.
Regards,
William
 wjcroft
on 2 Dec 2019
wjcroft
on 2 Dec 2019
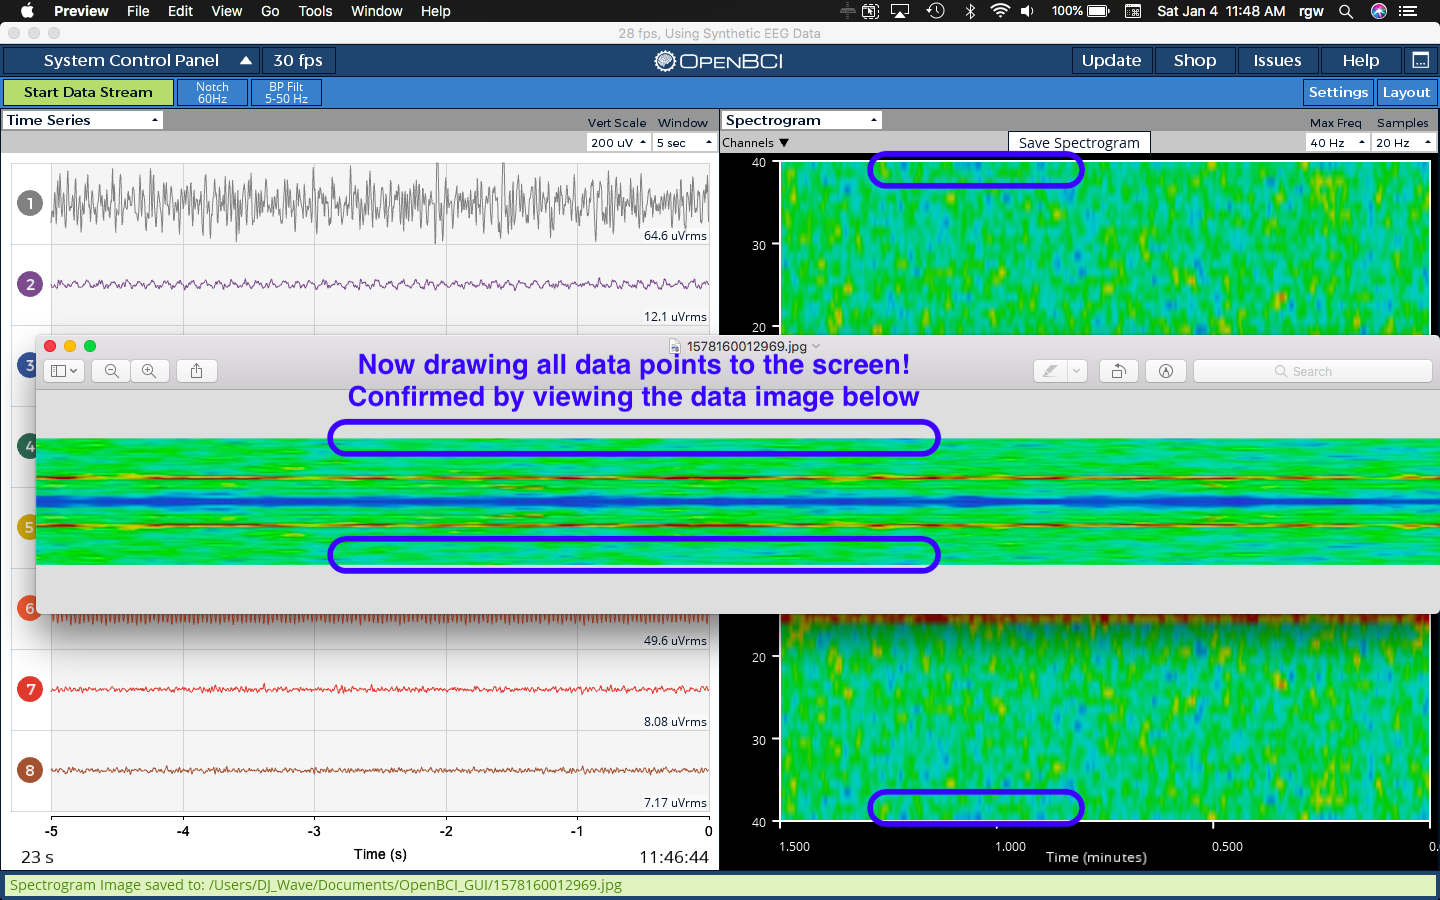
Still working on the graph axes, but at least all of the data is being drawn to screen and scaled.
retiutut
on 4 Jan 2020
- [x] Log color scale with reference displayed to the right of the graph
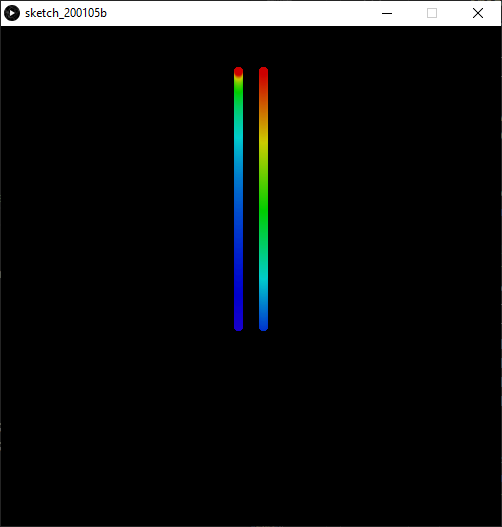
Going to draw a color scale to the right for reference. This is using log base 10 on the left, and linear on the right.
Here is the code for posterity:
float h = 0;
float x = 0;
float hueLimit = 160;
int paddingLeft = 50;
int paddingRight = 26;
int paddingTop = 8;
int paddingBottom = 50;

void setup(){
  size(500, 500);
  background(0);
  colorMode(HSB, 360, 360, 360);
}

void draw(){
  pushStyle();
            //draw color scale reference to the right of the spectrogram
            for (int i = 0; i < 256; i++) {
                float hueValue = hueLimit - map(i, 0, 256, 0, hueLimit);
                hueValue = map(log(hueValue) / log(10), 0, 2, 0, hueLimit);
                //println(hueValue);
                // colorMode is HSB, the range for hue is 256, for saturation is 100, brightness is 100.
                colorMode(HSB, 256, 100, 100);
                // color for stroke is specified as hue, saturation, brightness.
                stroke(int(hueValue), 100, 80);
                strokeWeight(8);
                point(width / 2 - paddingRight/2, height / 2 + paddingBottom - i);
            }

            //draw color scale reference to the right of the spectrogram
            for (int i = 0; i < 256; i++) {
                float hueValue = hueLimit - map(i, 0, 256, 0, hueLimit);
                //hueValue = map(log(hueValue) / log(10), 0, 2, 0, hueLimit);
                //println(hueValue);
                // colorMode is HSB, the range for hue is 256, for saturation is 100, brightness is 100.
                colorMode(HSB, 256, 100, 100);
                // color for stroke is specified as hue, saturation, brightness.
                stroke(int(hueValue), 100, 80);
                strokeWeight(8);
                point(width / 2 - paddingRight/2 + 25, height / 2 + paddingBottom - i);
            }
      popStyle();
}

Still need to work on the horizontal axis, but log color scale is integrated with settings!
retiutut
on 6 Jan 2020
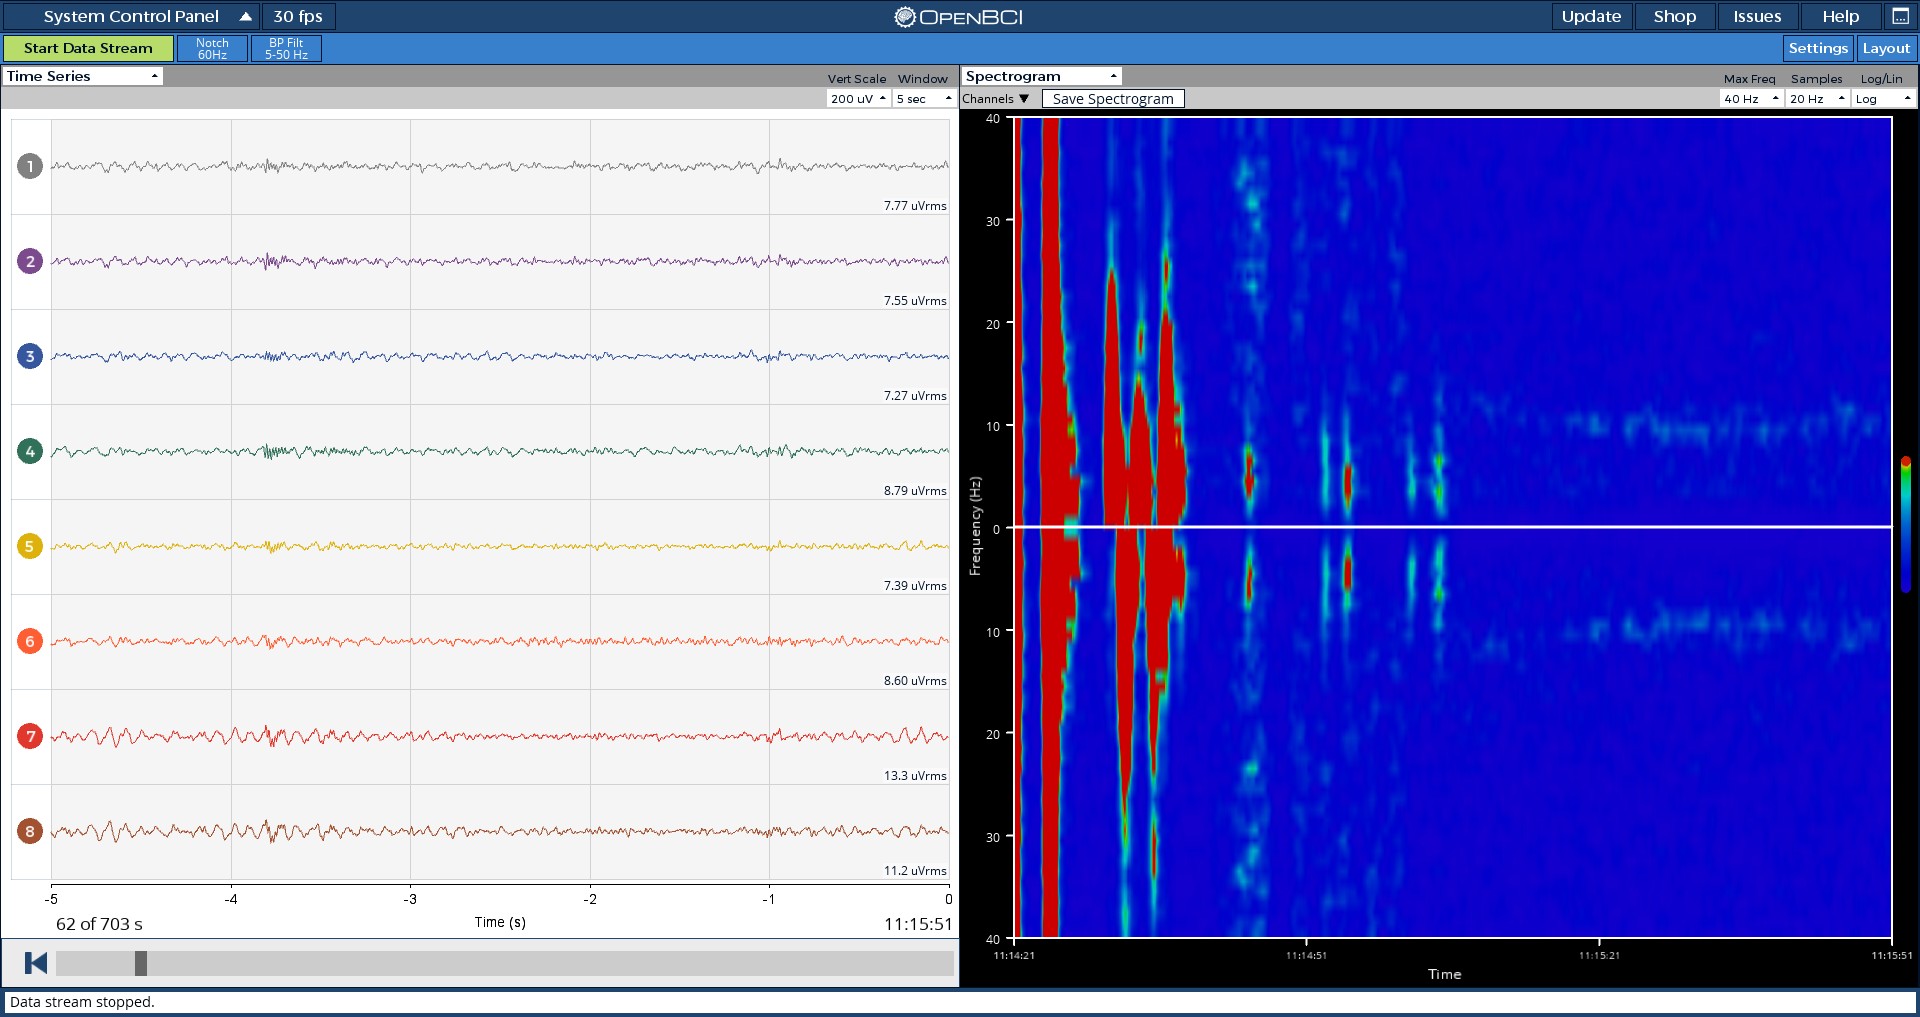
Using sample meditation data file and playback mode with timestamps.
retiutut
on 6 Jan 2020
Spectrogram widget is here! There may be bugs that haven't been uncovered, so I'll be releasing this under GUI v5.0.0-alpha. Release coming now!
retiutut
on 6 Jan 2020
Great! I know it was a huge effort that you had to manage. You did it!
Will try new widget soon with function generator to see if it works as expected
is it displaying now channel 1 upper and and channel 2 lower?
jps2000
on 6 Jan 2020
is it displaying now channel 1 upper and and channel 2 lower?
It's fully customizable and the GUI should remember all settings for the widget.
retiutut
on 6 Jan 2020
I think I need to add time to the timestamps instead of subtract.
retiutut
on 6 Jan 2020
Fixed!
retiutut
on 6 Jan 2020
retiutut
on 6 Jan 2020
Related issues
 cfausn
·
3Comments
jps2000
·
5Comments
jps2000
·
6Comments
jps2000
·
6Comments
jps2000
·
3Comments
cfausn
·
3Comments
jps2000
·
5Comments
jps2000
·
6Comments
jps2000
·
6Comments
jps2000
·
3Comments
Most helpful comment
Peter, hi.
I think it's great that Richard is adding the spectrogram capability to the GUI. Long long ago Chip Audette had a hacked version of the GUI that did this. And this new capability has many more features / advantages.
At the same time, if you are building some type of app that you will use in your clinical work, are you aware of some of the VPL Visual Programming Language development environments that allow complete customization of graphics output, recording, labeling, event recognition, advanced DSP operations, etc.?
The one that comes to mind for ease of use is National Instruments LabView IDE. Click the categories here to view the various DSP and graphing capabilities.
https://zone.ni.com/reference/en-XX/help/371361R-01/lvconcepts/labview_documentation_resources/
[I hope that is displaying in English vs German, somehow NI's stupid IP address tracking is forcing me into German pages.]
National Instruments LabView toolbox has extensive VPL Visual Programming Language capability for all kinds of DSP operations, graphing, etc. etc. And is already Cyton compatible. I know of one neurofeedback company, Zengar / NeurOptimal that has built a very sophisticated app using LabView as a base. This type of customization via VPL widgets and property panels, makes it easy.
For those with academic logins, LabView is essentially free.
https://openbci.com/forum/index.php?p=/discussion/274/labview-openbci-toolkit
Other VPLs are also available that allow easy customization via property boxes that control the operation of element blocks. These are all arranged graphically on the screen with lines indicating data stream flow. VPL's I'm aware of include LabView and: BioEra, OpenViBE, neuromore, NeuroPype, BrainBay, etc.
Regards,
William