Omnisharp-vscode: Omnisharp CPU performance issues
Environment data
Runtime Environment:
OS Name: Windows
OS Version: 10.0.17134
OS Platform: Windows
RID: win10-x64
Base Path: C:\Program Files\dotnet\sdk\2.2.103\
VS Code version: 1.34.0
C# Extension version: 1.19.1
Steps to reproduce
- Open Unity project in Visual Studio Code
- Start typing in any C# file inside the project
- Check your CPU blow up
_The project has approximately 2200 c# files._
Expected behavior
No crazy CPU load while coding and normal intellisense response times.
Actual behavior
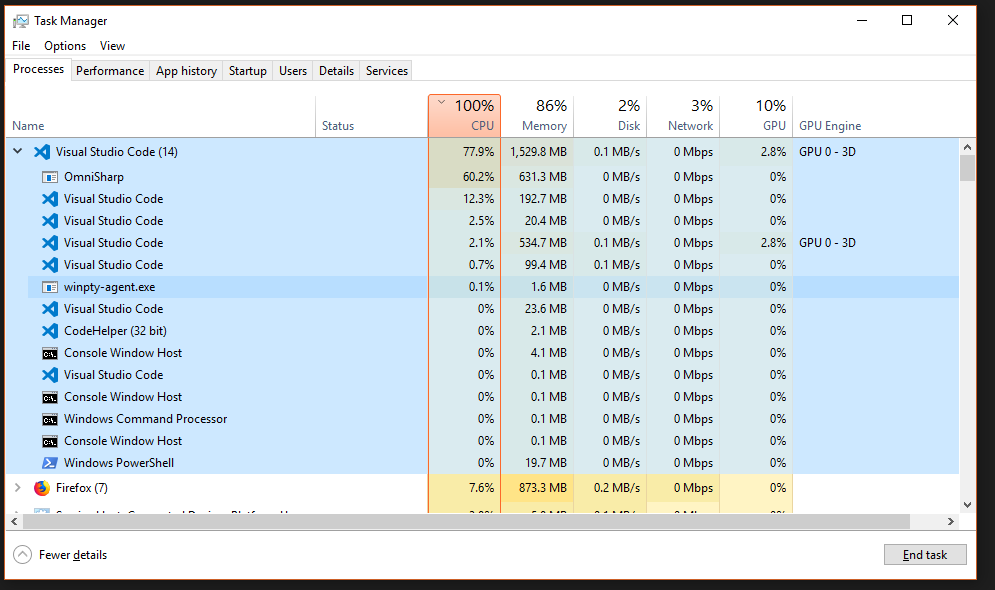
The intellisense response takes approximately 3 seconds when typing code. The CPU load of omnisharp component in VS code comes while typing.
When I'm not typing anything in any C# file, there's no crazy load on CPU and it all looks fine.
 KristianBalaj
All 20 comments
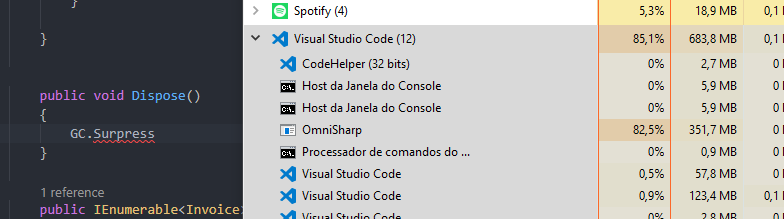
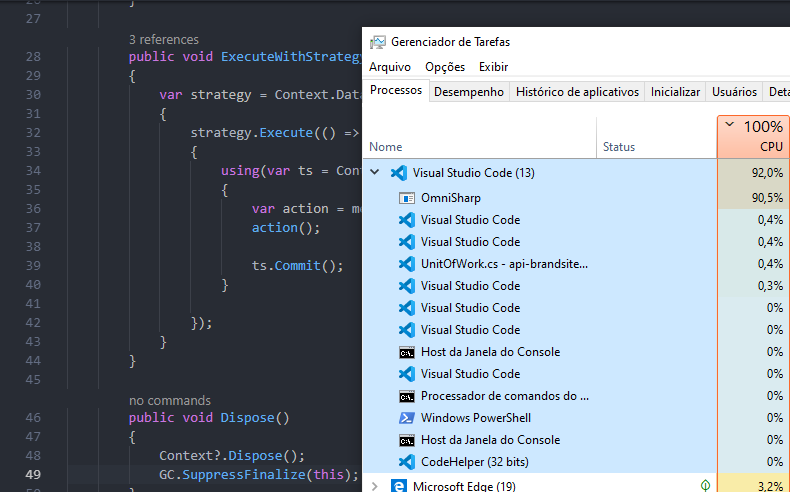
I'm getting the same problem whenever I implement IDisposable.
 martielo
on 21 May 2019
martielo
on 21 May 2019
OS: Ubuntu 16.04
VS Code version: 1.35.1
C# Extension version: 1.20.0
I had the issue in unit test project. Is is gone after I removed all IDisposable implementations.
 mic-hnk
on 15 Jul 2019
mic-hnk
on 15 Jul 2019
@KristianBalaj @mic-hnk Can you see if this goes away if you set the option "csharp.referencesCodeLens.enabled": false ? I think what's happening is that the references code lens provider is consuming a lot of cpu searching for IDisposable implementors.
 rchande
on 15 Jul 2019
rchande
on 15 Jul 2019
@rchande I think it helped. After changing the recommended setting and opening a project with IDisposable implementations I cannot observe high cpu usage anymore. I am not sure though if this is a perfect solution to disable the given code lens ;)
mic-hnk
on 16 Jul 2019
@rchande yeah disabling code lens helps. I've tested both enabled/disabled states, compared it and the disabled state is exactly how it should work.
On the other hand, I don't think it's a problem just with IDisposable implementations. I've tested this issue on a smaller project (approximately 200 code files divided into smaller assemblies) where I have IDisposable implemented and there is no such problem with the CPU load (either code lens enabled or disabled). So I think the main factor could be the project size.
Otherwise, like @mic-hnk said that's not the best solution to disable code lens. ;)
KristianBalaj
on 16 Jul 2019
I think project size is not a problem. I faced this issue in xunit test project with 10 files. I even removed all but one code files and cpu usage remained high.
mic-hnk
on 16 Jul 2019
Maybe you forgot about xunit assemblies included in the project. There are many types, too.
KristianBalaj
on 16 Jul 2019
As another data point, we just added some unit tests that implement the IDisposable in the large code base I work in and omnisharp started to consume crazy amounts of CPU.
My dev environment is on linux so looks like the issue is cross-platform too 😬
 majames
on 18 Jul 2019
majames
on 18 Jul 2019
Several people on my team experience a similar behavior. Specially in some xunit test classes the CPU consumption just goes up to 80-100% through all 8 cores whenever you start editing them and trigger intellisense.
We were since long time trying to isolate one use case where the problem always happens and the hint with IDisposable is a very good one 😃, the classes where we mostly get the problem are actually implementing it.
I just did the test of changing one of these classes to not implement IDisposable and the problem seems to have disappeared. Whenever I introduce it again, the CPU goes back to 100%.
 mvalero
on 19 Jul 2019
mvalero
on 19 Jul 2019
Can confirm that implementing IDisposable was the trigger of (very frustrating) performance issues for me as well. Thank you for pointing this out!
 Marchyello
on 2 Aug 2019
Marchyello
on 2 Aug 2019
Well, after some months I'm still facing this problem. I think we all agree that disabling code lens is not a good solution.
In order to work with a class that implements IDisposable, I need to comment it for a while and then, when I finish coding, I uncomment it.
martielo
on 11 Sep 2019
I may have duplicated this issue in #3336
 turowicz
on 10 Oct 2019
turowicz
on 10 Oct 2019
I've been experiencing random high CPU load from the mono process, but I hadn't pinned down any cause. Disabling CodeLens fixed it, and after I looked deeper, I had an xunit test that implemented IDisposable.
 nbarbettini
on 18 Oct 2019
nbarbettini
on 18 Oct 2019
I had the same issue. I was editing a new stream implementation and every character typed sent it to 100%. On arch linux. Can confirm disabling references codelens fixed the issue for me
 LiamMorrow
on 7 Feb 2020
LiamMorrow
on 7 Feb 2020
I've tried profiling this problem in the past, but I just found out the issue is in the roslyn rather than in omnisharp. The only thing o# can do at this moment is to specifically turn off code lens for Dispose() methods, same way as ToString() works currently.
o# issue tracking this: https://github.com/OmniSharp/omnisharp-roslyn/issues/367
 SirIntruder
on 9 Feb 2020
SirIntruder
on 9 Feb 2020
I recognized the same behavior. Everything is fluent and happy until the moment i add the IDisposable interface to a class. Suddenly the fans start spinning and CPU usage goes through the roof.
Version: 1.43.0-insider
Commit: 9c341b3d8f2f41277be6dd59e7f4e847e6b594ac
Date: 2020-02-20T05:39:45.923Z
Electron: 7.1.11
Chrome: 78.0.3904.130
Node.js: 12.8.1
V8: 7.8.279.23-electron.0
OS: Linux x64 4.15.0-88-generic
Starting OmniSharp server at 6.3.2020
 ghandmann
on 6 Mar 2020
ghandmann
on 6 Mar 2020
I'm having the same issue. Omnisharp takes 3 - 10 seconds to show suggestions when working in a XUnit class that implements IDisposable. Some times it will show it's loading, then just do nothing and seems to just give up loading that suggestion until I try again with Ctrl + ..
I'm running the following:
Linux Mint: 19.1
C# Extension: 1.21.13
dotnet sdk: 2.2.402
And my VSCode versions:
Version: 1.41.0
Commit: 9579eda04fdb3a9bba2750f15193e5fafe16b959
Date: 2019-12-11T18:32:17.711Z
Electron: 6.1.5
Chrome: 76.0.3809.146
Node.js: 12.4.0
V8: 7.6.303.31-electron.0
OS: Linux x64 4.15.0-54-generic
 ianmann56
on 10 Mar 2020
ianmann56
on 10 Mar 2020
I can't even use the extension now.. It's just horrible. Just keeps saying 'Saving... Getting code actions from "C#', 'C# Extensions'".
 Fosol
on 31 Mar 2020
Fosol
on 31 Mar 2020
I am having the same issue. Seems like it take a lot of time to resolve...
 stann1
on 1 May 2020
stann1
on 1 May 2020
Should be fixed with https://github.com/OmniSharp/omnisharp-vscode/pull/3780. We will no longer add a references codelens to the Dispose method. This is related to https://github.com/dotnet/roslyn/issues/38223
 JoeRobich
on 14 May 2020
JoeRobich
on 14 May 2020
Related issues
 Alumniminium
·
3Comments
Alumniminium
·
3Comments
 jrmcdona
·
3Comments
jrmcdona
·
3Comments
 kiminuo
·
3Comments
kiminuo
·
3Comments
 yufeih
·
3Comments
yufeih
·
3Comments
 mentoreet
·
3Comments
mentoreet
·
3Comments
Most helpful comment
@KristianBalaj @mic-hnk Can you see if this goes away if you set the option
"csharp.referencesCodeLens.enabled": false? I think what's happening is that the references code lens provider is consuming a lot of cpu searching for IDisposable implementors.