Omnisharp-vscode: Remote Debugging on Linux ARM not Available
Environment data
Developer machine:
PS D:\somehwere\> dotnet --info
.NET Command Line Tools (2.0.0-preview1-005977)
Product Information:
 Version:            2.0.0-preview1-005977
 Commit SHA-1 hash:  414cab8a0b
Runtime Environment:
 OS Name:     Windows
 OS Version:  10.0.10240
 OS Platform: Windows
 RID:         win10-x64
 Base Path:   C:\Program Files\dotnet\sdk\2.0.0-preview1-005977\
Microsoft .NET Core Shared Framework Host
  Version  : 2.0.0-preview1-002111-00
  Build    : 1ff021936263d492539399688f46fd3827169983
Target machine is an embedded ARM Cortex-A7 - but it will fail on any non-x64 architecture.
    root@colibri-imx7:~# dotnet --info
    Microsoft .NET Core Shared Framework Host
    Version  : 2.0.0-preview2-25407-01
    Build    : 40c565230930ead58a50719c0ec799df77bddee9
    root@colibri-imx7:~# uname -a
    Linux colibri-imx7 4.1.39-2.7.2+gba2f75f #1 SMP Thu Jun 8 14:05:02 CEST 2017 armv7l GNU/Linux
VS Code version: 1.13.0
C# Extension version: 1.10.0
Steps to reproduce
Follow the remote debugging guide: https://github.com/OmniSharp/omnisharp-vscode/wiki/Attaching-to-remote-processes
The critical step is the VSDBG installation on the server.
curl -sSL https://aka.ms/getvsdbgsh | bash /dev/stdin -v latest -l ~/vsdbg
Expected behavior
An ARM debugger is installed.
Actual behavior
The script fails to determine the RID.
It seems only x64 RIDs are supported, I tried to supply several RIDs manually, but the download only works for very few x64 RIDs. My application is successfully targeting -r linux-arm.
See https://github.com/dotnet/corefx/blob/master/pkg/Microsoft.NETCore.Platforms/runtime.json for a list of RIDs.
I see that this is the same debugger that Visual Studio 2017 uses and not part of the OmniSharp project. Who is responsible for those mysterious debuggers and why are they built for x64 only? Is it part of an open source project (hope) or closed source (hopeless). Any directions are welcome. Remote debugging is essential for ARM devices!
 nzain
nzain
All 115 comments
@nzain just to confirm - this is currently expected. We do not yet support ARM.
 gregg-miskelly
on 12 Jun 2017
gregg-miskelly
on 12 Jun 2017
@nzain BTW: Does the .NET Team have official ARM packages yet? Last I head they did not.
gregg-miskelly
on 12 Jun 2017
@gregg-miskelly ARM is well supported in the upcoming 2.0 release, see https://github.com/dotnet/core-setup. The linux releases are less distro-specific and there is a generic "linux-arm" package on the Release/2.0.X track, which I'm using right now. There are quite some raspberry PI tutorials based on .net core 1.x and even tizen (armel, not armhf) is getting support in 2.0.
I agree that I'm too early for "official" support, but I'm ok with compiling the debugger offroad. Since I'm compiling the whole linux for my device, this is just another step during my "asp.net core on ARM" journey :)
Are there any plans for arm debugging support? Alternatives? It is quite easy to simulate / mock regular webserver stuff, e.g. connecting to some in-memory database instead of real servers. However, it is difficult to properly mock real hardware sensors (e.g. a 3D laser scanner) connected via low level hardware (UARTs and the like). Debugging support would improve productivity enourmously.
Suggestions welcome!
nzain
on 12 Jun 2017
@nzain producing a build of the debugger for ARM is something on a radar, but it isn't something that we have started on yet, or figured out exactly when we will deliver. From my understanding, the .NET Core debugger team hasn't started looking at their APIs on Linux ARM, so I am not sure if it is even possible to make a managed debugger yet. Regardless, vsdbg, the debugger that this extension uses, is a proprietary product, so it isn't something that you will be able to build. So unfortunately there isn't much you can do at this point.
gregg-miskelly
on 13 Jun 2017
Thanks for clarification!
nzain
on 13 Jun 2017
@nzain I will leave your issue open as this is something we plan to address. I just am not sure the exact timeline yet (other than it will not be super soon).
gregg-miskelly
on 13 Jun 2017
Great to hear, definitely looking forward to this!
Am 13.06.2017 6:50 nachm. schrieb "Gregg Miskelly" <[email protected]
:
Reopened #1562 https://github.com/OmniSharp/omnisharp-vscode/issues/1562
.—
You are receiving this because you were mentioned.
Reply to this email directly, view it on GitHub
https://github.com/OmniSharp/omnisharp-vscode/issues/1562#event-1121767690,
or mute the thread
https://github.com/notifications/unsubscribe-auth/ANUK-6gnmXUIff_WmJDEd_EXRuc8LkVCks5sDr3PgaJpZM4N3DMm
.
nzain
on 13 Jun 2017
Hello! We are starting a project where we want to port our existing framework to .NET Standard and use .NET Core on a linux based ARMHF architecture. We would definitely vote this up, since it is of fundamental interest for us to be able to debug on the device. Is there any descision made on this topic yet?
 JP-CZ
on 31 Aug 2017
JP-CZ
on 31 Aug 2017
Our tentative plan is to start work on this sometime in the next month, but there are too many unknowns to at all guess when the work will be done.
gregg-miskelly
on 31 Aug 2017
Hi! Any updates on this? Remote debugging is a must have for embedded devices (we are also using an ARM processor). Is there any way the community (me :)) can help with this?
 tamaskaroly
on 16 Nov 2017
tamaskaroly
on 16 Nov 2017
We are getting quite close to releasing an "alpha" version.
A few notes:
- Debugging support in .NET Core 2.0 is very busted. So, trying this will require running the target app under one of the daily builds of .NET Core 2.1.
- If anyone subscribed to this thread has any feedback on what OS distro/version they would like to use that may be helpful. Thus far we have been using Raspbian 9.
gregg-miskelly
on 17 Nov 2017
I should add: we will post information here about how to set things up once we have this alpha version available.
gregg-miskelly
on 17 Nov 2017
👍 for incomming debugger support
I am using Ubuntu Server 17.10 on raspberry pi 2
 Suchiman
on 17 Nov 2017
Suchiman
on 17 Nov 2017
Exciting and an important step for "dotnet everywhere". Regarding the
distribution, you will see Raspian when people "try things out" and
Selfmade Linux (buildroot or yocto are popular) for many real world
applications. We use buildroot, because it is simple, you can customize
every bit, easily add your own apps and end up with 40MB Linux without
dotnet. Great, when you ship updates for your firmware! Third party updates
never destroy your product.
Am 17.11.2017 03:08 schrieb "Gregg Miskelly" notifications@github.com:
I should add: we will post information here about how to set things up
once we have this alpha version available.—
You are receiving this because you were mentioned.
Reply to this email directly, view it on GitHub
https://github.com/OmniSharp/omnisharp-vscode/issues/1562#issuecomment-345123947,
or mute the thread
https://github.com/notifications/unsubscribe-auth/ANUK-xwGDaHCUk5v4RNcWGX6AroowMXBks5s3OqZgaJpZM4N3DMm
.
nzain
on 17 Nov 2017
I am using raspbian 9 on raspberry pi 3
thank's for this improvement!
 fabien-chevalley
on 17 Nov 2017
fabien-chevalley
on 17 Nov 2017
We are using a custom distro created with Yocto.
Gregg, you mentioned version 2.1, but I haven't seen any announcement regarding what the planned features are. Do you have any info on that? (Do you know if ARM64 is even talked about?)
Thanks for the great work!
tamaskaroly
on 17 Nov 2017
The only info I have on 2.1 -
- It makes ARM debugging work :)
- So far at least, official arm64 work is not part of the plan
- Here is the roadmap: https://github.com/dotnet/core/blob/master/roadmap.
@petermarcu may be able to comment further on any possible timeline for official arm64 support, or if there is an issue tracking it somewhere
gregg-miskelly
on 17 Nov 2017
I don't know of any concrete plans for linux arm64 in .NET Core 2.1. That said I know that there are runtime builds of linux arm64 here is an example
Its probably something that the community could help bring up if someone is interested.
 Petermarcu
on 17 Nov 2017
Petermarcu
on 17 Nov 2017
The link to the roadmap page is broken.
tamaskaroly
on 17 Nov 2017
When I wrote about self-built custom linux, I wondered what the debugger guys should do with that information. Key for self-builders are documented dependencies, ideally nothing too fancy. Yocto and Buildroot both have a large repository of dependencies that can be enabled (built into the resulting OS).
- Easy: a list of stable-branch dependencies commonly available (download & build latest)
- Ok: beta dependencies (in yocto/buildroot you target certain commits for each dependency)
- Bad: dependencies that are not generally available for a wide range of platforms. Chances are, that someone made it work for debian-arm32 or raspbian, but not for anything else. Yocto and Buildroot should be able to build all dependencies.
I wonder, what dependencies are required to get this debugger project going - not the easiest task, I guess.
nzain
on 20 Nov 2017
For our project on a Dragonboard with Debian Linux it would be very helpful to have a remote debugger. Definitely vote up for this.
 Czlw
on 20 Nov 2017
Czlw
on 20 Nov 2017
We haven't yet tried any distro aside from Raspbian, but we have our first beta release up. Instructions for anyone who wants to try it: https://github.com/OmniSharp/omnisharp-vscode/wiki/Remote-Debugging-On-Linux-Arm
gregg-miskelly
on 1 Dec 2017
So vsdbg for RPI3 is available now, right?
This is the news I have waited for such a long long time! Previously I tried to write a manual to do it in Korean and I realized that that is not possible because of absence of vsdbg for RPI. Also the setup seems like almost same as the setup process for x86 systems' remote debugging so that I can finish the manual soon!
Thanks for you guys' hard working on it. Very appreciate it.
PS. which means I can make a DLL from the BCM2835 library to control RPI's GPIO and play with the vsdbg! great!
 bus710
on 1 Dec 2017
bus710
on 1 Dec 2017
Yes, this should work on Pi3s (its one of our test systems in fact).
gregg-miskelly
on 1 Dec 2017
I've managed to get debugging running from VS using these instructions on ubuntu 17.10 on the raspberry pi 2 😄 👍 🙌 💯 🥇.
My first attempts using vs code failed because the process terminated with StackoverflowException after printing Loaded '/home/ubuntu/test/System.Private.CoreLib.dll'. Skipped loading symbols. Module is optimized and the debugger option 'Just My Code' is enabled. but updating to a newer runtime and deploying in Debug (instead of Release) configuration made it work!
Suchiman
on 1 Dec 2017
@Suchiman I'm glad you have it working! Do you know what version of the runtime you were initially using? The StackoverflowException coming from the app is what we saw when running netcoreapp2.0 on coreclr 2.0, which is why we are saying only netcoreapp2.1/coreclr 2.1 are supported.
 chuckries
on 1 Dec 2017
chuckries
on 1 Dec 2017
@chuckries the StackoverflowException was happening with 2.1.0-preview1-25929-02 which is the version used by default by the 2.2.0-preview1-007622 SDK from a few days ago so then i upgraded to the very latest from myget
<RuntimeFrameworkVersion>2.1.0-preview1-25930-03</RuntimeFrameworkVersion>
<NETStandardImplicitPackageVersion>2.1.0-preview1-25930-03</NETStandardImplicitPackageVersion>
which made it work (all using Self Contained Deployment)
Suchiman
on 1 Dec 2017
Am I mistaken, or is this debugger only useful if you're using Visual Studio Code, and not the standard Visual Studio IDE on Windows? I don't see how the launch.json system works in Visual Studio.
 RoySalisbury
on 10 Dec 2017
RoySalisbury
on 10 Dec 2017
@RoySalisbury as i've explained, when you follow those instructions, you can get it to work in VS.
Instead of the Machine setup - Linux Computer steps, use these steps.
But this is "offroad" debugging, so it's a little cumbersome. For reference, here's how my launch.json for VS looks like (same name as VS Code but different structure for VS):
{
  "version": "0.2.0",
  "adapter": "C:\\tools\\plink.exe",
  "adapterArgs": "-i C:\\tools\\piberryCert.ppk ubuntu@piberry -batch -T ~/vsdbg/vsdbg --interpreter=vscode",
  "languageMappings": {
    "C#": {
      "languageId": "3F5162F8-07C6-11D3-9053-00C04FA302A1",
      "extensions": [ "*" ]
    }
  },
  "exceptionCategoryMappings": {
    "CLR": "449EC4CC-30D2-4032-9256-EE18EB41B62B",
    "MDA": "6ECE07A9-0EDE-45C4-8296-818D8FC401D4"
  },
  "configurations": [
    {
      "name": ".NET Core Launch",
      "type": "coreclr",
      "cwd": "~/ConsoleApp1",
      "program": "ConsoleApp1",
      "request": "launch"
    }
  ]
}
@Suchiman
Thanks. I also noticed that I can start vsdbg with the '--interperpreter=mi' param. Then use the Visual Studio debugger attach using SSH (built in). I'm going to try that as well.
Roy
RoySalisbury
on 10 Dec 2017
@RoySalisbury yeah if you've installed vsdbg in the default location, you can attach over ssh without starting vsdbg manually IIRC. With the launch.json you can start debugging on the remote machine. Now it just needs auto deployment 😃. Interesting thing with the --interpreter mi vs. vscode, any recommendation from debugger folks which one is better for VS?
Suchiman
on 10 Dec 2017
Initially I was unable to ge thte Visual Studio debugger to attach by selecting the process. However, I figured out what was going on.
Basically, Visual Studio runs the following command on the remote:
GetVsDbg.sh -v vs2017u5 -l "/home/pi/.vs-debugger/vs2017u5" -d vscode
So, we know two things right off. It uses the 'vscode' command set and not the 'mi' one. And second, it wants the debugger installed in '/home/pi/.vs-debugger/vs2017u5'. So, I renamed the existing directory (didn't want to loose it just in case), and copied over the ~/vsdbg version that was installed for linux-arm.
Then I tried to attach again. Still no go. I then looked at the files. Hmmm.. they got updated (or downgraded depending on how you look at it). It seems the the GetVsDbg script will always check to see if it's the latest version and if not, update itself. Well, the version that it downloads is not for linux-arm and won't even run. However, there is a switch that can be set to NOT update. So in the script I can changed:
__SkipDownloads=false
to
__SkipDownloads=true
Then updated my vs2017u5 directory with the latest code again.
Now it works. I can attach the Visual Studio debugger to a running process on the linux box all native.
RoySalisbury
on 10 Dec 2017
If anyone is interested, I got this working with the Bitvise SSH client (I like it better than Putty). I tried using the terminal client (stermc.exe), but it kept throwing an error with 'SetConsoleScreenBuffer'. However, the sexec.exe works perfect.
"adapter": "C:\Program Files (x86)\Bitvise SSH Client\sexec.exe",
"adapterArgs": "[email protected] -pw=yourpassword -cmd=\"~/vsdbg/vsdbg --interpreter=vscode\"",
There are all kinds of ways to authenticate (password, keys, profiles, ect), so you don't have to hardcode the password like I did. I was just testing. All console output goes into the debug window.
Roy
RoySalisbury
on 10 Dec 2017
thank's for this feature, but I have a question. How can I launch remote debug and give root permission to my app ?
fabien-chevalley
on 22 Dec 2017
You would want to login as root when launching vsdbg. For example if you are using ssh, pass root@yourTargetComputer as the credentials.
gregg-miskelly
on 24 Dec 2017
@gregg-miskelly thank you !
fabien-chevalley
on 26 Dec 2017
I'm also trying to debug a dotnet core app on a remote linux arm machine.
The simple hello world app runs if I start it manually.
When I start the debug session in VS2017 (latest stable ver 15.5.3) it even does it's sort of "debug session" context jump, but then I get a dialog "The debug adapter exited unexpectedly". The debug adapter log output is:
1> DebugAdapterHost version: 15.5.11011.1 commit:fe222a7058cc72ec98f7fd365f34d79fa9a22d75
1> Starting 'c:\Rob\Downloads\plink.exe' with arguments '-i c:\users\nzrotur\key.ppk [email protected] -batch -T ~/vsdbg/vsdbg --interpreter=vscode'
1> [DebugAdapter] --> C (initialize-1): {"command":"initialize","arguments":{"clientID":"visualstudio","adapterID":"coreclr","linesStartAt1":true,"columnsStartAt1":true,"pathFormat":"path","supportsVariableType":true,"supportsHandshakeRequest":true},"seq":1,"type":"request"}
1> [DebugAdapter] <--   R (initialize-1): {"seq":0,"type":"response","request_seq":1,"success":true,"command":"initialize","message":"","body":{"supportsConfigurationDoneRequest":true,"supportsFunctionBreakpoints":false,"supportsConditionalBreakpoints":true,"supportsEvaluateForHovers":true,"exceptionBreakpointFilters":[{"filter":"all","label":"All Exceptions","default":false},{"filter":"user-unhandled","label":"User-Unhandled Exceptions","default":true}],"supportsSetVariable":true,"supportsModulesRequest":true,"additionalModuleColumns":[{"attributeName":"vsLoadAddress","label":"Load Address","type":"string"},{"attributeName":"vsPreferredLoadAddress","label":"Preferred Load Address","type":"string"},{"attributeName":"vsModuleSize","label":"Module Size","type":"number"},{"attributeName":"vsLoadOrder","label":"Order","type":"number"},{"attributeName":"vsTimestampUTC","label":"Timestamp","type":"unixTimestampUTC"},{"attributeName":"vsIs64Bit","label":"64-bit","type":"boolean"},{"attributeName":"vsAppDomain","label":"AppDomain","type":"string"},{"attributeName":"vsAppDomainId","label":"AppDomainId","type":"number"}],"supportedChecksumAlgorithms":["MD5","SHA1","SHA256"],"supportsExceptionOptions":true,"supportsValueFormattingOptions":true,"supportsExceptionInfoRequest":true,"supportTerminateDebuggee":true,"supportsExceptionConditions":true,"supportsDebuggerProperties":true,"supportsSetExpression":true}}
1> [DebugAdapter] --> C (launch-2): {"command":"launch","arguments":{"noDebug":false,"name":".NET Core Launch","type":"coreclr","cwd":"~/rob","program":"~/rob/CoreConsoleDemo1","request":"launch"},"seq":2,"type":"request"}
1> [DebugAdapter] <--   C (handshake-1): {"seq":1,"type":"request","command":"handshake","arguments":{"value":"nOGlxr9w497R8aq5AG1Gf0unMa2hJSmDt9pfdkP9eyE="}}
1> [DebugAdapter] --> R (handshake-1): {"request_seq":1,"success":true,"command":"handshake","body":{"signature":"8120e5zh/XjZtAzrmsM41e32piDLz74Y9Iv90jBeCeKyo0="},"seq":3,"type":"response"}
1> [DebugAdapter] <--   E (output): {"seq":2,"type":"event","event":"output","body":{"category":"console","output":"-------------------------------------------------------------------\nYou may only use the Microsoft .NET Core Debugger (vsdbg) with\nVisual Studio Code, Visual Studio or Visual Studio for Mac software\nto help you develop and test your applications.\n-------------------------------------------------------------------\n"}}
1> [DebugAdapter] <--   R (launch-2): {"seq":3,"type":"response","request_seq":2,"success":true,"command":"launch"}
1> [DebugAdapter] <--   E (initialized): {"seq":4,"type":"event","event":"initialized","body":{}}
1> [DebugAdapter] --> C (setDebuggerProperty-4): {"command":"setDebuggerProperty","arguments":{"DisableJITOptimization":0},"seq":4,"type":"request"}
1> [DebugAdapter] <--   R (setDebuggerProperty-4): {"seq":5,"type":"response","request_seq":4,"success":true,"command":"setDebuggerProperty","message":"","body":{}}
1> [DebugAdapter] --> C (setDebuggerProperty-5): {"command":"setDebuggerProperty","arguments":{"InterpreterOptions":1},"seq":5,"type":"request"}
1> [DebugAdapter] <--   R (setDebuggerProperty-5): {"seq":6,"type":"response","request_seq":5,"success":true,"command":"setDebuggerProperty","message":"","body":{}}
1> [DebugAdapter] --> C (setDebuggerProperty-6): {"command":"setDebuggerProperty","arguments":{"JustMyCodeStepping":1},"seq":6,"type":"request"}
1> [DebugAdapter] <--   R (setDebuggerProperty-6): {"seq":7,"type":"response","request_seq":6,"success":true,"command":"setDebuggerProperty","message":"","body":{}}
1> [DebugAdapter] --> C (setDebuggerProperty-7): {"command":"setDebuggerProperty","arguments":{"StopOnExceptionCrossingManagedBoundary":0},"seq":7,"type":"request"}
1> [DebugAdapter] <--   R (setDebuggerProperty-7): {"seq":8,"type":"response","request_seq":7,"success":true,"command":"setDebuggerProperty","message":"","body":{}}
1> [DebugAdapter] --> C (setDebuggerProperty-8): {"command":"setDebuggerProperty","arguments":{"TraceSettings":"PropertySetting;WindowsBase;System.Diagnostics.PresentationTraceSources;AnimationSource=Off;PropertySetting;WindowsBase;System.Diagnostics.PresentationTraceSources;DataBindingSource=Warning;PropertySetting;WindowsBase;System.Diagnostics.PresentationTraceSources;DependencyPropertySource=Off;PropertySetting;WindowsBase;System.Diagnostics.PresentationTraceSources;DocumentsSource=Off;PropertySetting;WindowsBase;System.Diagnostics.PresentationTraceSources;FreezableSource=Off;PropertySetting;WindowsBase;System.Diagnostics.PresentationTraceSources;HwndHostSource=Off;PropertySetting;WindowsBase;System.Diagnostics.PresentationTraceSources;MarkupSource=Off;PropertySetting;WindowsBase;System.Diagnostics.PresentationTraceSources;NameScopeSource=Off;PropertySetting;WindowsBase;System.Diagnostics.PresentationTraceSources;ResourceDictionarySource=Off;PropertySetting;WindowsBase;System.Diagnostics.PresentationTraceSources;RoutedEventSource=Off;PropertySetting;WindowsBase;System.Diagnostics.PresentationTraceSources;NatvisDiagnostics=Off;"},"seq":8,"type":"request"}
1> [DebugAdapter] <--   R (setDebuggerProperty-8): {"seq":9,"type":"response","request_seq":8,"success":true,"command":"setDebuggerProperty","message":"","body":{}}
1> [DebugAdapter] --> C (setDebuggerProperty-9): {"command":"setDebuggerProperty","arguments":{"WarnIfNoUserCodeOnLaunch":1},"seq":9,"type":"request"}
1> [DebugAdapter] <--   R (setDebuggerProperty-9): {"seq":10,"type":"response","request_seq":9,"success":true,"command":"setDebuggerProperty","message":"","body":{}}
1> [DebugAdapter] --> C (setExceptionBreakpoints-10): {"command":"setExceptionBreakpoints","arguments":{"filters":[],"exceptionOptions":[{"path":[{"names":["CLR"]}],"breakMode":"userUnhandled"},{"path":[{"names":["CLR"]},{"names":["System.AppDomainUnloadedException","System.Threading.ThreadAbortException"]}],"breakMode":"unhandled"},{"path":[{"names":["CLR"]},{"names":["System.Windows.Markup.XamlParseException","System.Reflection.MissingMetadataException","System.Reflection.MissingRuntimeArtifactException"]}],"breakMode":"always"},{"path":[{"names":["MDA"]}],"breakMode":"unhandled"},{"path":[{"names":["MDA"]},{"names":["CallbackOnCollectedDelegate","ContextSwitchDeadlock","DateTimeInvalidLocalFormat","DisconnectedContext","FatalExecutionEngineError","InvalidFunctionPointerInDelegate","InvalidMemberDeclaration","InvalidVariant","LoaderLock","NonComVisibleBaseClass","PInvokeStackImbalance","RaceOnRCWCleanup","Reentrancy"]}],"breakMode":"always"}]},"seq":10,"type":"request"}
1> [DebugAdapter] <--   R (setExceptionBreakpoints-10): {"seq":11,"type":"response","request_seq":10,"success":true,"command":"setExceptionBreakpoints"}
1> [DebugAdapter] --> C (configurationDone-11): {"command":"configurationDone","arguments":{},"seq":11,"type":"request"}
1> [DebugAdapter] <--   E (output): {"seq":12,"type":"event","event":"output","body":{"category":"telemetry","output":"VS/Diagnostics/Debugger/vsdbg/ProcessCreate","data":{"VS.Diagnostics.Debugger.vsdbg.LinuxDistroVersion":"Linux version 4.6.0-rt1-xilinx-22210-g9b02b83 (ubqt@ubqt) (gcc version 4.9.2 20140904 (prerelease) (crosstool-NG linaro-1.13.1-4.9-2014.09 - Linaro GCC 4.9-2014.09) ) #4 SMP PREEMPT RT Thu Jun 1 13:59:22 NZST 2017","VS.Diagnostics.Debugger.vsdbg.KernelRelease":"4.6.0-rt1-xilinx-22210-g9b02b83","VS.Diagnostics.Debugger.vsdbg.OSFamily":"Linux","VS.Diagnostics.Debugger.vsdbg.Version":"15.6.11121.1 commit:93a9297b4a8aa3937d73947014b85b6914bec9ca"}}}
1> [DebugAdapter] <--   E (process): {"seq":13,"type":"event","event":"process","body":{"name":"~/rob/CoreConsoleDemo1","systemProcessId":1372,"startMethod":"launch"}}
1> [DebugAdapter] <--   E (output): {"seq":14,"type":"event","event":"output","body":{"category":"telemetry","output":"VS/Diagnostics/Debugger/vsdbg/Launch","data":{"VS.Diagnostics.Debugger.vsdbg.AdapterId":"coreclr","VS.Diagnostics.Debugger.vsdbg.Launch.Duration":660,"VS.Diagnostics.Debugger.vsdbg.VisualizerFileUsed":false,"VS.Diagnostics.Debugger.vsdbg.LinuxDistroVersion":"Linux version 4.6.0-rt1-xilinx-22210-g9b02b83 (ubqt@ubqt) (gcc version 4.9.2 20140904 (prerelease) (crosstool-NG linaro-1.13.1-4.9-2014.09 - Linaro GCC 4.9-2014.09) ) #4 SMP PREEMPT RT Thu Jun 1 13:59:22 NZST 2017","VS.Diagnostics.Debugger.vsdbg.KernelRelease":"4.6.0-rt1-xilinx-22210-g9b02b83","VS.Diagnostics.Debugger.vsdbg.OSFamily":"Linux","VS.Diagnostics.Debugger.vsdbg.SourceFileMappings":0,"VS.Diagnostics.Debugger.vsdbg.Version":"15.6.11121.1 commit:93a9297b4a8aa3937d73947014b85b6914bec9ca"}}}
1> [DebugAdapter] <--   R (configurationDone-11): {"seq":15,"type":"response","request_seq":11,"success":true,"command":"configurationDone"}
1> ERROR: The debug adapter exited unexpectedly.
My launch file is:
{
  "version": "0.2.0",
  "adapter": "c:\\Rob\\Downloads\\plink.exe",
  "adapterArgs": "-i c:\\users\\nzrotur\\key.ppk [email protected] -batch -T ~/vsdbg/vsdbg --interpreter=vscode",
  "languageMappings": {
    "C#": {
      "languageId": "3F5162F8-07C6-11D3-9053-00C04FA302A1",
      "extensions": [ "*" ]
    }
  },
  "exceptionCategoryMappings": {
    "CLR": "449EC4CC-30D2-4032-9256-EE18EB41B62B",
    "MDA": "6ECE07A9-0EDE-45C4-8296-818D8FC401D4"
  },
  "configurations": [
    {
      "name": ".NET Core Launch",
      "type": "coreclr",
      "cwd": "~/rob",
      "program": "~/rob/CoreConsoleDemo1",
      "request": "launch"

    }
  ]
}
Am I missing something? Those with eagle-eyes may have noticed from the log that we're running a custom kernel, and our distro is a custom yocto build, but I'm mostly sure the dotnet core deps are there.
I originally posted this in the wrong forum (no ARM-specific) so reposted.
 robertturner
on 10 Jan 2018
robertturner
on 10 Jan 2018
@robertturner Please see the comments from @RoySalisbury here. When launching from Visual Studio, we will attempt to download the latest stable version of vsdbg. Since the arm work is still in preview, it will not be downloaded by this script. This means that you end up trying to use an x64 version of vsdbg on linux-arm, which will not work.
There are instructions here on how to manually download the correct linux-arm version of vsdbg. @RoySalisbury also provided instructions on how to coerce the vsdbg download script to not downgrade the debugger in the case of automatic deploy.
Please let us know if you have additional questions.
chuckries
on 10 Jan 2018
@chuckries have downloaded the arm beta vsdbg and it runs. This is evident in the VS2017 debug log as the two chat a bit first and then it crashes. Is the auto-download still a problem then?
robertturner
on 11 Jan 2018
I ran vsdbg through strace to get a better idea of what it was doing when it crashed, but nothing obvious jumps out. strace log: stracedump.txt
robertturner
on 11 Jan 2018
Any more thoughts on how I might debug this?
robertturner
on 15 Jan 2018
@robertturner is it at all possible for me to get an image of the linux distro you are working with?
chuckries
on 16 Jan 2018
@robertturner another idea is to run vsdbg under gdb to see if it captures any error. I am not 100% sure if this will produce useful output, but it is a start.
In your launch.json, replace
"adapterArgs": "-i c:\\users\\nzrotur\\key.ppk [email protected] -batch -T ~/vsdbg/vsdbg --interpreter=vscode",
with
"adapterArgs": "-i c:\\users\\nzrotur\\key.ppk [email protected] -batch -T gdb -ex run --args ~/vsdbg/vsdbg --interpreter=vscode",
and see if this produces any interesting output.
chuckries
on 16 Jan 2018
The best option is probably to collect a core dump of the process and let me take a look at it (I am unsure if this will work for arm, but if we can collect the dump I can investigate from there).
To enable core dumps from a bash shell, run ulimit -c unlimited. Now any program run from this shell that crashes will create a core dump. Amend your launch options to the following:
"adapterArgs": "-i c:\\users\\nzrotur\\key.ppk [email protected] -batch -T ulimit -c unlimited && ~/vsdbg/vsdbg --interpreter=vscode",
Repro the crash and collect the core dump, it should be the file core in your home directory. Email me at [email protected] so we can discuss a private means to share the file, as you will not want to upload it here. I will take a look at it from there.
chuckries
on 16 Jan 2018
Hello! Has anyone tried to debug an ASP.NET Core app on RPi 3? I'm going to try this within a couple of days, would be great to hear about any positive experience though.
 screen0920
on 18 Jan 2018
screen0920
on 18 Jan 2018
Yes, ASP.NET Core + RPi 3 is one of the things we tested.
gregg-miskelly
on 18 Jan 2018
Hi guys, thanks for the support. I'll be trying your suggestions in the coming weeks. Cheers
robertturner
on 25 Jan 2018
Hi all,
I have been able to successfully attach from VS2017 to a simple HelloWorld .NET Core console app process running on a RPi3 per @RoySalisbury instructions.
However, I have not been able to get any breakpoints [set within my VS2017 IDE] to hit. And if I try to set a _new_ breakpoint after attaching to said process I get a fatal error stating "Could not set breakpoint". Said process is "killed" on the RPi3 and my VS2017 debugging session is ended.
The only thing I wasn't able to do exactly per @RoySalisbury instructions was to _"Install .NET Core SDK v2.2.0 preview locally (IDE computer)"_. Could someone provide details on how to specifically get the _.NET Core SDK v2.2.0 preview/beta_?
Thanks
 dknippel
on 31 Jan 2018
dknippel
on 31 Jan 2018
@dknippel The latest SDK that you'll want to install is here. These are listed as 2.1, so I'm not exactly sure what's going on with versioning, but these are the latest.
How are you building/deploying the app to the RPi3? What .NET Core Runtime version are you running on the RPi3?
chuckries
on 31 Jan 2018
@chuckries , thank you for your quick reply. Attached below are
- "Failed to set break point" dialogue
- SDK version before install
- SDK version after install (for verification)
- Debug general options in VS2017
RE: your questions:
- I am building a self-containing app and deploying onto the RPi3 via SSH and the pscp.exe util from Putty
- The .NET Core Runtime on the RPi3 is: Microsoft .NET Core Shared Framework Host --> Version: 2.0.4


dknippel
on 31 Jan 2018
@dknippel
- Just to be clear, you are building self contained, so you are deploying the linux-arm runtime with the app? You can run
./MyConsoleAppand notdotnet MyConsoleApp.dll? If this is the case than the shared framework host installed on the machine doesn't matter. For the record, the shared framework host version < 2.1 does not support linux-arm debugging. - Is your app targeting netcoreapp2.1? Can you paste your project.json?
chuckries
on 31 Jan 2018
Thank you again, your help is very much appreciated.
That was my understanding of "self-contained". However, I wasn't able to remove the shared framework host from the RPi3.
Here is the project.json…
{
  "runtimeTarget": {
    "name": ".NETCoreApp,Version=v2.1",
    "signature": "da39a3ee5e6b4b0d3255bfef95601890afd80709"
  },
  "compilationOptions": {},
  "targets": {
    ".NETCoreApp,Version=v2.1": {
      "MyConsoleApp/1.0.0": {
        "runtime": {
          "MyConsoleApp.dll": {}
        }
      }
    }
  },
  "libraries": {
    "MyConsoleApp/1.0.0": {
      "type": "project",
      "serviceable": false,
      "sha512": ""
    }
  }
}
dknippel
on 31 Jan 2018
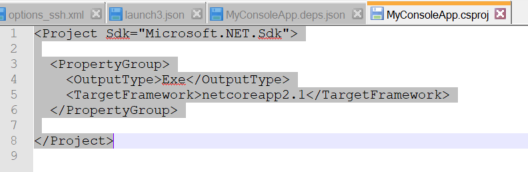
@dknippel I misspoke when I said project.json, you should have a .csproj at this point in .NET Core. Do you have a .csproj?
chuckries
on 31 Jan 2018
dknippel
on 31 Jan 2018
ok I think I might know what is happening here...(maybe ;-)) …
- From with VS2017 IDE I am trying to Debug --> Attach to Process…
-> thus, I have to first manually startup said process on the RPi3 via "pi@raspberrypi: ~$ dotnet ~/test/MyConsoleApp.dll" Since I am manually starting up said process on the RPi3, the RPi3 makes use of the framework on it which is 'Microsoft.NETCore.App', verion '2.1.0-preview2-26130-06'
So...I'm guessing that when I compile/publish from my VS2017 IDE box, said box is using a different framework target?
Thoughts?
dknippel
on 1 Feb 2018
If you have a self contained app, you should not be using dotnet to start it, you should have a MyConsoleApp executable somewhere in the deployment. You should be able to run ~/test/MyConsoleApp. Since you copied this from windows you might have to manually run chmod 755 ~/test/MyConosleApp to mark is as executable.
chuckries
on 1 Feb 2018
Yes, just as I posted the last comment I realized what your were hinting at in your earlier comment about
You can run ./MyConsoleApp and not dotnet MyConsoleApp.dll
OK, yes I did have to chmod the file. then I did startup the console app via "./MyConsoleApp and voila it started up via the self-contained runtime (rather than the local RPi3 runtime).
Then I go back over to VS2017 IDE and attach. It attaches. Yay! however, still no breakpoints are being caught and if I try to set a new breakpoint --> "Failed to set breakpoint" error again :-(
Also, I notice that after I attach to said process the red dot for breakpoint in VS2017 IDE has the red/yellow circle breakpoint saying it will not be hit.....
….wait a minute.... I am using the following to publish:
dotnet publish -r linux-arm -f netcoreapp2.1 --force
but...I'm using the Build --> Build MyConsoleApp menu option from within VS2017 IDE....hmmmmm
dknippel
on 1 Feb 2018
The breakpoint will not be currently hit. The breakpoint is pending and will be resolved when debugging starts
...hmmm...but my VS2017 IDE output windows states:
Loaded '/home/pi/test/MyConsoleApp.dll'. Symbols loaded.
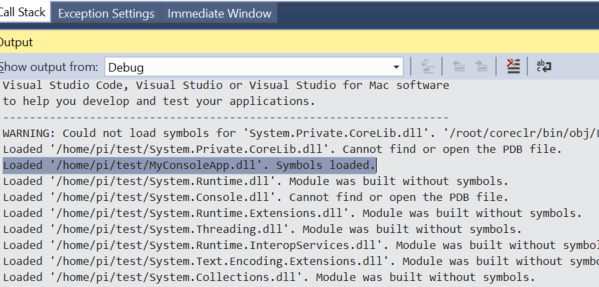
dknippel
on 1 Feb 2018
OK, so I build like so:
dotnet build -o bin\Debug\netcoreapp2.1\ -f netcoreapp2.1 -c Debug -r linux-arm --force
then I publish like so:
dotnet publish -r linux-arm -f netcoreapp2.1 --force
...then attach successfully,,,,but still no breakpoints are being hit....rats!
dknippel
on 1 Feb 2018
@dknippel Please turn on diagnostic logging:
- Open the VS Command Window from View -> Other Windows -> Command Window
- Run the command
DebugAdapterHost.Logging /On /OutputWindow - Attach to your process again
This should dump a bunch of output to the Output Window. Please copy that here or email it to me at [email protected]
chuckries
on 1 Feb 2018
@chuckries , do you think the vsdbg on the RPi3 is incorrect? I noticed the output states:
 1> Debug adapter non-protocol standard output: Using arguments
    Version                    : 'vs2017u5'
    Location                   : '/home/pi/.vs-debugger/vs2017u5'
    SkipDownloads              : 'true'
    LaunchVsDbgAfter           : 'true'
        VsDbgMode              : 'vscode'
    RemoveExistingOnUpgrade    : 'false'
Info: Using vsdbg version '15.1.11011.1'
Info: Last installed version of vsdbg is '15.1.11120.1'
Info: Skipping downloads
Info: Launching vsdbg
I changed the SkipDownloads from false (default) to true per @RoySalisbury recommendation
dknippel
on 1 Feb 2018
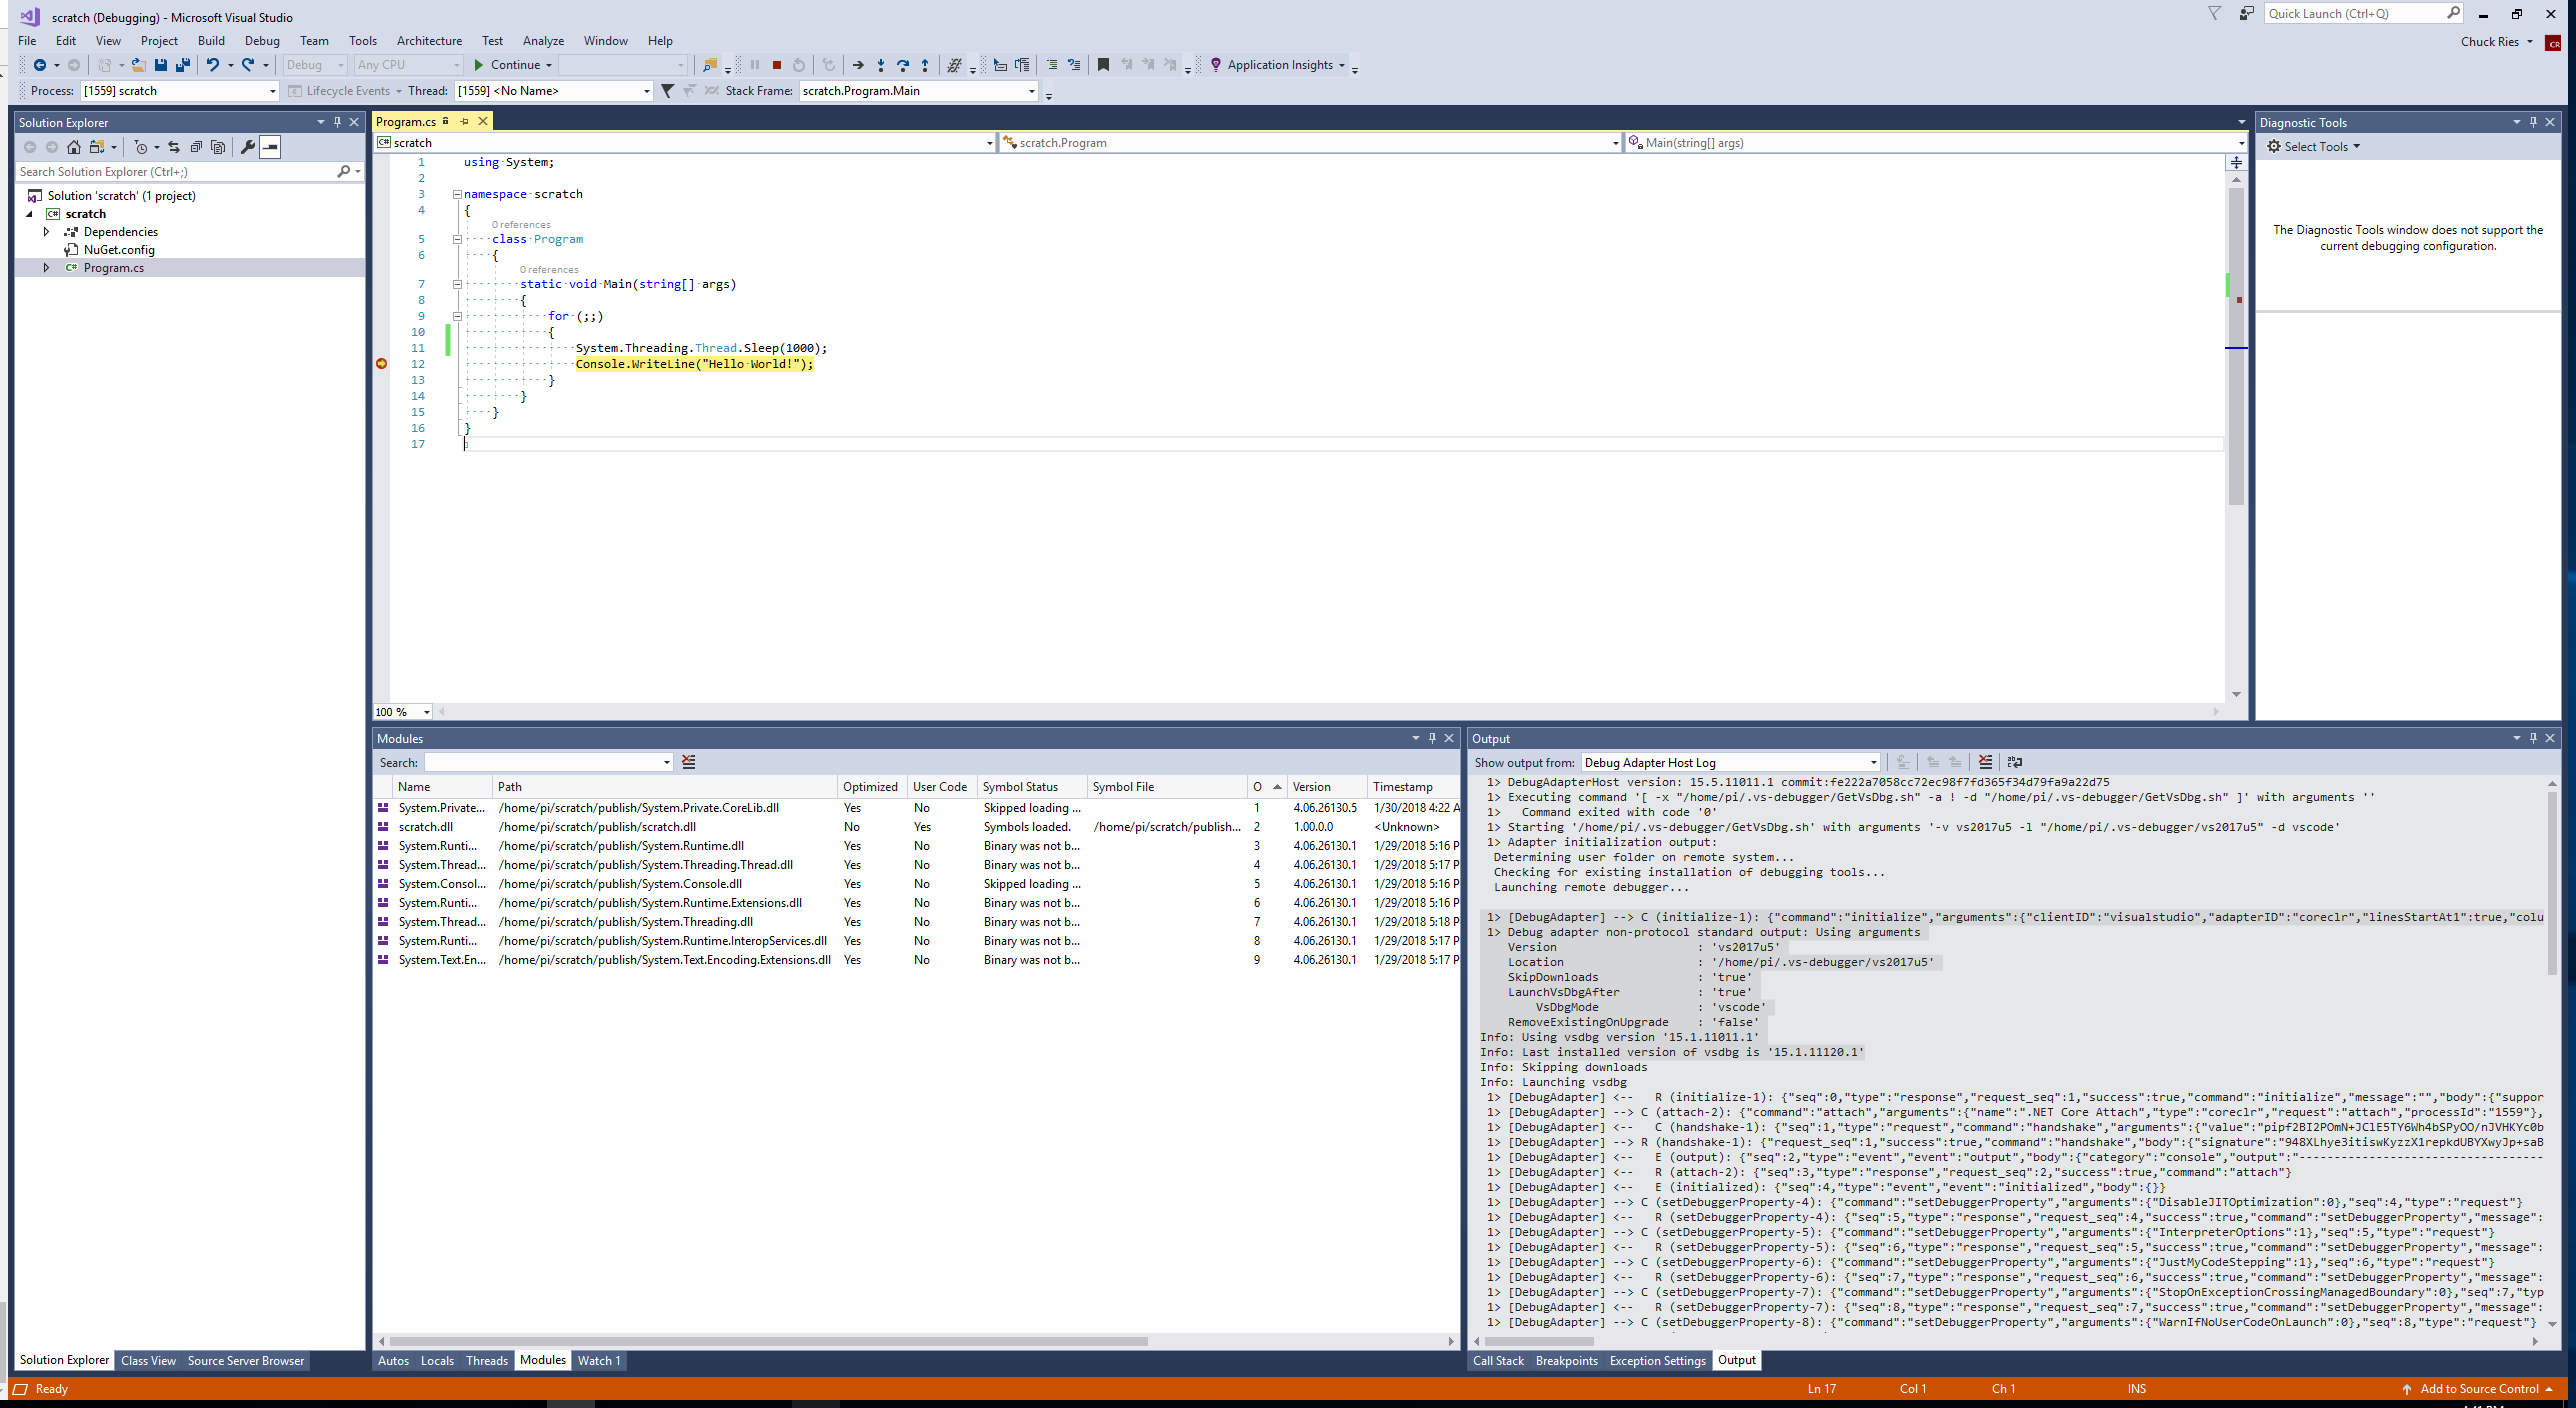
I spent some time getting a repro up and running to see if I hit what you were. I've attached a screenshot.
I am able to hit a breakpoint using attach to process. I am seeing the same thing that you are after following the advice from RoySalisbury:
1> Debug adapter non-protocol standard output: Using arguments
Version : 'vs2017u5'
Location : '/home/pi/.vs-debugger/vs2017u5'
SkipDownloads : 'true'
LaunchVsDbgAfter : 'true'
VsDbgMode : 'vscode'
RemoveExistingOnUpgrade : 'false'
Info: Using vsdbg version '15.1.11011.1'
Info: Last installed version of vsdbg is '15.1.11120.1'
Info: Skipping downloads
Info: Launching vsdbg
chuckries
on 1 Feb 2018
@dknippel what is the OS you are running on RPi3? Can you copy the contents of /etc/os-release if it exists? We have done all testing against Raspian 8/9. Here is my /etc/os-release:
pi@chuckr-pi:~/scratch $ cat /etc/os-release
PRETTY_NAME="Raspbian GNU/Linux 9 (stretch)"
NAME="Raspbian GNU/Linux"
VERSION_ID="9"
VERSION="9 (stretch)"
ID=raspbian
ID_LIKE=debian
HOME_URL="http://www.raspbian.org/"
SUPPORT_URL="http://www.raspbian.org/RaspbianForums"
BUG_REPORT_URL="http://www.raspbian.org/RaspbianBugs"
@chuckries here is my RPi3...
PRETTY_NAME="Raspbian GNU/Linux 8 (jessie)"
NAME="Raspbian GNU/Linux"
VERSION_ID="8"
VERSION="8 (jessie)"
ID=raspbian
ID_LIKE=debian
HOME_URL="http://www.raspbian.org/"
SUPPORT_URL="http://www.raspbian.org/RaspbianForums"
BUG_REPORT_URL="http://www.raspbian.org/RaspbianBugs"
dknippel
on 1 Feb 2018
@chuckries , in your VS2017 IDE, does your
dotnet --info
output this...
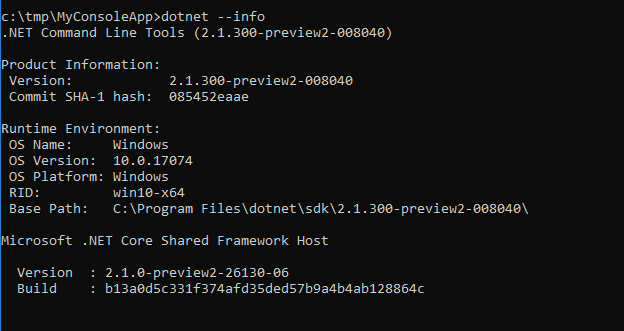
dknippel
on 1 Feb 2018
@dknippel: Yes I can tell from the log that we have the same version of the runtime. I also tried on an instance of Raspbian 8 and I was able to bind the breakpoint.
chuckries
on 1 Feb 2018
@dknippel What version of VS 2017 are you using? Help -> About Microsoft Visual Studio
chuckries
on 1 Feb 2018
15.5.5
dknippel
on 1 Feb 2018
@chuckries, are you certain your team has got this to work with Raspian 8 (Jessie)?
Whoops, cancel that question --> just saw that you've already confirmed Raspian 8.
I could upgrade to Raspian 9 (stretch)...
dknippel
on 1 Feb 2018
@dknippel Yes I am certain, I just tested this scenario on Jessie yesterday. Can you send another log after trying to reproduce the "Failed to set breakpoint" error dialog? It doesn't look like that is happening in the log that you sent.
chuckries
on 1 Feb 2018
@chuckries I noticed in one of your screen shots, that your scratch project that you have a NuGet.config file. My MyConsoleApp project does not have this. Can you shed some light on this?
dknippel
on 1 Feb 2018
@chuckries my current NuGet feed points to: https://dotnet.myget.org/F/dotnet-core/api/v3/index.json
dknippel
on 1 Feb 2018
That is the contents of my NuGet.config:
<configuration>
  <packageSources>
    <add key="dotnet-myget" value="https://dotnet.myget.org/F/dotnet-core/api/v3/index.json" />
  </packageSources>
</configuration>
Here is how I am building:
c:\tmp\MyConsoleApp>dotnet build -o bin\Debug\netcoreapp2.1\ -f netcoreapp2.1 -c Debug -r linux-arm --force
Here is how I am publishing:
c:\tmp\MyConsoleApp>dotnet publish -r linux-arm -f netcoreapp2.1 --force
Here is how I am migrating from windows 10 devx box (Surface) to Linux target (RPi3):
c:\tmp\MyConsoleApp>pscp.exe -i "c:\tmp\key.ppk" "c:\tmp\MyConsoleApp\bin\Debug\netcoreapp2.1\linux-arm\publish\*" [email protected]:/home/pi/test
Reviewing the output from Debug Adapter Host Log reveals this:
1> [DebugAdapter] <--   E (output): {"seq":29,"type":"event","event":"output","body":{"category":"telemetry","output":"VS/Diagnostics/Debugger/vsdbg/CommandFailed","data":{"VS.Diagnostics.Debugger.vsdbg.AdapterId":"coreclr","VS.Diagnostics.Debugger.vsdbg.ErrorCode":3002,"VS.Diagnostics.Debugger.vsdbg.Command":"setBreakpoints","VS.Diagnostics.Debugger.vsdbg.LinuxDistroVersion":"Linux version 4.1.18-v7+ (dc4@dc4-XPS13-9333) (gcc version 4.9.3 (crosstool-NG crosstool-ng-1.22.0-88-g8460611) ) #846 SMP Thu Feb 25 14:22:53 GMT 2016","VS.Diagnostics.Debugger.vsdbg.KernelRelease":"4.1.18-v7+","VS.Diagnostics.Debugger.vsdbg.OSFamily":"Linux","VS.Diagnostics.Debugger.vsdbg.Version":"15.6.11121.1 commit:93a9297b4a8aa3937d73947014b85b6914bec9ca"}}}
 1> [DebugAdapter] <--   R (setBreakpoints-14): {"seq":30,"type":"response","request_seq":14,"success":false,"command":"setBreakpoints","message":"Failed to set breakpoint."}
However, notice that the error appears to come from the RPi3. More specifically the line containing the Errror response states:
"VS.Diagnostics.Debugger.vsdbg.Version":"15.6.11121.1 commit:93a9297b4a8aa3937d73947014b85b6914bec9ca"
Whereas a few lines prior to this the Debug Adaptor Host Log states:
Info: Using vsdbg version '15.1.11011.1'
Info: Last installed version of vsdbg is '15.1.11120.1'
dknippel
on 1 Feb 2018
This is expected, these log lines are coming from different places. The first is the GetVsDbg.sh script that we altered according to RoySalisbury's instructions. We altered this script so that it would not download vsdbg and we could drop in a specific vsdbg built for linux-arm. The second is our custom vsdbg spitting out it's version, which is correct. I am seeing the same lines in my log:
Info: Using vsdbg version '15.1.11011.1'
Info: Last installed version of vsdbg is '15.1.11120.1'

"VS.Diagnostics.Debugger.vsdbg.Version":"15.6.11121.1 commit:93a9297b4a8aa3937d73947014b85b6914bec9ca"
@chuckries really nuts question: Do I need to have something from the https://github.com/OmniSharp/omnisharp-vscode repo installed?
dknippel
on 1 Feb 2018
No, that repo provides the C# extension for VS Code. If you wanted to debug from VS Code rather than Visual Studio, you would need that. However, given what we're seeing, I believe you would be hitting the same issue.
chuckries
on 1 Feb 2018
I'm sorry if this goes without saying, but you have you tried doing a full restart of both the windows machine and the raspberry pi? Have you updated the pi recently using sudo apt-get update and sudo apt-get upgrade?
chuckries
on 1 Feb 2018
OK, just for sh*ts n giggles I also tried launching the debugger adapter from the VS2017 IDE Command Window using the following command:
DebugAdapterHost.Launch /LaunchJson:"C:\tmp\MyConsoleApp\launch.json"
The content of that launch.json is:
Unfortunately, I get the exact same behavior with error "Could not set breakpoint" :-(
dknippel
on 1 Feb 2018
@chuckries yes, I have restarted both window and Rpi3 box. Also performed sudo apt-get update and sudo apt-get upgrade successfully.
When I launch ./MyConsoleApp on the RPi3 box, do I need to do this using sudo? Also, do I need to open VS2017 IDE with elevated privileges ?
Just curious, how do I remove the .NET framework host from the RPi3?
dknippel
on 1 Feb 2018
Maybe the debugger installation is corrupted? can you try this? First make sure that ~/.vs-debugger/GetVsDbg.sh is still correctly edited to say '__SkipDownloads=true'. Then:
rm -rf ~/.vs-debugger/vs2017u5
curl -sSL https://aka.ms/getvsdbgshbeta | bash /dev/stdin -r linux-arm -v latest -l ~/.vs-debugger/vs2017u5
Then try this again. Be careful, because when you restart Visual Studio, it will redownload GetVsDbg.sh, wiping out the change we made to set __SkipDownloads=true
chuckries
on 1 Feb 2018
YAY! It works!!!
Yes, it looks as if my debugger install on the RPi3 was corrupted. These are the additional steps I needed to perform to get remote debugging on RPi3 to work:
On the RPi3...
- Delete the entire ~/.vs-debugger directory (recursively)
rm-rf ~/.vs-debugger
Create a new directory path
mkdir .vs-debuggercd .vs-debuggermkdir vs2017u5Install latest debugger
curl -sSL https://aka.ms/getvsdbgshbeta | bash /dev/stdin -r linux-arm -v latest -l ~/.vs-debugger/vs2017u5Start my app
cd ~cd test./MyConsoleApp
On the Windows dev box...
- Attempt to attach to process on RPi3 box named _./MyConsoleApp_ NOTE: this will hang for a while and ultimately fail at first attempt. That's OK because what this does is create the ~/.vs-debugger/GetVsDbg.sh file on the RPi3 box for you. Unfortunately due to the default setting of
__SkipDownloads=falsewithin said GetVsDbg.sh file, this also downdates the vsdbg files on the RPi3
On the RPi3...
- Edit the ~/.vs-debugger/GetVsDbg.sh file and set __SkipDownloads=true
- Install latest debugger (yes, again)
curl -sSL https://aka.ms/getvsdbgshbeta | bash /dev/stdin -r linux-arm -v latest -l ~/.vs-debugger/vs2017u5
On the Windows dev box...
- Attempt to attach to process on RPi3 box named _./MyConsoleApp_
- Hope for the best :-)
dknippel
on 2 Feb 2018
@dknippel Awesome! Glad to hear this works. This will still continue to be somewhat painful until we release the linux-arm version of vsdbg (currently it is in preview).
You can avoid some of the headache by by doing the following:
- Manually use the beta version of the GetVsDbg script to download vsdbg somewhere on the RPi3, let's say to ~/vsdbg:
curl -sSL https://aka.ms/getvsdbgshbeta | bash /dev/stdin -r linux-arm -v latest -l ~/vsdbg
- Use the launch.json you created to attach to your app, specifying the location of our downloaded vsdbg:
{
  ...
  "configurations": [{
    ...
    "pipeTransport": {
      ...
      "debuggerPath": "~/vsdbg/vsdbg"
    }
  }]
}
This should remove the annoyance of the GetVsDbg.sh script being downloaded and overwriting our custom vsdbg.
chuckries
on 2 Feb 2018
@chuckries , so if I deploy a _self-contained_ solution to the RPi3, is the _only_ Prerequisites needed on the RPi3 the latest vsdbg via curl -sSL https://aka.ms/getvsdbgshbeta | bash /dev/stdin -r linux-arm -v latest -l ~/.vs-debugger/vs2017u5? ….OR do I also need the _libunwind8_
dknippel
on 2 Feb 2018
Please note, the only prerequisite for .NET Core on _RPi3_ is _libunwind8_ which can be achieved via:
sudo apt-get update
then
sudo apt-get install curl libunwind8 gettext apt-transport-https
There are additional prerequisites for .NET Core on _Linux_ . These get installed when you install the .NET Core SDK via:
sudo apt-get update
then
sudo apt-get install dotnet-sdk-2.0.0
However, since the RPi3 does not support the .NET Core SDK, you do not need invoke the above two commands.
dknippel
on 2 Feb 2018
@dknippel vsdbg (and I believe also coreclr) has a dependency on libunwind8 so it needs to be on the machine.
chuckries
on 2 Feb 2018
Required dependencies are not directly related to this ticket. Before you start remote-debugging, make sure that your app runs "the normal way", that is, ssh into the linux-arm device and call dotnet run yourapp. Show you support for this issue with relevant comments, but don't scare contributors with pages of unrelated chatty :) Thanks!
nzain
on 2 Feb 2018
@chuckries , do you know if vsdbg has changed in the last few days? Now when I try to debug the same RPi3 remotely from VS2017 IDE I get the following error:
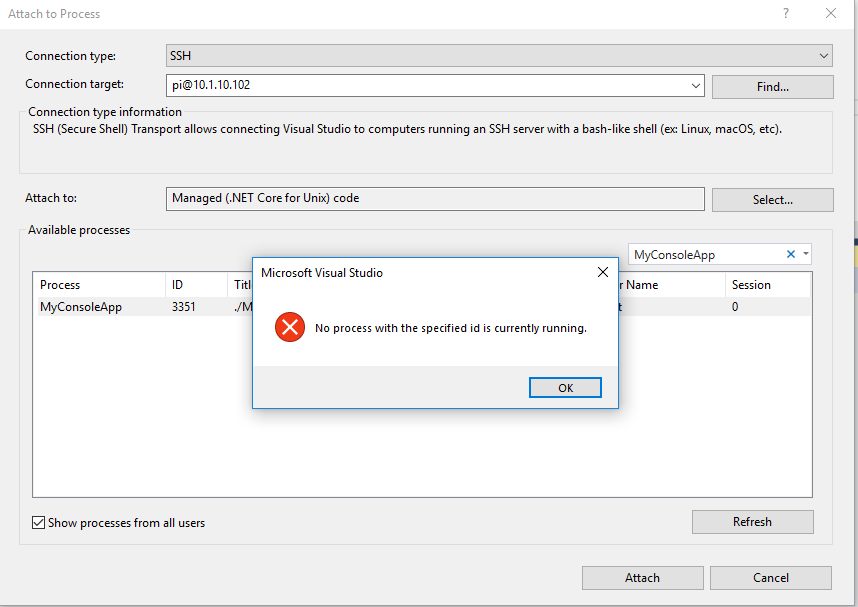
dknippel
on 7 Feb 2018
@dknippel that (very poor) error message means that when vsdbg did a process listing, it couldn't find the process. Most often, because vsdbg doesn't have sufficient privileges to debug (ex: different user accounts).
gregg-miskelly
on 7 Feb 2018
@gregg-miskelly , thank you for your super quick reply :-). I am launching MyConsoleApp under "sudo" and I am running VS2017 under Administrator. I'm pretty sure this is the same way I got this to work last Friday but now the Attach To Process mechanism spits out said error message.
Strangely enough, when I launch the debugger manually from VS2017 Command Window everything works fine.
Please note that I have rebooted both my DEV and TARGET boxes
???
dknippel
on 7 Feb 2018
@dknippel the VS user doesn't matter - it is the user account that you are running vsdbg under.
If I understand correctly, you are running your app under sudo, but vsdbg you are NOT running under sudo, so you will run into this problem. If you are debugging an app running under sudo you need to connect as 'root'.
gregg-miskelly
on 7 Feb 2018
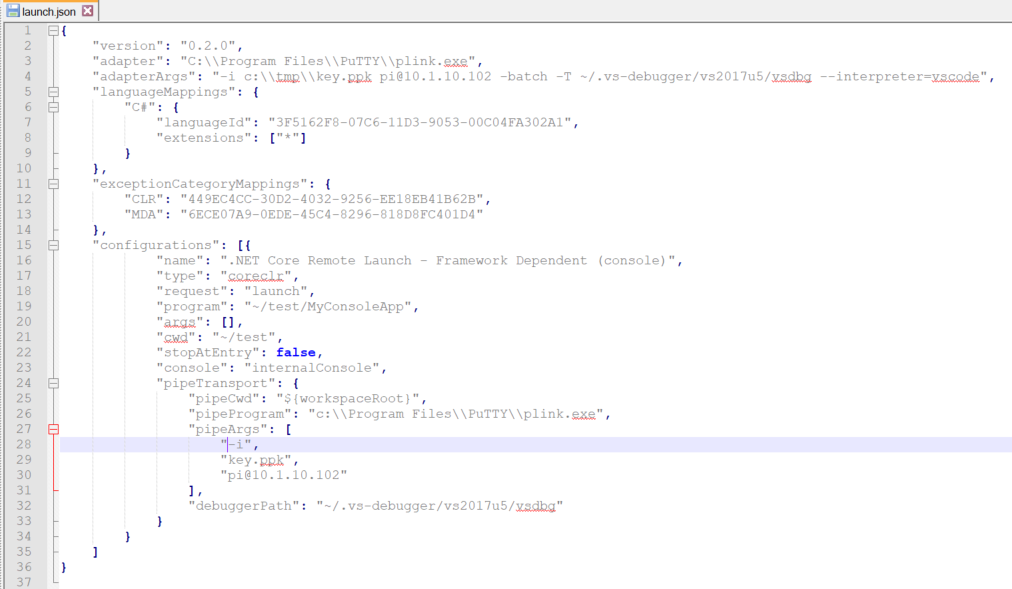
hmmm, if that is the case why does it work when I launch the debugger manually from VS2017? My launch.json file contains this:
"pipeTransport": {
                "pipeCwd": "${workspaceRoot}",
                "pipeProgram": "c:\\Program Files\\PuTTY\\plink.exe",
                "pipeArgs": [
                    "-i",
                    "key.ppk",
                    "[email protected]"
                ],
                "debuggerPath": "~/.vs-debugger/vs2017u5/vsdbg"
dknippel
on 7 Feb 2018
To make sure I understand, in the case where things are working, you are doing a launch, not an attach correct?
gregg-miskelly
on 7 Feb 2018
Yes, that is correct.
dknippel
on 7 Feb 2018
Then that makes sense -- in the launch case vsdbg is launching your app so they are running under the same identity. In the attach case you have your app running as root, and vsdbg running as 'pi', so vsdbg doesn't have rights to debug it.
gregg-miskelly
on 7 Feb 2018
Under Linux you can check "who you are" with commands like whoami
(out of my head).
You are certainly able to check the user who is running a specific process
(vsdbg), too. Not part of out-of-my-head knowledge :)
Make sure both match. Same mechanisms should be used by vsdbg to create
good error messages. Good luck!
Am 07.02.2018 03:23 schrieb "Gregg Miskelly" notifications@github.com:
Then that makes sense -- in the launch case vsdbg is launching your app so
they are running under the same identity. In the attach case you have your
app running as root, and vsdbg running as 'pi', so vsdbg doesn't have
rights to debug it.—
You are receiving this because you were mentioned.
Reply to this email directly, view it on GitHub
https://github.com/OmniSharp/omnisharp-vscode/issues/1562#issuecomment-363634707,
or mute the thread
https://github.com/notifications/unsubscribe-auth/ANUK-zoyWNaQwNs2tNsa7BB8qXt86ShFks5tSQkqgaJpZM4N3DMm
.
nzain
on 7 Feb 2018
@gregg-miskelly & @nzain , thank you for your feedback. As both of you identified, it was a permissions issue.
I had actually started up my app on the RPi3 via sudo ./test/MyConsoleApp , thus when I attempted to connect via _Attach to Process..._ it would fail because VS2017 IDE was using cached SSH credentials of the pi user rather than the sudo user. Once I started up my app on the RPi3 via ./test/MyConsoleApp everything worked as expected.
Thank you again for your diligence and patience :-)
dknippel
on 7 Feb 2018
@gregg-miskelly , if I need to Attach to Process... as root, how do I get VS2017 IDE to prompt me for credentials again?
dknippel
on 8 Feb 2018
You can enter root@<ip-addr> into the top of the attach to process dialog.
gregg-miskelly
on 8 Feb 2018
that's what I thought too, but when I do that it just searches and hangs...never prompts me for credentials like it did the first time I used the pi@<ip-addr>
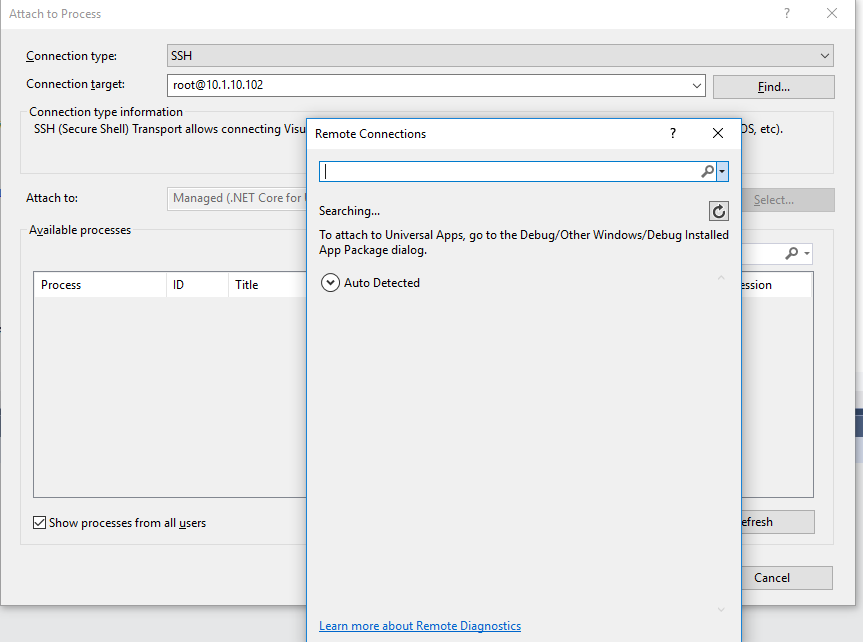
please note that on my RPi3 I have set a password for root and verified that I can login using it. seems to work fine when i'm actually on the RPi3.
Interestingly enough, I am not able to PuTTy into said RPi3 using root. When I try this PuTTy prompts me for the root password but returns _Access Denied_ . Do I need to somehow enable SSH for the root account?
dknippel
on 8 Feb 2018
My guess would be yes. Did you try this? https://askubuntu.com/questions/469143/how-to-enable-ssh-root-access-on-ubuntu-14-04
gregg-miskelly
on 8 Feb 2018
@gregg-miskelly & @nzain , thank you for all your help. I can now remotely debug my .NET Core app running on my RPi3 from my VS2017 IDE.
As typical engineers do...once I got the above working I tried to push the edge a bit by incorporating a new project into the above solution. It was a simple _widget_ library targeting the .NET Standard framework. When I tried to build using the following command:
dotnet build -o bin\Debug\netcoreapp2.1\ -f netcoreapp2.1 -c Debug -r linux-arm --force
I received the following error:

Is what I'm trying to do (remotely debug a .NET Core app that references .NET Standard assembly) not possible yet?
dknippel
on 9 Feb 2018
@dknippel Your question isn't really related to debugging, but it is really -- how can a netcoreapp2.1 project reference a netstandard2.0 library project. I would certainly expect that to work at runtime. I am not certain what you need to do to make the build system happy. Your .csproj for MyNetStandardWidget looks like this? --
<Project Sdk="Microsoft.NET.Sdk">

  <PropertyGroup>
    <TargetFramework>netstandard2.0</TargetFramework>
  </PropertyGroup>

</Project>
If so, I might suggest opening an issue at https://github.com/dotnet/cli as those folks are more the expert on this kind of thing. You may just be running into a bug in the 2.1 tooling since 2.1 is still in active development.
gregg-miskelly
on 9 Feb 2018
Couple of interesting points for anyone else trying to accomplish this:
- Explicitly include your project name when building/publishing with the dotnet utility like so:
dotnet publish -c Debug -f netcoreapp2.1 -r linux-arm --force MyConsoleApp.csproj. If you don't then the dotnet utility seems to get confused as to dependency order. - As of the date of this comment (and I was using .NET Core SDK 2.1.4), make sure your .NET Standard projects do not target higher than .NET Standard 2.0 framework. If I set my .NET Standard projects to target .NET Standard 2.1+ then the _.NET Core_ project that references them does not compile successfully.
Well, hope this helps someone. Have a great weekend!
dknippel
on 10 Feb 2018
I can report that the remote debbugging works with vscode on a Ubuntu 16.04 x64 development machine. On the development machine dotnet core 2.1 preview1 was installed.
development:~$ dotnet --info
.NET-Befehlszeilentools (2.1.300-preview1-008174)

Product Information:
 Version:            2.1.300-preview1-008174
 Commit SHA-1 hash:  b8df89a54f

Runtime Environment:
 OS Name:     ubuntu
 OS Version:  16.04
 OS Platform: Linux
 RID:         ubuntu.16.04-x64
 Base Path:   /usr/share/dotnet/sdk/2.1.300-preview1-008174/

Microsoft .NET Core Shared Framework Host

  Version  : 2.1.0-preview1-26216-03
  Build    : f2c3216183d20416568a4bbf5bb7d153e826f153
On the raspi I installed
pi@raspberrypi:~ $ curl -sSL https://aka.ms/getvsdbgshbeta | bash /dev/stdin -r linux-arm -v latest -l ~/vsdbg
Finally, I added ssh-login on the pi and modified the launch.json in vscode as described in the wiki.
I only tested Self Contained Deployment.
 markusr
on 5 Mar 2018
markusr
on 5 Mar 2018
Not sure if anyone has pointed this out yet. But Visual Studio (2017 15.6) has the ability to attach to the process via SSH all native now. No need for putty or bitvise or any other external client.
Still need to install the debugger on ARM manually and turn on the skip downloads in the GetVsDbg.sh script (it assumes all Linux is x64). Now we just need the "publish" updated in VS2017.
RoySalisbury
on 30 Mar 2018
FYI:, we are planning to update the aka.ms URL that VS uses to download vsdbg next week. So hopefully very soon you will see that VS 'just works'.
gregg-miskelly
on 30 Mar 2018
Does that mean that the GetVsDbg.sh script will be updated to look for not only platform (windows, linux, osx), but also the architecture (x86, x64, arm, ect)?
RoySalisbury
on 30 Mar 2018
Yes.
gregg-miskelly
on 30 Mar 2018
We have updated the aka.ms URL that VS uses to download vsdbg, which includes the fix to detect arm platform. Debugging linux-arm from VS should __just work__TM now.
chuckries
on 3 Apr 2018
End user verified. :) I deleted all of the contents of my .vs-debugger directory (after a quick backup of course). Then tried attaching to a process from Visual Studio. The linux-arm debugger was downloaded and process attached.
Good work guys!
Roy
RoySalisbury
on 4 Apr 2018
Well, I debug with VS2017, but every time it shows Abort when the break point is hit. Could anyone please help me out?
Very simple code:
using System;
using System.Threading;
namespace DebugTest
{
class Program
{
static void Main(string[] args)
{
Thread.Sleep(10000);
Console.WriteLine("Hello World!");
}
}
}
VS2017 DEBUG output:
You may only use the Microsoft .NET Core Debugger (vsdbg) with
Visual Studio Code, Visual Studio or Visual Studio for Mac software
to help you develop and test your applications.
Loaded '/opt/dotnet/shared/Microsoft.NETCore.App/2.0.0/System.Private.CoreLib.dll'. Skipped loading symbols. Module is optimized and the debugger option 'Just My Code' is enabled.
Loaded '/share/app/test/netcoreapp2.0/DebugTest.dll'. Symbols loaded.
Loaded '/opt/dotnet/shared/Microsoft.NETCore.App/2.0.0/System.Runtime.dll'. Skipped loading symbols. Module is optimized and the debugger option 'Just My Code' is enabled.
Loaded '/opt/dotnet/shared/Microsoft.NETCore.App/2.0.0/System.Threading.Thread.dll'. Skipped loading symbols. Module is optimized and the debugger option 'Just My Code' is enabled.
Loaded '/opt/dotnet/shared/Microsoft.NETCore.App/2.0.0/System.Console.dll'. Skipped loading symbols. Module is optimized and the debugger option 'Just My Code' is enabled.
The program '[1447] dotnet' has exited with code 0 (0x0).
Output on Raspberry Pi 3:
root@raspberrypi:/share/app/test/netcoreapp2.0# dotnet DebugTest.dll
Aborted
 wsptr
on 17 May 2018
wsptr
on 17 May 2018
@wsptr Your app is using .NET Core 2.0. Your need to upgrade your app to 2.1 in order for debugging to work.
These instructions are somewhat VS Code specific (ex: for VS you don't need to download vsdbg yourself, and you don't have a launch.json file), but all of the parts about developing your app will apply to VS as well: https://github.com/OmniSharp/omnisharp-vscode/wiki/Remote-Debugging-On-Linux-Arm
gregg-miskelly
on 17 May 2018
If we can now attach to process on RPI I'm wondering are there any plans to make VS automatically deploy, run and attach debugger on RPI just like with UWP apps on Windows IoT?
 dominikjeske
on 8 Dec 2018
dominikjeske
on 8 Dec 2018
@bigdnf I am not aware of plans, but the VS folks would implement such a feature are probably not reading this thread. I might recommend using "Help->Send Feedback->Suggest a feature" from Visual Studio.
gregg-miskelly
on 8 Dec 2018
Related issues
 ghost
·
3Comments
ghost
·
3Comments
 mentoreet
·
3Comments
mentoreet
·
3Comments
 hamhub7
·
3Comments
hamhub7
·
3Comments
 jwbay
·
3Comments
jwbay
·
3Comments
 nguillermin
·
3Comments
nguillermin
·
3Comments
Most helpful comment
We haven't yet tried any distro aside from Raspbian, but we have our first beta release up. Instructions for anyone who wants to try it: https://github.com/OmniSharp/omnisharp-vscode/wiki/Remote-Debugging-On-Linux-Arm