Omnisharp-roslyn: Intellisense CPU usage high
_From @h0rdak on December 16, 2015 8:54_
Whenever I use intellisense in my C# projects, the CPU usage spikes and makes my fans go crazy and my laptop unbearably hot to the point it's completely unusable.
This is with vs code 0.10.3 on OSX 10.10.5, on a macbook pro.

Activity monitor points to vs code -> electron helper -> mono-sgen

Installed mono is:
Mono JIT compiler version 4.2.1 (Stable 4.2.1.102/6dd2d0d Wed Dec 2 14:02:16 PST 2015)
_Copied from original issue: Microsoft/vscode#1368_
 jrieken
All 33 comments
@h0rdak Any details you can share with us? Project size and kind (dnx, msbuild) Could you attach the OmniSharp Log (Cmd+L L)?
jrieken
on 16 Dec 2015
This is with an empty Unity project, using the integration plugin.
Looking at the log, I seem to be getting an exception whenever intellisense is triggered:
System.ArgumentException: Diagnostic must have span '[128..128)'
Attached log, I get a new one of these every time intellisense is triggered.
 StigOlavsen
on 16 Dec 2015
StigOlavsen
on 16 Dec 2015
Thanks. The errors are unhappy but shouldn't be the cause of the issue. Can you also hint to the version of mono you are using?
jrieken
on 16 Dec 2015
Mono JIT compiler version 4.2.1 (Stable 4.2.1.102/6dd2d0d Wed Dec 2 14:02:16 PST 2015)
Was using 4.2.0 initially, ran into this and upgraded, still the same issue.
StigOlavsen
on 16 Dec 2015
I seem to have fixed the issue by installing dnvm and using it to download and install dnx-mono.1.0.0-rc1-update1
EDIT: Nope, sorry spoke too soon, still a problem.
StigOlavsen
on 16 Dec 2015
Same problem here with slow intellisense and high cpu. Just started after rebooting this morning.
mono-sgen and Electron Helper both run out of control for 20 seconds whenever I trigger intellisense, or go to definition, Find all references, etc.
VSCode 0.10.5
Unity 5.1.4
Mono 4.2.0
Macbook Pro OSX 10.11.2
Driving me crazy...
 shochet
on 21 Dec 2015
shochet
on 21 Dec 2015
Hi @jrieken. It has been a few months since you file this issue. Since then on dev branch, we introduced new tool-chain and update the Roslyn to 1.1.1. Can you try out the dev branch build to see if this is still a huge issue?
 troydai
on 10 Mar 2016
troydai
on 10 Mar 2016
How to upgrade VSCode's roslyn?
 fishg
on 22 Mar 2016
fishg
on 22 Mar 2016
@fishg you can follow the instructions in this readme: https://github.com/OmniSharp/omnisharp-roslyn/blob/dev/README.md.
troydai
on 22 Mar 2016
@troydai
Looks like build.sh have some problem on OS X:
Installing dotnet from beta channel for version 1.0.0.001897
Execute install script
source: https://raw.githubusercontent.com/dotnet/cli/43ac2b45f4173b8228b44c8a9693ac7774104cbb/scripts/obtain/install.sh
version: 1.0.0.001897
channel: beta
install: /Users/fishg/data/opensource/omnisharp-roslyn/.dotnet
./build.sh: line 35: /Users/fishg/data/opensource/omnisharp-roslyn/.dotnet/cli/dotnet: No such file or directory
* Building *
./build.sh: line 44: /Users/fishg/data/opensource/omnisharp-roslyn/.dotnet/cli/dotnet: No such file or directory
./build.sh: line 45: /Users/fishg/data/opensource/omnisharp-roslyn/.dotnet/cli/dotnet: No such file or directory
./build.sh: line 46: /Users/fishg/data/opensource/omnisharp-roslyn/.build/PublishProject/PublishProject: No such file or directory
fishg
on 22 Mar 2016
@troydai Sorry, it's my network problems.
fishg
on 22 Mar 2016
@troydai
When Publishing, no response.How to resolve?
NuGet Config files used:
/Users/fishg/data/opensource/omnisharp-roslyn/NuGet.Config
/Users/fishg/.nuget/NuGet/NuGet.Config
Feeds used:
https://www.myget.org/F/omnisharp-roslyn-ci/api/v3/index.json
Publishing
fishg
on 22 Mar 2016
Publishing blocked long time.No any result.
fishg
on 22 Mar 2016
@fishg can you copy the full log? I work on OSX full time so I doubt it is platform specific. It could be some problem with you miss some tools for packaging.
troydai
on 22 Mar 2016
@troydai
./build.sh
* Cleanup *
* Installing dotnet *
Installing dotnet from beta channel for version 1.0.0.001897
Execute install script
source: https://raw.githubusercontent.com/dotnet/cli/43ac2b45f4173b8228b44c8a9693ac7774104cbb/scripts/obtain/install.sh
version: 1.0.0.001897
channel: beta
install: /Users/fishg/data/opensource/omnisharp-roslyn/.dotnet
dotnet_install: Preparing to install .NET Tools from 'beta' channel to '/Users/fishg/data/opensource/omnisharp-roslyn/.dotnet'
dotnet_install: Downloading dotnet-dev-osx-x64.1.0.0.001897.tar.gz from https://dotnetcli.blob.core.windows.net/dotnet/beta/Binaries/1.0.0.001897
################################################################## 100.0%
dotnet_install: Extracting tarball
dotnet_install: Moving new CLI into install location and symlinking
dotnet_install: Cleaning dotnet-dev-osx-x64.1.0.0.001897.tar.gz
.NET Command Line Tools (1.0.0-beta-001897)
Product Information:
Version: 1.0.0-beta-001897
Commit Sha: ca74a9b177
Runtime Environment:
OS Name: Mac OS X
OS Version: 10.11
OS Platform: Darwin
Runtime Id: osx.10.11-x64
* Building *
log : Restoring packages for /Users/fishg/data/opensource/omnisharp-roslyn/tools/PublishProject/project.json...
info : Committing restore...
log : tools/PublishProject/project.json
log : Restore completed in 1734ms.
NuGet Config files used:
/Users/fishg/data/opensource/omnisharp-roslyn/NuGet.Config
/Users/fishg/.nuget/NuGet/NuGet.Config
Feeds used:
https://www.myget.org/F/omnisharp-roslyn-ci/api/v3/index.json
Publishing
No error log found.
fishg
on 23 Mar 2016
When I deleted nuget's cache, I build successed.
But a new problem is:
dnxcore50 have a excutable OmniSharp file,but not work in vscode with Unity3D project.
dnx451 have no excutable Unix file,so I add a new sh file:
#!/bin/bash
/usr/local/bin/mono /Users/fishg/data/opensource/omnisharp-roslyn/artifacts/publish/OmniSharp/osx.10.11-x64/dnx451/OmniSharp.exe "$@"
Now works.

fishg
on 23 Mar 2016
Cpu usage is also too high when open project or switch to new class file.

fishg
on 23 Mar 2016
@fishg can you elaborate what doesn't work with Unity under dnxcore50 OmniSharp?
troydai
on 23 Mar 2016
@troydai If use dnxcore50,process start normally, but no code any intellisense.
fishg
on 24 Mar 2016
@fishg can you point me to a mini repo for missing intellisense case?
troydai
on 24 Mar 2016
This is still an issue.
 speoplesz
on 6 Aug 2016
speoplesz
on 6 Aug 2016
I've been struggling with instances of intensely high CPU usage at odd points while coding in VSCode for over a year, now. I previously noticed some patterns related to working on classes implementing IDisposable, and again hit the issue today, to much frustration. I've managed to recreate the issue, albeit without the high CPU usage, in a simple project. Environment, steps, and findings below.
Operating environment:
- MacBook Pro 15 Mid 2015
- 16 GB RAM
- macOS Mojave 10.14.4
- VSCode 1.33.1
- Mono JIT compiler version 5.16.0.221 (2018-06/b63e5378e38 Mon Nov 19 18:08:09 EST 2018)
Steps to reproduce
dotnet new console -n MonoSgenCallcd MonoSgenCallcode .- Add required resources via VSCode prompt
- Add a new file to the project named
SomeDisposableClass.cswith following content:
```c#
using System;

public class SomeDisposableClass : IDisposable
{
    public void Dispose()
    {
    }
}
6. Start Activity Monitor to monitor process on CPU tab.
7. Make any compilable change to `SomeDisposableClass` and save the file and immediately note mono-sgen64 jumps up in the Activity Monitor list.
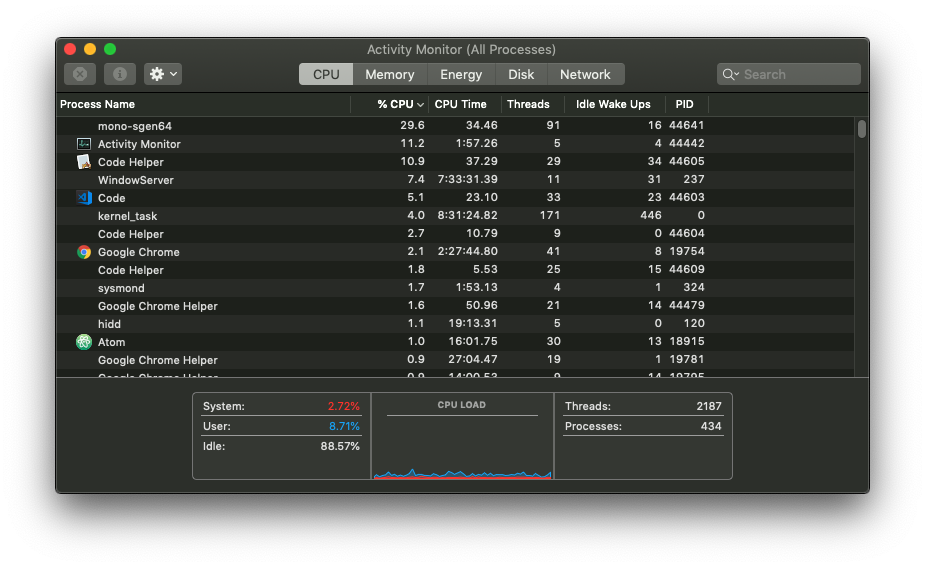
8. Update `SomeDisposableClass` to not implement `IDisposable`:
```c#
using System;

public class SomeDisposableClass
{
    public void Dispose()
    {
    }
}
- Make changes to class and save, as before
- Note that mono-sgen64 no longer jumps to the top of the list
CPU usage jumps far, far more when running this exercise (steps 5-7) in a much larger project:
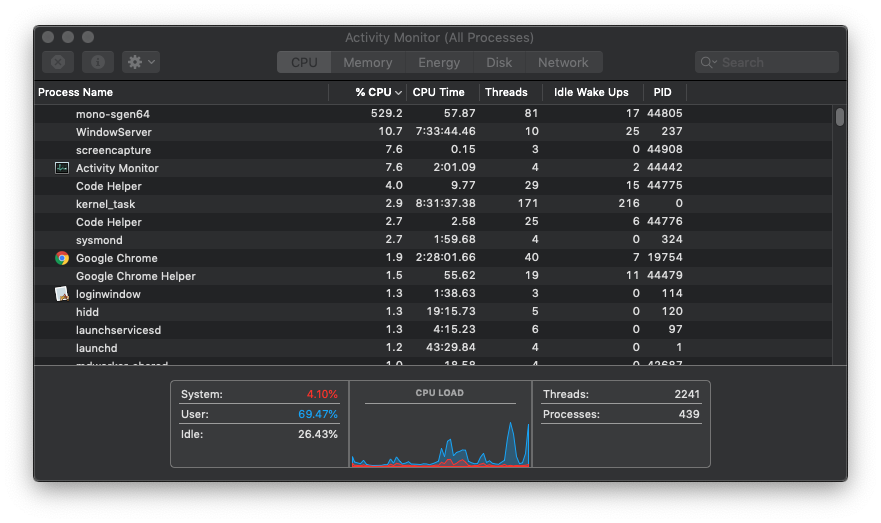
This, again, only happens for me when working on classes implementing IDisposable. This has been repeatable for a very long time for me, but I didn't take the time to collect information and steps until today. I've Googled quite a bit for IDisposable-related issues in this repo, IDisposable-related issues with Sgen in Mono, and with just VSCode, to no avail. Hopefully this can help move progress on resolving this in the right direction.
Happy to provide any additional information or testing.
 Jodacola
on 20 Apr 2019
Jodacola
on 20 Apr 2019
Nice post, @Jodacola
Did you manage to find more information to resolve this issue?
 atliegils
on 6 Jun 2019
atliegils
on 6 Jun 2019
I've been struggling with instances of intensely high CPU usage at odd points while coding in VSCode for over a year, now. I previously noticed some patterns related to working on classes implementing
IDisposable, and again hit the issue today, to much frustration. I've managed to recreate the issue, albeit without the high CPU usage, in a simple project. Environment, steps, and findings below.Operating environment:
- MacBook Pro 15 Mid 2015
- 16 GB RAM
- macOS Mojave 10.14.4
- VSCode 1.33.1
- Mono JIT compiler version 5.16.0.221 (2018-06/b63e5378e38 Mon Nov 19 18:08:09 EST 2018)
Steps to reproduce
dotnet new console -n MonoSgenCallcd MonoSgenCallcode .- Add required resources via VSCode prompt
- Add a new file to the project named
SomeDisposableClass.cswith following content:using System; public class SomeDisposableClass : IDisposable { public void Dispose() { } }
- Start Activity Monitor to monitor process on CPU tab.
- Make any compilable change to
SomeDisposableClassand save the file and immediately note mono-sgen64 jumps up in the Activity Monitor list.
- Update
SomeDisposableClassto not implementIDisposable:using System; public class SomeDisposableClass { public void Dispose() { } }
- Make changes to class and save, as before
- Note that mono-sgen64 no longer jumps to the top of the list
CPU usage jumps far, far more when running this exercise (steps 5-7) in a much larger project:
This, again, only happens for me when working on classes implementing
IDisposable. This has been repeatable for a very long time for me, but I didn't take the time to collect information and steps until today. I've Googled quite a bit for IDisposable-related issues in this repo, IDisposable-related issues with Sgen in Mono, and with just VSCode, to no avail. Hopefully this can help move progress on resolving this in the right direction.Happy to provide any additional information or testing.

This is still an issue that 3 years passed.
 chinaq
on 22 Aug 2019
chinaq
on 22 Aug 2019
Unfortunately this seems to behave badly in both Visual Studio and Visual Studio Code. I hoped it was just an omnisharp issue, but looks like it is somewhere in Roslyn repo.
There is a slight difference tough - taking a random sample in omnisharp repo (MonoScriptGenerationProcess.Disposable()), omnisharp/vscode displays 32 references, and Visual Studio displays 23 references.
Both VS and VSCode crank up to the ~100% cpu usages when this gets recalculated, with a caveat that VS seems smarter about not recalculating this anytime something gets changed in that file.
I have no idea if listing every call to Disposable() everywhere is intentional or not (32 references?), seems pretty useless IMHO...
 SirIntruder
on 22 Aug 2019
SirIntruder
on 22 Aug 2019
We found that tweaking the C# extension for VSCode to ignore Dispose and GetEnumerator helped a lot. The issue still occurs though, seems to be more problematic more recently with no apparent reason.
 kruncher
on 17 Oct 2019
kruncher
on 17 Oct 2019
I have the same situation when building xUnit test projects when I have to add a fixture class that usually implements IDisposable :
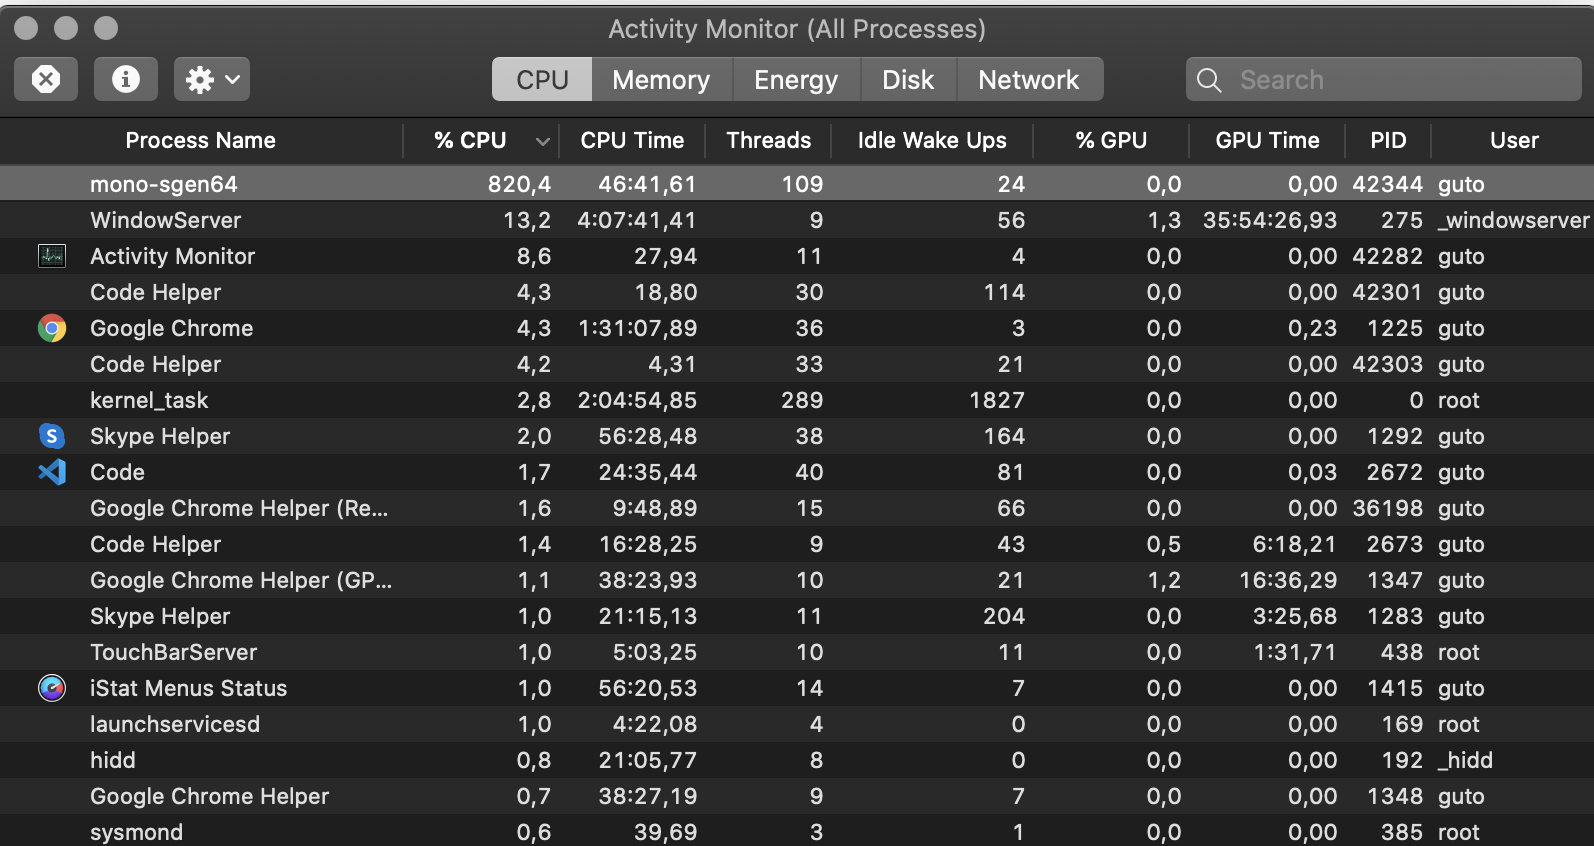
At:
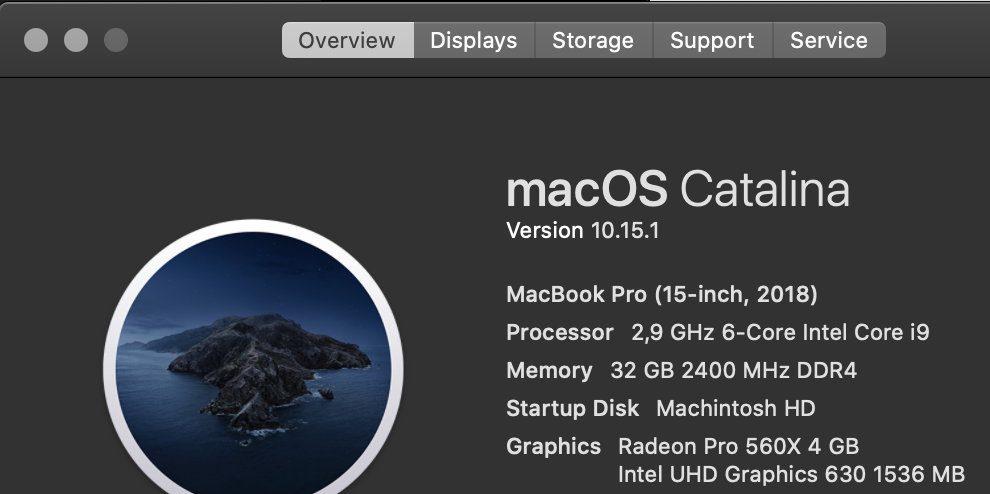
Using:


So... It is almost a 4yrs old issue... Is there a plan to attack this bug?
 galvesribeiro
on 1 Nov 2019
galvesribeiro
on 1 Nov 2019
Workaroud:
Try setting:
"csharp.referencesCodeLens.enabled": false

It will disable reference counting for IDisposable interface and hide x references info, but un-lag your computer.
 Ursanon
on 18 Dec 2019
Ursanon
on 18 Dec 2019
Also experiencing this bug, MacOS Catalina - Latest VSCode.
I disabled the CodeLens references - it makes it a little bit better - but the CodeLens feature is really useful!
Hope you'll finally fix it.
Thanks.
 yakeer
on 29 Dec 2019
yakeer
on 29 Dec 2019
Boom, same issue here! But I'm using Windows version of VSCode & OmniSharp, the latest version.
Tried to turn off CodeLens and it fixes the issue. But hopefully that could be fixed somehow.
 reckhou
on 3 Mar 2020
reckhou
on 3 Mar 2020
Yeah... sad to see we're entering the 5th year without a solution for that... C# is the major reason why people goes VSCode but it seem like there is not much attention to it... Sorry but disable CodeLenses is not a viable workaround... It works for other non-mainstream languages so there is no reason why it shouldn't work for the main one...
galvesribeiro
on 9 Mar 2020
Am observing exactly the same issue since several years while using omnisharp in VSCode, in Windows 10 and with several .net Core 2.1 Projects.
I already mentioned this issue in https://github.com/OmniSharp/omnisharp-vscode/issues/3079 as I thought it could be related to the omnisharp implementation in vscode, but it seems to be rather a general omnisharp roslyn problem.
As stated in the omnisharp vscode ticket the problem is really easily reproducible when editing a class that implements IDisposable with the CPU going directly to 100% utilisation. At the moment IDisposable is commented out or removed from the class the CPU usage goes quickly back to normal.
 mvalero
on 16 Mar 2020
mvalero
on 16 Mar 2020
Same issue here, Omnisharp eating up 7% CPU when idle after opening a ASP.NET Core project. I'm working on 3 different-sized projects here, and Omnisharp is consuming the same CPU share when idle regardless of project size.

 lynzrand
on 10 Sep 2020
lynzrand
on 10 Sep 2020
Related issues
 afterwind-io
·
6Comments
afterwind-io
·
6Comments
 gabomgp
·
3Comments
gabomgp
·
3Comments
 Nazeehe
·
3Comments
Nazeehe
·
3Comments
 Thaina
·
3Comments
Thaina
·
3Comments
 manishkp
·
7Comments
manishkp
·
7Comments
Most helpful comment
Yeah... sad to see we're entering the 5th year without a solution for that... C# is the major reason why people goes VSCode but it seem like there is not much attention to it... Sorry but disable CodeLenses is not a viable workaround... It works for other non-mainstream languages so there is no reason why it shouldn't work for the main one...