A recent update to oauth seems to have broken authentication for ldap intermittently.
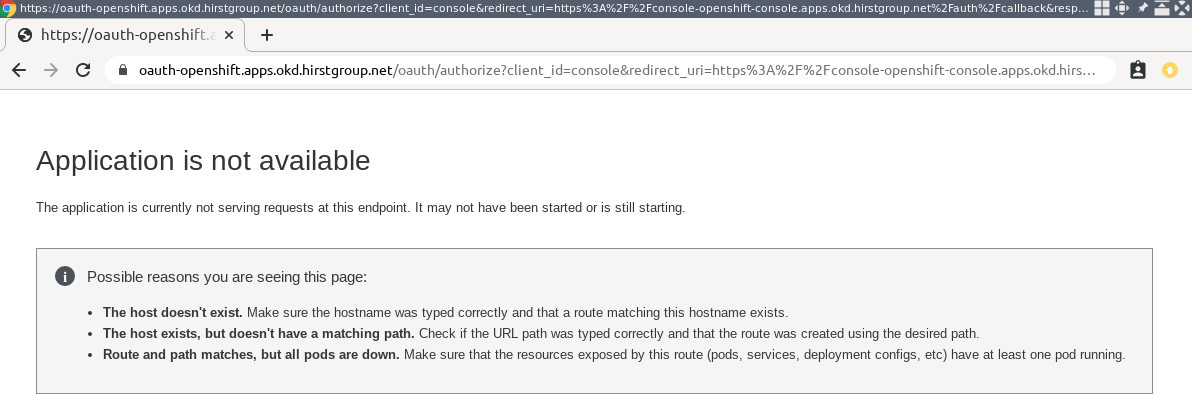
Authentication requests will work occasionally for LDAP however, it will often respond with a route Application is not available message.
oauth logs the following message:
I0205 16:07:59.472923 1 log.go:172] http: TLS handshake error from 10.10.6.1:40718: EOF
I'm not quite sure that this is the relevant log however. Has anybody else been able to setup LDAP authentication with the latest build (currently on 4.4.0-0.okd-2020-02-04-174205)?
 jdhirst
All 24 comments
@stlaz ^ I'm pretty sure that also affects OCP - do you know of any known issues with that?
oc adm must-gather might be helpful too
 vrutkovs
on 5 Feb 2020
jdhirst
on 5 Feb 2020
vrutkovs
on 5 Feb 2020
jdhirst
on 5 Feb 2020
@jdhirst1 that log is not relevant since you're not even using TLS in your configuration.
The logs you sent me capture the point of time where you've just configured the IdP correctly and the pods finally rolled out and were available, there is no login attempt captured in the oauth-server logs.
The oauth-server pods might be unavailable for a brief moment if you're changing configuration all the time but no service blips should happen once your configuration gets stable.
Btw - you probably realized that, but your OIDC IdP was running within a wrong domain, which is why your previous config did not work - x509: certificate is valid for *.apps.okd.hirstgroup.net, *.okd.hirstgroup.net, not sso.hirstgroup.net. If it's kerberos-based SSO, you may want to consider trying the RequestHeader IdP, you'd need a login proxy for that, though.
 stlaz
on 6 Feb 2020
stlaz
on 6 Feb 2020
That TLS errors seems to be related to an issue with the on-site DNS server rather than a configuration issue.
Sticking to LDAP for this issue, I have tested again and don't see the "Application is not available" events being logged; where would I see them?
LDAP auth seems to be very much still intermittent. It seems to work around 50% of the time.
It seems to be that oauth service is seen as unavailable for some reason, it isn't simply failing LDAP authentication against my LDAP server. Also, it is interesting to note that CLI login never fails, only web.
New must-gather: https://0x0.st/iiTQ.gz
jdhirst
on 6 Feb 2020
Ok, I can see what's going on now. When you look at the older must-gather you sent me, specifically the kubelet logs, you'll see that the oauth-server pods get OOM killed every now and then:
2536580 Feb 05 15:11:23 master-0.okd.hirstgroup.net hyperkube[2829]: I0205 15:11:23.301978 2829 status_manager.go:569] Status for pod "oauth-openshift-5c8bc9cd8f-gptl7_openshift-authentication(c6de17c5-ca14-44df-9964-f005fd9ab32c)" updated successfully: (7, {Phase:Running Conditions:[{Type:Initialized Status:True LastProbeTime:0001-01-01 00:00:00 +0000 UTC LastTransitionTime:20 20-02-05 15:08:45 +0000 UTC Reason: Message:} {Type:Ready Status:False LastProbeTime:0001-01-01 00:00:00 +0000 UTC LastTransitionTime:2020-02-05 15:11:23 +0000 UTC Reason:ContainersNotReady Message:containers with unready status: [oauth-openshift]} {Type:ContainersReady Status:False LastProbeTime:0001-01-01 00:00:00 +0000 UTC LastTransitionTime:2020-02-05 15:11:23 +0000 UT C Reason:ContainersNotReady Message:containers with unready status: [oauth-openshift]} {Type:PodScheduled Status:True LastProbeTime:0001-01-01 00:00:00 +0000 UTC LastTransitionTime:2020-02-05 15:08:45 +0000 UTC Reason: Message:}] Message: Reason: NominatedNodeName: HostIP:172.16.20.20 PodIP:10.10.0.89 PodIPs:[{IP:10.10.0.89}] StartTime:2020-02-05 15:08:45 +0000 UTC InitCon tainerStatuses:[] ContainerStatuses:[{Name:oauth-openshift State:{Waiting:nil Running:nil Terminated:&ContainerStateTerminated{ExitCode:0,Signal:0,Reason:OOMKilled,Message:,StartedAt:2020-02-05 15:08:54 +0000 UTC,FinishedAt:2020-02-05 15:11:22 +0000 UTC,ContainerID:cri-o://fddf957996403a75bdcbac011a3977222f92df3cee703a60c78cd344d7eb2924,}} LastTerminationState:{Waiting:nil Running:nil Terminated:nil} Ready:false RestartCount:0 Image:registry.svc.ci.openshift.org/origin/4.4-2020-02-04-174205@sha256:4fe138264173ad5278563564e9c8a8a0bc9f8eb553216d74582099525e0ea0f5 ImageID:registry.svc.ci.openshift.org/origin/4.4-2020-02-04-174205@sha256:4fe138264173ad5278563564e9c8a8a0bc9f8eb553216d74582099525e0ea0f5 ContainerID:cri-o://fddf957996403a75bdcbac0 11a3977222f92df3cee703a60c78cd344d7eb2924 Started:0xc00352ae90}] QOSClass:Burstable EphemeralContainerStatuses:[]})
The newer logs contain messages of the scheduler being killed, that's probably even worse.
That also explains why CLI works for you all the time - no need to load HTML pages into memory, so the pod does not get killed.
stlaz
on 7 Feb 2020
top shows that the systems themselves aren't running OOM; is it the resource constraints of the pods themselves? If so, that sounds like a bug
jdhirst
on 7 Feb 2020
It could be that the requested memory is too low. Do you think you could observe their memory consumption during login, in, say, grafana, or by watching the oc adm top pod -n openshift-authentication? In my clusters, the oauth-servers don't usually eat more than 25MB memory, which is about 50% of what they should have assigned.
stlaz
on 7 Feb 2020
Hm, it seems this may not be the issue after all, as the error page shows up while memory usage doesn't change:
Prior to test:
➜  ~ oc adm top pod -n openshift-authentication
NAME                               CPU(cores)   MEMORY(bytes)
oauth-openshift-549f554799-6rq7n   2m           25Mi
oauth-openshift-549f554799-vtkwv   3m           30Mi
After error page shows up:
➜  ~ oc adm top pod -n openshift-authentication
NAME                               CPU(cores)   MEMORY(bytes)
oauth-openshift-549f554799-6rq7n   2m           25Mi
oauth-openshift-549f554799-vtkwv   3m           30Mi
Did the login attempt trigger the bug you observed before?
stlaz
on 7 Feb 2020
I just reproduced the issue and dumped live log output for all 3 nodes' kubelet services into log files. So this should atleast make the haystack smaller.
jdhirst
on 7 Feb 2020
The oauth-server pods should be running on the master nodes
stlaz
on 7 Feb 2020
They are, idk why I called those files worker lol; brain was not with me today!
jdhirst
on 7 Feb 2020
The logs of master-1 indicate that both the oauth-openshift and multus (SDN) pods are being recreated (it seems that they being killed was just a little bit earlier than what the logs show). Both these could cause the 503. I am not sure I am able to help as in why they were killed though.
cc @openshift/openshift-team-runtimes maybe?
stlaz
on 7 Feb 2020
I experience the same issue - the oauth-openshift endpoint doesn't work around 50% of the time. I installed with UPI using the latest build from yesterday and had the issue with two different installations.
 niiku
on 9 Mar 2020
niiku
on 9 Mar 2020
My current workaround to fix this issue is to set .spec.tls.termination in the oauth-openshift Route to reencrypt instead of passthrough. To prevent the openshift-authentication-operator to revert this change I set its .spec.managementState to Unmanaged.
oc patch authentications.operator.openshift.io/cluster --type='merge' -p='{"spec":{"managementState":"Unmanaged"}}' -n openshift-authentication
oc patch route -n openshift-authentication oauth-openshift --type='merge' -p '{"spec":{"tls":{"termination":"reencrypt"}}}'
I checked the SDN/Multus/Ingress/Kube-API Pods and it's Operators. There's no direct log when the "Application is not available" site appears. There're no restarts of Pods because of OOM or similar.
For testing reasons, I scaled the ingress and oauth-openshift deployments to one replica and placed them on the same worker node. What's very interesting is that https://oauth-openshift.apps.okd.domain.tld is always callable via cURL - the issue only appears in the browser but only sometimes (felt 50%+ of the times) - then it's very persistent in that browser session. When using private mode or a different browser sometimes it works. So maybe the browser cache/cookies might be part of the issue.
My current speculation based on the fact that changing the Route from passthrough to reencrypt is that the HAProxy Ingress sometimes has an issue with traffc from the oauth-openshift pods. I didn't figure out yet how I can set the log level to debug for the HAProxy Ingress instance but I guess there could be more informations found (any tips?). I also verified that the v4-0-config-system-router-certs Secret has the valid fullchain cert and key (Let's Encrypt and valid).
Used OKD version is 4.4.0-0.okd-2020-03-10-052608.
niiku
on 11 Mar 2020
I am seeing this same issue running a fresh install of version 4.4.0-0.okd-2020-04-21-163702-beta4. I will note that we are running UPI in AWS GovCloud.
Something I have noticed is that a hard refresh from the browser always seems to get a working connection. In my tests I can refresh multiple times with the 'Application is not available' page and as soon as I do a ctrl+f5 hard refresh it comes up. This is using Firefox 76.0.1
A regular refresh has Header:
Cache-Control: max-age=0
A hard refresh has Header:
Cache-Control: no-cache
Pragma: no-cache
 jmeth
on 23 May 2020
jmeth
on 23 May 2020
Are you using an installer-generated certificate or a custom one for the
default ingress?
(I've got the same issue btw).
On Sat, May 23, 2020 at 12:32 AM Josh notifications@github.com wrote:
I am seeing this same issue running a fresh install of version
4.4.0-0.okd-2020-04-21-163702-beta4. I will note that we are running UPI
in AWS GovCloud.Something I have noticed is that a hard refresh from the browser always
seems to get a working connection. In my tests I can refresh multiple times
with the 'Application is not available' page and as soon as I do a ctrl+f5
hard refresh it comes up. This is using Firefox 76.0.1A regular refresh has Header:
Cache-Control: max-age=0A hard refresh has Header:
Cache-Control: no-cache
Pragma: no-cache—
You are receiving this because you are subscribed to this thread.
Reply to this email directly, view it on GitHub
https://github.com/openshift/okd/issues/72#issuecomment-632933115, or
unsubscribe
https://github.com/notifications/unsubscribe-auth/ABCFTFDW4CZDRVW4OKNYC23RS34OFANCNFSM4KQOD6NA
.
 agno01
on 23 May 2020
agno01
on 23 May 2020
I am using the installer generated certificate.
FYI I have not seen this issue since upgrading to 4.4-beta5 so hopefully it's been resolved but I haven't had a chance to do a clean install or anything and verify it was the upgrade and not something I had changed.
jmeth
on 11 Jun 2020
We've seen similar issues when HTTP2 was enabled in routes, so this got disabled in HAProxy. The issue would appear when you attempt to login from other services, like the console, that redirects you to the oauth-server. In that case, oauth-server would not be accessible in your browser for some 30 or 40 seconds (the timeout of HTTP2 connection cache of your browser), but you would be able to get to the page after this time (note that you can't refresh the page before the timeout).
The reason for this is the HTTP2 connection caching and how certificates are set up, the browser gets confused and attempts to reuse the same connection for different hosts.
I don't know why anyone would turn HTTP2 on in okd install payloads when we specifically need to have it turned off, but if you're able to reproduce the issue with the 30-40s workaround, this might be the cause.
I'll try to see if I can find anyone from OKD who might know more.
stlaz
on 16 Jun 2020
we're using exactly the same router images, it cannot be turned on or off - unless maybe custom LB uses http/2 by default?
vrutkovs
on 16 Jun 2020
Issues go stale after 90d of inactivity.
Mark the issue as fresh by commenting /remove-lifecycle stale.
Stale issues rot after an additional 30d of inactivity and eventually close.
Exclude this issue from closing by commenting /lifecycle frozen.
If this issue is safe to close now please do so with /close.
/lifecycle stale
 openshift-bot
on 21 Oct 2020
openshift-bot
on 21 Oct 2020
Stale issues rot after 30d of inactivity.
Mark the issue as fresh by commenting /remove-lifecycle rotten.
Rotten issues close after an additional 30d of inactivity.
Exclude this issue from closing by commenting /lifecycle frozen.
If this issue is safe to close now please do so with /close.
/lifecycle rotten
/remove-lifecycle stale
openshift-bot
on 20 Nov 2020
Since I've used OKD 4.5 I never came around this issue again - so I guess it got resolved in the meantime
niiku
on 20 Nov 2020
Thanks @niiku
I'll close this for now. If anybody hit's this again, please add a message here or simply open a new issue.
 LorbusChris
on 20 Nov 2020
LorbusChris
on 20 Nov 2020
Related issues
vrutkovs
·
12Comments
 kai-uwe-rommel
·
12Comments
kai-uwe-rommel
·
12Comments
 mkelnermishal
·
9Comments
mkelnermishal
·
9Comments
 andygeorge
·
7Comments
andygeorge
·
7Comments
 kkk25641463
·
5Comments
kkk25641463
·
5Comments