Octoprint: small corners dont print smoothly (raspberry pi)
Hi,
I have had a couple of gear prints that fail get bad print results when using OcotPrint. The same gcode in repetier via a pc works perfectly without any small stops or hesitations in the movement.
This is one of the gears in thing:243278

example images of full print from pc/repetier vs stopped print OcotPrint.

A video of the problem. Long straight or circles work without any problems but a few seconds in when it prints the "gears" it starts to stop mid movement.
https://www.youtube.com/watch?v=tbUntyq7djY
The log from the heart gear print
https://gist.github.com/LangBalthazar/11037683
The gcode from the heart gear print:
https://gist.github.com/LangBalthazar/11037928
I am running Branch: devel, Commit: bf9d5efe43a1e57aacd8512125082ddca06b4efc
I have done a update and upgrade (so the pyserial should be 2.7 and work on baud 250000, correct or could this be my problem?) My printer is a Velleman K8200 / 3drag.
Any ideas on why this happens when printing from octoprint?
Best regards
Balthazar Lang
 LangBalthazar
All 163 comments
You are printing from the Pi, right? You might simply crash against it's
limitations there. For toolpaths with a lot of small lines (e.g. lots of
rounds and direction changes, as in gears) you will have a lot of gcode
lines generated, each only moving the head a tiny fraction. Now, all those
lines of gcode need to be transfered to the printer, and that quite fast.
On a regular work pc, you won't run into problems here. On a pi though,
transfer plus house keeping can be too much. Personally, I've taken to
doing prints like that from SD instead of streaming them via USB. Serial
communication is a bottleneck. Printing slower might help.
 foosel
on 18 Apr 2014
foosel
on 18 Apr 2014
It might be better than just stating that raspi might be too slow, then maybe Octoprint can detect that it is falling behind, and report an warning or such.
 CptanPanic
on 9 May 2014
CptanPanic
on 9 May 2014
Suggestions on how to do this (without making the whole processing even
slower) are welcome
foosel
on 9 May 2014
First suggestion is you could (while anaylsing the gcode), try to detect Perimeter Movements, e.g. by Speed, and check if there are many "small" movements after each other. Just one suggestion, I believe if I think that further I'll find a few more ways to check that.
 Salandora
on 10 May 2014
Salandora
on 10 May 2014
If the errors are happening because the processor gets too loaded, maybe just having a graph showing the processor utilization?
CptanPanic
on 10 May 2014
Hello,
I had an idea about speeding up the whole Analysis Process and even detecting for small movements... I don*t know if it's a good idea so i post it before doing any programming.
Idea:
Do the analysis in the browser before uploading everything to Octoprint.
e.g.: I want to upload File XY, i drop it onto the Browser, now a Javascript Gcode Analyser will process the whole file, sending all necessary informations with the file (as a comment or JSON-Data), Octoprint wouldn't need to do anything anymore.
If you notice areas with many small movements you could inject a Gcode to slow things down, make a Comment, or warn the uploader.
Salandora
on 12 May 2014
The problem I have with this approach is that it's moving too much of the core work over to the client. This is critical due to two reasons.
- Never trust the client
- My guess is that this would make uploading from a mobile device or remotely (think: cloud slicer) way more complicated/close to impossible.
IMHO the gcode analysis should be the server's responsibility (and right now it doesn't add much anyways besides some stats, which is why it's done asynchronously and should never be done when printing), as should be anything to do with file processing.
Recognizing small movements might be possible on the fly during printing, so we could display a warning in such a case. What I want to prevent though is adding even more detection code and stuff in the send loop that will put even more strain on the poor CPU and make serial communication even more fiddly (which it already is anyways thanks to the protocol), which is why I'm quite reluctant to add large "am I slow now?" detection mechanisms in there. This is also the reason for my backtalk above ;)
I'm not even sure if a software solution is the best approach here to be honest (due to the serial bottleneck and also the fact that as said above, anything done in Software will only put more strain on the system). A small part of me is rather thinking in the direction of emulated SD card attachments connected via hi-speed-USB to the host.
In any case, at the current state it's a non trivial issue.
foosel
on 14 May 2014
anyway to compress gcode before sending it over the wire ?
 vdesmedt
on 22 May 2014
vdesmedt
on 22 May 2014
Does this problem still occur in OctoPrint 1.2.x? I backported a lot of the fixes I did on the commRefactoring branch (which sadly proofed after a lot of work on it to be unviable), so the problem shouldn't exist as much anymore (although the serial line will still always be a bottleneck the smaller the segments get, there's nothing I can do about that).
foosel
on 15 Feb 2016
I have been bit by this as well.
I made a small g-code file, only containing a few G0 commands and tried to have octoprint(1.2.9) send it to marlin over raspi serial (the one on the GPIO) at 250000 baud.
I then hooked up a LSA to RX and TX and measured time between "ok" and the next "G0" command: approx 10ms.
So octoprint seems to be busy doing stuff for 10ms between each command getting sent. seems to me like a place to look for some improvements. If I make file long enough octoprint maxes the raspi to 100% CPU load.
First place to look could be disabling terminal logging during prints. (i tried with a filter, but it did not help much)
 MortenGuldager
on 26 Feb 2016
MortenGuldager
on 26 Feb 2016
The firmware should buffer up G0 commands, so unless you are trying to print more than 100 line segments per second you shouldn't notice. What speed are you printing at and how short are your line segments during a curve?
 nophead
on 26 Feb 2016
nophead
on 26 Feb 2016
The test data mentioned is crafted only track down where the bottlenecks are. No real printing going on here. But if I make small enough curve segments it will exhaust the buffer in the firmware. I'm pointing out that the send loop isn't particular fast, which I think I read some of the comments above to confirm as well.
MortenGuldager
on 26 Feb 2016
Well yes it will always be possible to exhaust the buffer with a finite comms speed, but is 10ms a problem in a practical sense? It doesn't seem to affect my prints but then I don't print segments shorter than my filament width.
nophead
on 26 Feb 2016
Perhaps I should explain why I came across this in the first place. I was wondering why upload to sd card takes to long. And here I more or less constantly see a 6.6ms delay from previous "ok" till next line starts transmitting.
Sorry for trying to make the example simpler when all that it did was to confuse you guys.
MortenGuldager
on 26 Feb 2016
So I thought I would investigate this but I can't get upload to SD to work at all with Version: 1.2.9 (master branch). The log just says octoprint.filemanager.analysis - INFO - Starting analysis of local:cal.gco and that is it. It never sends anything to the serial port.
Does this work for anybody else?
nophead
on 27 Feb 2016
There is a bug with sd uploads in 1.2.9 that I already have fixed on the
maintenance branch, but I got sick before I could release that and since
then it has been on hold. See #1224
foosel
on 27 Feb 2016
OK I downgraded to 1.2.8 using your instructions. The sudo service octoprint restart did not find a service but a manual reboot worked.
The delay from OK to the next line is 16ms on my RPI B. Marlin only takes about 0.68ms to process the line and reply with OK. The line takes 5.3ms to send so it could potentially run a lot faster.
nophead
on 27 Feb 2016
I agree, there's something up here.
@MortenGuldager also pinged me on another channel and suggested he'd open a new ticket for that. He observed a significant performance drop between 1.2.2 and 1.2.9 so it definitely looks like there was some issue introduced somewhere between those versions. For this a new ticket indeed might be better (specific issue introduced through a code change somewhere).
It's actually a perfect timing now since the 1.2.10 has gotten delayed anyhow, this way that could contain another valuable fix if we figure this out. I have to admit, I'm unsure how to best measure this stuff (not sure my cheap logic analyser is up to that actually) and I'm still not fit again, so any help from you two in that matter is welcome to get that ironed out as fast as possible.
foosel
on 27 Feb 2016
I measured it with an extremely cheap Chinese clone of a Saleae logic analyser. Although I do have much better equipment that was the easiest to attach to the machine in my garage that uses ttyAMA0 at 115200, rather than USB at 250000. A long time ago I found that faster for SD upload but I can't remember if that was an early OctoPrint or Pronterface.

The next step I will try is 1.2.2. To get further it might be necessary to use a Python profiler. Or I could add code to pulse GPIO lines at specific points in the code as I have six more channels on this device.
nophead
on 27 Feb 2016
my fault. perhaps not the latest octopi. The "fast" one reports Version: 1.1.1-30-g4fede5a (master branch)
and the img file I loaded on the RPI sd was 2015-01-31-octopi-0.11.0.img
MortenGuldager
on 28 Feb 2016
That is bad then, because 1.1.1 contained bugs in the comm layer that could basically ruin prints under the right conditions (race conditions in resend handling and overrunning the firmware's receive buffer) that the big rework in 1.2.x solved. So no going back to the old version without basically breaking everything left and right again for a lot of people.
There are still points in the code where I could imagine there are optimization possibilities though.
foosel
on 28 Feb 2016
well, lets leave it as it is here. I will look into other ways for speed-uploading and eventually make a feature request for a faster serial communication.
Sorry for the fuss I stirred up.
MortenGuldager
on 28 Feb 2016
I found I had the serial log enabled. Turning that off reduces the latency to just over 9ms, so similar to @MortenGuldager's finding. If the latency was zero it would go nearly three times faster.
nophead
on 28 Feb 2016
The sd upload via serial is more like a hobbled wheel anyhow. Even if you blast at full serial rate, a large file still takes ages. I've recently been rather experimenting with FlashAir (sd card with built in Wi-Fi) and that looks like a way less annoying approach.
I'll still take another look at the current code though once I'm back on my feet, your mention of a Saleae clone reminded me that I have a ScanaPlus that might be able to help after all.
foosel
on 28 Feb 2016
After the file is upload OctoPrint seems to get into a strange state where it doesn't send anything. I have to disconnect and reconnect. The final comms looks like this:
Send: N33708 M84 X Y E*116
Recv: ok
Send: N33709 M29*22
Changing monitoring state from 'Printing' to 'Operational'
Recv: Done saving file.
Then nothing sent until I disconnect and reconnect. It will display output from the machine, for example if I reset it but won't send anything, even from the send button.
I have noticed this happen a lot since I updated from an old version. I am using /dev/ttyAMA0, which unlike USB is connectionless, so previously I could even power off the machine and power it back on again and OctoPrint wouldn't care.
Nothing suspicious in the log, just a couple of warnings that don't look related to comms.
2016-02-28 10:17:25,789 - py.warnings - WARNING - /home/pi/oprint/local/lib/python2.7/site-packages/requests-2.7.0-py2.7.egg/requests/packages/urllib3/util/ssl_.py:90: InsecurePlatformWarning: A true SSLContext object is not available. This prevents urllib3 from configuring SSL appropriately and may cause certain SSL connections to fail. For more information, see https://urllib3.readthedocs.org/en/latest/security.html#insecureplatformwarning.
  InsecurePlatformWarning
and
2016-02-28 10:23:13,179 - octoprint.server.util.sockjs - WARNING - Could not send message to client 192.168.1.97: object of type 'NoneType' has no len()
Is it perhaps because Marlin doesn't send an OK after Done saving file.?
nophead
on 28 Feb 2016
Exactly. Another lovely Marlin bug.
foosel
on 28 Feb 2016
You can get stuff going again with the fake ack button in the terminal advanced options. I thought I'd also built in a work around for that recently, might mistake it for another Marlin bug though. They do like to forget their ok here and there.
foosel
on 28 Feb 2016
I seem to be in bug city now. I can get things moving with a fake acc but I don't seem to be able to reset the line numbers. M110 on its own seems to do nothing and M110 N0 gives:-
Recv: Error:No Checksum with line number, Last Line: 33709
Recv: Resend: 33710
What is supposed to happen here? How did it work before I updated OctoPrint?
The last time I looked at FlashAir it seemed to create its own network access point rather than joining an existing network so I didn't see how it could be useful
nophead
on 28 Feb 2016
It did work before because OctoPrint didn't care about missing oks in the old version, leading to the problems I described above since it just kept sending then even if the firmware didn't report readiness to receive. Solving this leads to problems with buggy firmware which doesn't signal it's ready to receive in all such cases where it actually is (hello marlin), so basically doing it right on the host side makes firmware issues better observable.
Just from the two lines up there I'd suggest to send an M110 with line number and checksum. Marlin doesn't accept just a line number without a checksum and older versions have a bug where they interpret an N parameter to an otherwise line number less command as the prefixed line number and then fall flat on their faces when the line turns out to not be checksummed (because it always had to be both line number and checksum together). So basically your Marlin version is seeing "M110 N0" as if it were "N0 M110" where it would expect "N0 M110*checksum" (sorry, I don't have the checksum at hand right now), so it complains about having received a line number without checksum and wants a resend. Cute, isn't it? Oh, and I've also seen flavors which didn't accept an N parameter to M110 but demanded M110 to be sent with line number and checksum to do anything. So there's some attempt in OctoPrint to take care of that case too, I can't remember right now under which circumstances that holds, could also be at fault here.
I don't know why a regular M110 refuses to work though, are you still in state streaming/printing or operational again?
Did I mention that I hate how all those various firmware versions that are out there are riddled with horrible bugs and how hard it is to write code that tries to not have everything crash and burn regardless of if they are present or not?
foosel
on 28 Feb 2016
dunno if it is intended, but sometimes 1.2.9, when uploading to sdcard, have more than one line outstanding, and then marlin will soon respond with two OK's in a row. seen both in terminal tab and with my LSA (which of course is a Chinese Saleae clone)
Send: M28 /small.gco
Recv: echo:Now fresh file: /small.gco
Recv: Writing to file: /small.gco
Changing monitoring state from 'Operational' to 'Sending file to SD'
Recv: ok
Send: N15 G1 X0.001*75
Send: N16 G1 X0.002*75
Recv: ok
Send: N17 G1 X0.003*75
Recv: ok
Send: N18 G1 X0.004*67
Recv: ok
Send: N19 G1 X0.005*67
Recv: ok
Send: N20 M29*42
Changing monitoring state from 'Printing' to 'Operational'
Recv: ok
Send: M20
Recv: Done saving file.
N15 and N16 are output really quick after each other, only 1.86ms in between, much faster than octoprint usually output commands.
MortenGuldager
on 28 Feb 2016
Looking at the source to the version of Marlin I am using M110 on its own is a NOP. The only mention of M110 is it suppresses the line number check. So by side effect sending M110 with a line number and checksum will change the next expected line number. There is no explicit handler for M110 though.
I note that OctoPrint now sends naked M110 at the beginning. Is that intended as a NOP or is it intended to reset the line counter?
Does OctoPrint expect the line counter to go up forever or does it expect to reset it for each file?
I can easily fix up my Marlin to match what OctoPrint expects I just need to know what that is.
nophead
on 28 Feb 2016
At the beginning of a connection M110 is expected to be a nop (if there was something like an actual nop, I'd send it there, all I want to do is to get the firmware to respond with something recognizable to make sure it's a printer and not a coffee machine). Although for firmwares that require line numbers to be always used (default config for repetier afaik) it also resets the number if the corresponding flag is set, which is important in cases where establishing a serial connection does not also reset the printer firmware. So welcome side effect under certain scenarios, don't care in others.
First line of an actually printed file should be a checksummed M110 to reset to 0. I've thought about doing regular resets over the course of printing to not exceed firmware side line number restrictions (uint32 I think?), but that might break resends in scenarios where commands are not acknowledged in the order they are sent (another firmware issue) and hence is tricky to get right.
About the two ok's, that would be interesting to get a log of, but it depends on which firmware version (order of command acknowledgement), read buffer, planner buffer, previous commands, command order, etc.
In general, what the protocol should do is, when I send it a command, process that (in case of G0 through G4 that means put it into the planner buffer if there's space, in case of other stuff do whatever it does, produce output) and then acknowledged with "ok". If there's a line number and checksum present, that should be checked before that processing step if the number is in sequence and the checksum matches and if not a resend line should be sent instead of processing the line and the input buffer flushed.
What's the situation instead is that on some firmware versions G0 through G4 get ok'd as soon as they are parsed from the serial input buffer but before they are processed, so their ok can over take commands that were preceding them, some answers lack an ok and the resend request includes an ok though it shouldn't, other firmware continuous sending resend requests several times to make sure they arrive, others don't flush their input on a resend and keep getting confused by whatever else was still in the buffer, some firmwares send "wait" every second if the planner buffer runs dry, others just don't do anything, yet others can cope with having the serial buffer getting full and just block writing whereas other implementations crash in such cases...
... If you two don't mind, I think I need to take a break here, I'm seeing red again ;)
foosel
on 28 Feb 2016
OK, I can see how frustrating this must be for you. It winds me up and I am
only dealing with one version of Marlin at a time and don't have any comms
errors that need to be handled.
One last clarification though please: are you saying that I should put M110
at the start of my gcode files now?
I will go back to the latest release and do the patch to make uploads work
and I will patch Marlin to make M29 send OK.
On 28 February 2016 at 14:44, Gina Häußge [email protected] wrote:
At the beginning of a connection M110 is expected to be a nop (if there
was something like an actual nop, I'd send it there, all I want to do is to
get the firmware to respond with something recognizable to make sure it's a
printer and not a coffee machine). Although for firmwares that require line
numbers to be always used (default config for repetier afaik) it also
resets the number if the corresponding flag is set, which is important in
cases where establishing a serial connection does not also reset the
printer firmware. So welcome side effect under certain scenarios, don't
care in others.First line of an actually printed file should be a checksummed M110 to
reset to 0. I've thought about doing regular resets over the course of
printing to not exceed firmware side line number restrictions (uint32 I
think?), but that might break resends in scenarios where commands are not
acknowledged in the order they are sent (another firmware issue) and henceis tricky to get right.
About the two ok's, that would be interesting to get a log of, but it
depends on which firmware version (order of command acknowledgement), read
buffer, planner buffer, previous commands, command order, etc.In general, what the protocol should do is, when I send it a command,
process that (in case of G0 through G4 that means put it into the planner
buffer if there's space, in case of other stuff do whatever it does,
produce output) and then acknowledged with "ok". If there's a line number
and checksum present, that should be checked before that processing step if
the number is in sequence and the checksum matches and if not a resend line
should be sent instead of processing the line and the input buffer flushed.What's the situation instead is that on some firmware versions G0 through
G4 get ok'd as soon as they are parsed from the serial input buffer but
before they are processed, so their ok can over take commands that were
preceding them, some answers lack an ok and the resend request includes an
ok though it shouldn't, other firmware continuous sending resend requests
several times to make sure they arrive, others don't flush their input on a
resend and keep getting confused by whatever else was still in the buffer,
some firmwares send "wait" every second if the planner buffer runs dry,
others just don't do anything, yet others can cope with having the serial
buffer getting full and just block writing whereas other implementations
crash in such cases...... If you two don't mind, I think I need to take a break here, I'm seeing
red again ;)—
Reply to this email directly or view it on GitHub
https://github.com/foosel/OctoPrint/issues/450#issuecomment-189885040.
nophead
on 28 Feb 2016
Sorry, I was unclear there. The first line OctoPrint should send from a printed file should be M110. OctoPrint basically injects that before it returns the actual file lines. I wrote should there since I'm currently unsure about the exact logic in place, I'm fairly sure it will force that with a checksum, but I can't check right now (phone's browser doesn't like github file listings with syntax highlighting at all, always crashes on anything with more than a few hundred lines).
I also fixed a bunch of typos and clarified some things in my last reply after I posted it, so if you are following this thread via mail, maybe take another look at that in the ticket.
foosel
on 28 Feb 2016
So I patched 1.2.9 with the fix in devel and it uploads to SD OK without any change to Marlin. It isn't missing the OK at the end any more but the OKs do seem out of step. I think perhaps OctoPrint doesn't wait for one from M28 but gets one, so there is always an extra OK kicking about so it doesn't get stuck at the end.
Here is a log of a small transfer. I have added line numbers to the OKs manually and it seems to bear out my theory. Marlin M28 sends OK but OctoPrint doesn't expect it and M29 doesn't send OK but OctoPrint does expect it.
The extra OK during the upload might actually be beneficial because it makes OctoPrint send the next line early. It works because Marlin can buffer the next line while processing a command.
OctoPrint sends M110 N0 to start a print over serial but it doesn't when it does an SD upload, so the numbers just continue on up. This goes wrong if host or printer are reset.
nophead
on 28 Feb 2016
Ah... then it was M28 for which there is a workaround in place, and your version doesn't have that firmware bug yet or anymore, but on the other hand has the M29 issue and that indeed cancels out each other.
I can't send the M110 when it already has sent the M28 since that would have it become part of the file on the sd (I'm unsure what consequences that would have, might be that it would have the printer reset line numbers "on its own" when the file is printed, without the host being able to know that, bad thing). But I should probably force a checksummed M110 before the M28.
foosel
on 28 Feb 2016
I might be wrong but as far as I can see Marlin's behaviour hasn't changed over the lifetime of OctoPrint. M28 is a normal command and is encountered in command mode so it sends an OK using the default mechanism.
M29 is sent during streaming so is not executed but a special case check is made to allow it to terminate the stream (otherwise it would get written to the card). See https://github.com/MarlinFirmware/Marlin/blob/RC/Marlin/Marlin_main.cpp#L749. That is why it doesn't send an OK. It does if you send it when not in stream mode, but then it is just a NOP, see https://github.com/MarlinFirmware/Marlin/blob/RC/Marlin/Marlin_main.cpp#L3415.
nophead
on 29 Feb 2016
I'm fairly sure I've seen it send an ok in the past (I've gotten a bit sensitive when it comes to missing oks over the past year or so), but that might have been some non-mainline-form of Marlin or even some other firmware.
In any case, even if it's handled before the actual command handling, it should still send an ok.
Of course, since it's so wide spread, it's basically impossible to eradicate this bug at this point, even if mainline Main gets that patched up, so I guess I need yet another special case here. Hooray.
Btw, having to check for stuff like that also makes the code slower. Still thinking that moving the ok handling to a point as early as possible into the read loop should give a nice boost (right now it's at the bottom, that's stupid), so that's the current battle plan.
foosel
on 29 Feb 2016
Yes there no reason why G29 couldn't send OK but it seems it has always just sent "Done saving file" instead, so perhaps that is the de-facto protocol.
Am I correct in thinking it is this line: https://github.com/foosel/OctoPrint/blob/master/src/octoprint/util/comm.py#L1048 that makes OctoPrint not wait for ok after M28? Should that just be moved to here: https://github.com/foosel/OctoPrint/blob/master/src/octoprint/util/comm.py#L1067 to make it not wait for one after "Done saving file" instead?
I will have a look at the effect on timing later today. As I said before the extra OK during the transfer probably speeds it up and any optimisation you do by moving the ok handling up the loop will not beat sending the command before getting the OK for the last one as it does now.
I am surprised a few lines of Python code can eat up 10ms. Are we sure is not accessing SD files somewhere? Turning on logging seems to add only another 6ms.
nophead
on 29 Feb 2016
I clarified the last comment so if you are following this thread via mail take another look at it in the ticket.
nophead
on 29 Feb 2016
I'm not sure that the clear_to_send should actually be removed there vs. just replicated in the M29 handling. I probably added it for a reason there (searching for the history), and I'm suspecting that it was some firmware that lacked the ok. Which makes things tricky now since it basically gets the ok count out of sync depending on the firmware. Which sucks. I started working on another attempt at a better abstracted comm layer at the beginning of the year, that also includes firmware flavor specific handling of stuff like that. Learning from past mistakes ;)
In general having an extra ok in the loop is something that should be avoided. Yes, it can speed things up if the buffer can cope with it, but it can also kill the firmware quite good depending on the board, the version etc. I've seen this happening in the past (especially printrboards appear to like locking up for a couple of seconds if they get too much stuff on the serial, and I'm not meaning that in a "they don't accept commands anymore" kinda way, which would be ok, but in a "the whole CPU seems to just stop working" kinda way. Not a hardware person, no idea what's going on there, but that's what I've seen. So I'm a bit reluctant to add that generally. But I'm also unhappy with having to add loads of new flags all the time to cope with different firmware implementations and their various bugs and differences.
In this specific case it might make sense to introduce something like a configurable "answers from the firmware that lack an ok" setting. That would allow to add or remove whatever the user's firmware does or doesn't have with regards to bugged responses there and be done with it hopefully. But it's still hackish and ugly. Meh.
Also, I might have been unclear in my last post. I don't think that the full 10ms come from just the location of the ok parsing. I'm thinking though that some fraction of it does, and that there are several places across the code here that add up to 10ms.
I also have to take another look at the PySerial docs to see if flush should maybe actually be called on the serial object after each write, or if that is a no-op in the current implementation.
Finally, there might be some issue with locks interfering here which is tremendously tricky to get a) diagnosed and b) debugged. So the idea was to first get the obvious idiocies out of the code before moving on to the more difficult stuff, to ensure the trivial stuff isn't masking the non-trivial stuff.
Once I'm back in action that is. Still down. Argh.
foosel
on 29 Feb 2016
I think I will bring forth a small observation: While uploading to sdcard CPU maxes on the RPI.
This could indicate[1] that the problem is not "execution order" - simply said, but rather "too much work" being done per line of g-code being pumped through the engine.
MortenGuldager
on 29 Feb 2016
The parts I mean are less a case of execution order and more of "is it this
message? is it maybe that one? Oh, or this one? maybe this one here? oh, I
know, that one? still not, hmm, maybe...". But it's also only a hunch so
far.
Since you are observing it while uploading to sd card it shouldn't be gcode
processing which would have been my first guess, have to double check that
though.
foosel
on 29 Feb 2016
Perhaps we should have Chris, or somebody else, to confirm my observation, just to make sure I haven't fooled my self (again). At least before you burn too much fuel in your debugger.
MortenGuldager
on 29 Feb 2016
Right now I'm sadly still a coughing mess on my couch, so not much burnt
yet ;) But any additional input on this is probably very valuable once I
can tackle it, so keep it coming!
foosel
on 29 Feb 2016
I can confirm the CPU is maxed out at 100% during upload on an RPI B with a direct serial link running at 115200. Here is htop:

I was hoping to look at the signals again today but I got an order to print something and my make shift probes fell off! Unfortunately my £3.50 logic analyser didn't come with any probes so I will have to improvise something better tomorrow. Maybe steal some from my £24000 Tektronix logic analyser from the mid 90's.
I think a python profiler might be the best way to find where the CPU time goes.
nophead
on 29 Feb 2016
Thinking about it some more - let's ignore the 10ms for a bit but shouldn't a 100% cpu load be expected? We basically have a process here that is constantly busy either reading from or writing to the serial port. When is the core supposed to come up for a breather (= give control over to some other process) if everything runs as fast as possible here? Data trader as fast as possible is the actual goal, we want to have as high a throughput we can manage, no? (And again, please ignore that there might be some of those cycles spent on unnecessary stuff, that's another problem)
In fact, the more I think of it, the better it actually is that a 100% cpu load it's observable, since it means that the delay we are observing isn't caused by some misbehaving locks on which the code is waiting (which would give control back to the OS to give done cycles for another process), but by actual processing input and output data (which needs a closer look to remove fat, and for that a profile indeed is the tool of choice).
Or am I completely misreading things here?
foosel
on 29 Feb 2016
It depends how efficient the serial driver of the RPI is. You should be able to transmit a string using interrupts or DMA so the CPU is available while the characters are being sent and the OK is being received. Similarly with USB where the hardware does most of the hard work and interrupts or DMAs bulk data to the CPU.
And a 700mHz 32 bit ARM should be able to send faster than a 16mHz 8 bit AVR can receive it, parse it and write it to SD via 1 bit SPI. So the RPI should be hanging around waiting for OKs not the AVR waiting for data.
nophead
on 29 Feb 2016
Python and pyserial is indeed accountable for some of the CPU cycles being eaten. Wrote this small test program to illustrate:
#!/usr/bin/env python
import serial
import time
ser = serial.Serial('/dev/ttyAMA0', 250000)
for i in xrange(1, 10):
    s = 'U' * i
    t=time.time()
    for n in xrange(100000 / len(s)):
        ser.write(s)
    t = time.time() - t
    print i, t
which, when running on the RPI, model B, outputs
1 15.7945480347
2 8.64547085762
3 6.3043179512
4 4.74336218834
5 4.07250404358
6 4.0721051693
7 4.09759402275
8 4.04491209984
9 4.02989697456
This shows that size of chunks being sent down the stack and out the line matters too. For the bare bone program above line rate alone, in my case set to 250kbaud, becomes the limiting factor when outputting more than 5 bytes at a time. Below that the RPI CPU is the bottleneck.
In the extreme case, with one byte at a time, a quick calculation shows that only 25% of line capacity is utilized.
This is dumb sending alone, of course nowhere close to the work octoprint has to do, but at least it shows that the RPI is capable to saturate it's GPIO UART transmit channel using pyserial.
MortenGuldager
on 1 Mar 2016
I am back on this now with probes that stay on!
In comms.py why is there a startFileTransfer() and a startSdFileTransfer()? Am I correct in thinking startSdFileTransfer is not used?
nophead
on 1 Mar 2016
Now that is embarrassing, you are right.
foosel
on 1 Mar 2016
Had some time to play now and get some results and they are very confusing!
I added resetLineNumbers() before the M28 and that works fine, see https://github.com/nophead/OctoPrint/commit/db9a8369a52a626fa8cfb385dbda7520330e2458. Having discovered I can get rid of line numbers altogether in the features settings I think resetLineNumbers() should check self._neverSendChecksum and skip sending M110 if that is set.
I looked at the transfer with the extra OK sloshing around and that looks like this:

The message takes 4.8ms down the wire. Marlin thinks about it for 0.45ms and then sends OK which takes a further 0.24ms, making a total of 5.5ms. Octoprint takes 6.5ms after the OK to send the next message making a total of 12ms per line. Note that the OK it is replying to is actually the one before and the delay from that is 17ms.
Because of the extra OK you sometimes get too messages back to back. Here is an example:

A message gets delayed a whopping 32ms from the OK that triggered it and 24ms from the last OK. Somehow that manages to make the next two messages come back to back with absolutely no delay in between. That means it must have got around the send loop is less time than it takes to send a message when normally it takes more than twice as long.
I modified OctoPrint to expect OK after G28 instead of G29 and that gets rid of the double messages as it is now waiting for the OK from the last message before sending the next one. See https://github.com/nophead/OctoPrint/commit/a2b761ed2bac09262ff65db1f46e8f3baaed1554. I remove the line = "ok" because I couldn't see a reason for it.
I expected it to get a lot slower but it is actually about the same. So it looks like the getting the OK in advance doesn't make the send loop go any faster.

I tried turning off line numbers and checksums expecting it to get a little bit faster due to shorter messages but to my surprise it got significantly slower.

I can't explain that but reading about threads in Python it seems like they are broken due the global interpreter lock. It can cause weird things like more cores making it go slower and adding CPU intensive threads can then make it go faster.
I got an RPi 3 today so I will see if that goes faster or maybe slower!
nophead
on 2 Mar 2016
@nophead Interesting result. Now to figure out whether it is the python context switch (from the read thread that sees the ok and clears to send to the send loop) or latency in pyserial (post read or pre-write). Probably some logging we can come up with to help with that though we'll have to worry about Heisenberg :-).
I wonder what the timing graph looked like before the wait for ok when OctoPrint used to just go.
 markwal
on 2 Mar 2016
markwal
on 2 Mar 2016
I will try rolling back to the last version I was using.
I noticed this on the OctoPrint web page: "Profiling is done with the help of PyVmMonitor." Does it work on a RPi and does anybody have experience with it?
nophead
on 2 Mar 2016
I tried to roll back to the last version I used on this machine, which was 1.1.1-22-g83790fc. Git said "You are in 'detached HEAD' state." so just call me NOP from now on!
The ./oprint/bin/python setup.py install failed so I removed oprint and set up a new venv and tried with that. It falls over installing mock 1.3.0. mock requires setuptools>=17.1. Aborting installation
I tried sudo apt-get install python-setuptools but that says python-setuptools is already the newest version. so I gave up.
Onwards and upwards to RPi3.
nophead
on 2 Mar 2016
Haha nophead in a detached head state.
Oh shoot, I forgot there'd be complications like those trying to go backwards.
markwal
on 2 Mar 2016
I'm feeling like an idiot right now. I just lost half of the afternoon hunting down a delay of up to 6ms I observed when I just threw in some print debug statements out of curiosity. I found it. The serial.log was enabled m( After disabling that, back to square one...
foosel
on 3 Mar 2016
Yes I got 6ms extra when I had the log on. That seems slow for writing a block or two to an SD card. I don't think Marlin takes that long and it is only using a single bit SPI port. RPi uses four bits.
nophead
on 3 Mar 2016
Funny thing, that even seems to actually be the logging framework (Python's
own logging module)... I got the 6ms even on my development machine (i7
with SSD). But if you don't mind I'm not going to do a deep dive now into
getting the serial logging performant that's only for debug purposes anyhow
but rather look into the send loop ;)
foosel
on 3 Mar 2016
I start to doubt it will be an easy problem to fix. I just made a small program that waits for "ok" and then sends a "M110 N123". To try something different I this time wrote it in javascript (node) and ran it on my regular linux desktop box. Even here I see in the area of 2ms delay between last bit of ok before the next command start to transmit.
Usually I'm very impressed of execution speed node programs. Perhaps linux serial simply isn't meant for low latency stuff...
MortenGuldager
on 5 Mar 2016
What I did the last two days was spreading some simple print debugging over the critical parts of the comm code, mainly measuring the time between the received ok and the sent line, and then a couple of additional measurements in between. This I did on a pi2.
Then I started swapping things around and benchmarking a couple of parts. First of all moving the ok processing further up did indeed do improve things at least a tiny bit (up to half a ms maybe). What takes surprisingly long is a) reading a line from disk (up to 1ms), b) calculating the checksum (I benchmarked that and tried a couple of alternate implementations, didn't really change anything, still opted for the slightly fastest, half a ms to 1ms), and weirdly c) 2ms for waiting for the send queue get to complete. I also sometimes saw values of over 1ms for the sending itself. The queue issue might be caused by the implementation of pythons queue class itself. While looking at all that I got a really nice idea to decouple things further and I'll try and see if that might get rid of that particular delay.
Overall, when uploading to sd I saw delays between ok and line sent of 2ms up to 7, sometimes 8 or even 10, with most values seeming to be located around 4ms (note: that's just from watching the values scroll through, I'll have to write something to output that stuff via udp or something to another system and write into a quantifiable csv file, don't want to bog down the system under test with additional file i/o but also want to be able to analyse the data more effectively). This was not measured on the actual serial line but basically on the outer border of the comm layer. I'll see if I can combine both measure methods maybe to get some insight on how much gets lost in pyserial and os, but I'll first have to figure out how to get probes hooked up to that particular setup (hephestos 2) or get my spare ramps prepped for some tests.
Anyway, I now have at least some ideas where to look more closely, but I'm also thinking that there is time getting lost outside of my control considering your timings on the line vs mine in the code. What certainly was a relief is thatjust the presence of the hooks for processing the queued and sent lines indeed didn't cause much harm (200-300us iirc, I also measured during regular printing).
Anyway this just as a small first feedback from my side.
foosel
on 5 Mar 2016
Observations: (I read the whole thread, have LA, 5 marlins.)
- From past experiences with 'serial' communication way up in user space, GHz of horse power on thousands of lines is being burned to perform a hundred or less instructions for real communication.
- comm.py in OctoPrint is structured (to the reader) as if it might have to speak to a thousand different
Marlins at the same instant. (Instead of -- Here is a marlin 1.0 actual product shipped - 100 printers still going)
What happens here is there may be only (exaggerated #) 3 real marlins, but the code complexity gets extremely confusing due to fixing something for this, that and not being allowed to toss obsolete printers.
OctoPrint is speaking to only 1 firmware. - There is missing feedback to show which firmwares are in use and when. So I'd expect the developer of this section of product to become extremely protective because the complexity of the fixes impact ALL and not JUST the one firmware.
- The manufacturers/Marlin owners are not "clearly" in the loop. IE ("Your dreaded machine is still running
the original version of Marlin and is clearly capable of going up to, errr, let's say 1.1.0 on your cute little 16MHz 8bit 1980's modelish processor. Why not upgrade your firmware for free!")
I would also recon the "manufacturers->selling shop/brand" would enjoy feedback/facetime with their darling customers.
Questions:
- Is it possible to "objectize" the code so that slowly over time the whole picture becomes:
"I am the code for Original Marlin",
"I handle most marlins since they added 'xxxxxx'"
When OctoPrint talks to a printer it starts only uses 1 version, only has 1 extruder, etc.
Let the customer deal with that object. (You start adding extruders, the objects getting updated. Someday we may just save your printbed for you...) - I am amazed python can respond that quickly to a hardware device. It just by brute force that it can. Pushing serial communication and command response somehow down the
stack so there is almost '0' delay would really show that the Pi is almost completely free, not 100%.
It would also allow easier printer objects in python to talk with to do higher level customer/service interactions.
I also assume socket streams and newer faster methods are out the door somewhere. They'll come to you to interface if it looks easier.
- Shouldn't octoprint be the consumers interface, the manufacturers interface, the brands interface,
the slicer's interface? Collect the knowledge. Know more than a single manufacturer knows.
 gddeen
on 6 Mar 2016
gddeen
on 6 Mar 2016
@nophead, @MortenGuldager I think I've found a very big culprit, and it was a quite idiotic one (hint: commit e2ec1ae1652c69fb4fd5c142d6901a39d05ad7a6). Could you guys check out the improve/commPerformance branch (https://github.com/foosel/OctoPrint/tree/improve/commPerformance) and tell me what you are seeing?
I had to revert a lot of what I did the last few days with regards to swapping things around since it broke things severely, but in the end with the small rather non-invasive changes I now did I arrived at a very consistent 1.5-2ms per sent line on a pi2 while uploading to SD (without the patches: 2-3, some peaks around 4 -- the values in my previous post were measured with more debug output and hence differ). Again measured when seeing the ok and when sending the next line (so without additional delays added by pyserial or the OS. It might be possible to shave off some more by changing the queue handling in general, but that's nothing that could be done as part of a maintenance release since that would mean very invasive changes and those I rather reserve for larger releases that see more intermittent testing by the community over a long time.
_edit_ value range and comparison
foosel
on 7 Mar 2016
I tried, chopped off head and everything, but nope, perhaps it went down from 7ms to 6ms, give and take. - not very consistent - will test some more tomorrow.
RPi-1B, GPIO serial, 250000baud. Lets hear it from some other headless guys.
Ah yes, octoprint says "Version: 1.2.9.post19+ge2ec1ae (HEAD branch)", so the version change should be fine. I did: git checkout e2ec1ae ; ./venv/bin/python setup.py install
MortenGuldager
on 7 Mar 2016
With Version: 1.2.10.dev21+g7301012 (improve/commPerformance branch) I get pretty much the same performance to my last test on my branch. About 12ms cycle time and 6ms latency, i.e. 50% utilisation of 115200 kb serial link.
I also have to do fake acknowledgement at the end to get it moving again. It looks like it expects OK from M28 and M29.
At the start it sends an M110 N0 with the current line number, so that has no effect with the Marlin I am using.
For some unknown reason I couldn't start it as a service but it worked from the command line. Switching back to my fork it works as a service again.
nophead
on 8 Mar 2016
I'm starting to think it is pyserial.
I just added a serial.flush() after my writes, which as far as I can see in the code should basically make it wait until the data has actually been sent over the serial line, and that made the line sending take 8-9ms instead of 2:
##### received line: 0.450927734375
##### received ok: 0.64111328125
##### sent line: 9.0400390625
##### received line: 0.406982421875
##### received ok: 0.61376953125
##### sent line: 8.83911132812
##### received line: 0.537109375
##### received ok: 0.61279296875
##### sent line: 8.96606445312
##### received line: 0.25927734375
##### received ok: 0.626953125
##### sent line: 9.01293945312
##### received line: 0.375
##### received ok: 0.756103515625
##### sent line: 8.85888671875
For comparison, this is without flush:
##### received line: 4.25512695312
##### received ok: 0.849853515625
##### sent line: 2.0
##### received line: 4.15087890625
##### received ok: 0.826171875
##### sent line: 1.87084960938
##### received line: 4.28100585938
##### received ok: 0.900146484375
##### sent line: 1.97802734375
##### received line: 6.89086914062
##### received ok: 0.925048828125
##### sent line: 1.88598632812
##### received line: 4.173828125
##### received ok: 0.8203125
##### sent line: 1.85083007812
##### received line: 4.34106445312
##### received ok: 0.885009765625
##### sent line: 2.22998046875
##### received line: 5.28002929688
##### received ok: 0.886962890625
##### sent line: 1.91796875
##### received line: 4.17993164062
##### received ok: 0.8671875
##### sent line: 2.06909179688
So then I dug deeper again and have now arrived at this (values not comparable to the above ones, more output means slower performance overall):
##### received line: 8.52099609375
##### --- received ok: 0.39697265625
##### --- sending from file: 0.7060546875
##### --- fetched line from file: 1.17114257812
##### --- enqueued new line: 1.4951171875
##### --- sent from file: 1.71313476562
##### --- new line to send: 1.96313476562
##### --- increment line number: 2.3310546875
##### --- calculating checksum: 2.50805664062
##### --- sending line: 2.91015625
##### --- sent line: 3.29321289062
##### received line: 8.63012695312
##### --- received ok: 0.400146484375
##### --- sending from file: 0.701904296875
##### --- fetched line from file: 1.06689453125
##### --- enqueued new line: 1.3720703125
##### --- new line to send: 1.55590820312
##### --- sent from file: 1.73193359375
##### --- increment line number: 1.94995117188
##### --- calculating checksum: 2.22119140625
##### --- sending line: 2.63500976562
##### --- sent line: 3.0439453125
##### received line: 8.48291015625
##### --- received ok: 0.39404296875
##### --- sending from file: 0.718994140625
##### --- fetched line from file: 1.21997070312
##### --- enqueued new line: 1.5390625
##### --- new line to send: 1.71508789062
##### --- sent from file: 1.88305664062
##### --- increment line number: 2.123046875
##### --- calculating checksum: 2.40625
##### --- sending line: 2.82495117188
##### --- sent line: 3.22705078125
##### received line: 8.62817382812
##### --- received ok: 0.466796875
##### --- sending from file: 0.7919921875
##### --- fetched line from file: 1.13891601562
##### --- enqueued new line: 1.44604492188
##### --- new line to send: 1.63793945312
##### --- increment line number: 1.91772460938
##### --- sent from file: 2.06079101562
##### --- calculating checksum: 2.19995117188
##### --- sending line: 2.7138671875
##### --- sent line: 3.10888671875
##### received line: 8.52294921875
##### --- received ok: 0.402099609375
##### --- sending from file: 0.7041015625
##### --- fetched line from file: 1.02099609375
##### --- enqueued new line: 1.3359375
##### --- new line to send: 1.52001953125
##### --- sent from file: 1.74194335938
##### --- increment line number: 1.98486328125
##### --- calculating checksum: 2.27685546875
##### --- sending line: 2.70703125
##### --- sent line: 3.10083007812
First of all a short explanation what the measure points are:
- read thread
received line: Right after fetching a new line from the serial port, without any processing yetreceived ok: Line logged (+ sanitized to ASCII, which is the biggest chunk of time here) and parsed asok, right after thisclear_to_send.set()gets calledsending from file: We are currently printing, so we now try to send the next line from the current file - the 0.3ms spent here are due to also detecting that we are in fact streaming, so the regular command queue doesn't apply and shouldn't be processed.fetched line from file: next line to send fetched from file, comments are stripped alreadyenqueued new line: next line has entered send queuesent from file: that's when we "surface" after entering thesending from fileprocess
- send thread
new line to send: send queue has detected that a new line to process is available (different thread from the prior steps, so we see a bit of order switchups here)increment line number: capture lock, increase line number, add line to past lines to be able to resendcalculating checksum: now going to calculate the line's checksum (prefix withN<linenumber>, build checksum, postfix*<checksum>)sending line: just beforeserial.writesent line: after returning from sending the line via serial
So what we are seeing here is the following "slow runners":
- reading a line from the file (
sending from filetofetched line from file): this is because I must strip comments from the lines I read (since I must not send comments to the firmware), and since that might have the line end up completely empty, I potentially have to read more than one line from the file too (must also not send empty lines to the firmware) - so here there's nothing to save - line number + checksum: the checksum part cannot be further optimized as far as I can see - I need to follow the algorithm here, and that means iterating over every char on the line and XORing it with the running result, I don't see how to do that differently than iterating over every char and... well... XORing. The line number delay appears to be caused by the locking I have to do here in order to prevent a potential resend response being read at the same time from jumbling up things
- processing of send queue (
enqueued new linetonew line to send): this is thegetmethod of a PythonQueueat work. Apparently there are some performance issues here. Thing is, I can't use a simpledequeuehere since I don't want a busy wait in the send loop (that would bring the CPU to its knees), so I need a lock here, and aQueueis adequeue+ lock, so I don't really see how to optimize that part - The elephant in the room, the sent-read delay (
sent lineto nextreceived line): I'm seeing a lot of time spent here. After myflushexperiment it appears to in fact be that the printer DOES send a new line quite fast, but after if fire a line to theserial.writeit takes ages to actually get sent out. As long as this is the case, basically all optimization I might be able to do in code under my control have no chance to really influence things. I'm going to give the new pyserial version a spin, maybe that improved things, but I also did a quick google search for slow writes with pyserial and the results were a bit disheartening.
Finally, how things look right now if I limit the output to received line, received ok and sent line and have received ok and sent line report relative to received line:
##### received line: 7.1240234375
##### --- received ok: 0.6630859375
##### --- sent line: 2.93310546875
##### received line: 8.42797851562
##### --- received ok: 0.680908203125
##### --- sent line: 2.61010742188
##### received line: 7.25903320312
##### --- received ok: 0.684814453125
##### --- sent line: 2.71411132812
##### received line: 7.19213867188
##### --- received ok: 0.67578125
##### --- sent line: 2.81079101562
##### received line: 7.1298828125
##### --- received ok: 0.6630859375
##### --- sent line: 2.68090820312
##### received line: 7.1259765625
##### --- received ok: 0.722900390625
##### --- sent line: 2.9130859375
##### received line: 8.46484375
##### --- received ok: 0.671142578125
##### --- sent line: 2.94116210938
##### received line: 8.65234375
##### --- received ok: 0.661865234375
##### --- sent line: 2.62573242188
##### received line: 7.20288085938
##### --- received ok: 0.73779296875
##### --- sent line: 2.78784179688
##### received line: 7.10693359375
##### --- received ok: 0.656982421875
##### --- sent line: 2.72998046875
##### received line: 7.19799804688
##### --- received ok: 0.682861328125
##### --- sent line: 2.66381835938
##### received line: 7.1181640625
##### --- received ok: 0.663818359375
##### --- sent line: 2.92797851562
##### received line: 8.32983398438
##### --- received ok: 0.755126953125
##### --- sent line: 2.68701171875
##### received line: 10.2429199219
##### --- received ok: 0.72998046875
##### --- sent line: 3.42407226562
Note the huge delay between sent and received.
And the same with flush:
##### received line: 10.0180664062
##### --- received ok: 0.7109375
##### --- sent line: 9.798828125
##### received line: 10.0437011719
##### --- received ok: 0.667236328125
##### --- sent line: 9.62622070312
##### received line: 9.99829101562
##### --- received ok: 0.552734375
##### --- sent line: 9.90283203125
##### received line: 10.0048828125
##### --- received ok: 0.81201171875
##### --- sent line: 9.494140625
##### received line: 9.85009765625
##### --- received ok: 0.517822265625
##### --- sent line: 9.65283203125
##### received line: 10.0209960938
##### --- received ok: 0.5390625
##### --- sent line: 9.59887695312
##### received line: 10.3669433594
##### --- received ok: 0.39697265625
##### --- sent line: 9.38793945312
##### received line: 9.75903320312
##### --- received ok: 0.531005859375
##### --- sent line: 9.66015625
##### received line: 9.90478515625
##### --- received ok: 0.770263671875
##### --- sent line: 9.59008789062
##### received line: 9.97119140625
##### --- received ok: 0.5087890625
##### --- sent line: 9.6328125
##### received line: 9.9970703125
##### --- received ok: 0.520751953125
##### --- sent line: 9.76977539062
##### received line: 10.0190429688
##### --- received ok: 0.682861328125
##### --- sent line: 9.77294921875
##### received line: 10.1318359375
##### --- received ok: 0.554931640625
##### --- sent line: 9.48803710938
##### received line: 9.84619140625
##### --- received ok: 0.630859375
##### --- sent line: 9.63500976562
##### received line: 10.0026855469
##### --- received ok: 0.524169921875
##### --- sent line: 9.63818359375
##### received line: 9.98828125
##### --- received ok: 0.533935546875
##### --- sent line: 9.806640625
##### received line: 10.0400390625
##### --- received ok: 0.6826171875
##### --- sent line: 9.79760742188
So - there we have the ~10ms. Around 2ms of them are actual "oh, look, new line can be sent, let's send it" OctoPrint code, plus ~0.5ms for "read bytes, encode to ascii". Rest appears to be waiting for pyserial. Or am I misreading things here?
foosel
on 8 Mar 2016
Possibly it is because you give away the CPU during the serial write to
another python thread and don't get it back until it releases the GIL. I.e.
pre-emptive OS multitasking becomes almost cooperative multitasking in
Python due to the GIL. I see there are many Python threads now in
OctoPrint, not just send and receive.
I will try a simple single threaded script that just sends without line
number and checksums, waits for OK and loops. That will show the fastest
achievable with Pyserial.
On 8 March 2016 at 11:06, Gina Häußge [email protected] wrote:
I'm starting to think it is pyserial.
I just added a serial.flush() after my writes, which as far as I can see
in the code should basically make it wait until the data has actually been
sent over the serial line, and that made the line sending take 8-9ms
instead of 2:received line: 0.450927734375
received ok: 0.64111328125
sent line: 9.0400390625
received line: 0.406982421875
received ok: 0.61376953125
sent line: 8.83911132812
received line: 0.537109375
received ok: 0.61279296875
sent line: 8.96606445312
received line: 0.25927734375
received ok: 0.626953125
sent line: 9.01293945312
received line: 0.375
received ok: 0.756103515625
sent line: 8.85888671875
For comparison, this is without flush:
received line: 4.25512695312
received ok: 0.849853515625
sent line: 2.0
received line: 4.15087890625
received ok: 0.826171875
sent line: 1.87084960938
received line: 4.28100585938
received ok: 0.900146484375
sent line: 1.97802734375
received line: 6.89086914062
received ok: 0.925048828125
sent line: 1.88598632812
received line: 4.173828125
received ok: 0.8203125
sent line: 1.85083007812
received line: 4.34106445312
received ok: 0.885009765625
sent line: 2.22998046875
received line: 5.28002929688
received ok: 0.886962890625
sent line: 1.91796875
received line: 4.17993164062
received ok: 0.8671875
sent line: 2.06909179688
So then I dug deeper again and have now arrived at this (values not
comparable to the above ones, more output means slower performance overall):received line: 8.52099609375
--- received ok: 0.39697265625
--- sending from file: 0.7060546875
--- fetched line from file: 1.17114257812
--- enqueued new line: 1.4951171875
--- sent from file: 1.71313476562
--- new line to send: 1.96313476562
--- increment line number: 2.3310546875
--- calculating checksum: 2.50805664062
--- sending line: 2.91015625
--- sent line: 3.29321289062
received line: 8.63012695312
--- received ok: 0.400146484375
--- sending from file: 0.701904296875
--- fetched line from file: 1.06689453125
--- enqueued new line: 1.3720703125
--- new line to send: 1.55590820312
--- sent from file: 1.73193359375
--- increment line number: 1.94995117188
--- calculating checksum: 2.22119140625
--- sending line: 2.63500976562
--- sent line: 3.0439453125
received line: 8.48291015625
--- received ok: 0.39404296875
--- sending from file: 0.718994140625
--- fetched line from file: 1.21997070312
--- enqueued new line: 1.5390625
--- new line to send: 1.71508789062
--- sent from file: 1.88305664062
--- increment line number: 2.123046875
--- calculating checksum: 2.40625
--- sending line: 2.82495117188
--- sent line: 3.22705078125
received line: 8.62817382812
--- received ok: 0.466796875
--- sending from file: 0.7919921875
--- fetched line from file: 1.13891601562
--- enqueued new line: 1.44604492188
--- new line to send: 1.63793945312
--- increment line number: 1.91772460938
--- sent from file: 2.06079101562
--- calculating checksum: 2.19995117188
--- sending line: 2.7138671875
--- sent line: 3.10888671875
received line: 8.52294921875
--- received ok: 0.402099609375
--- sending from file: 0.7041015625
--- fetched line from file: 1.02099609375
--- enqueued new line: 1.3359375
--- new line to send: 1.52001953125
--- sent from file: 1.74194335938
--- increment line number: 1.98486328125
--- calculating checksum: 2.27685546875
--- sending line: 2.70703125
--- sent line: 3.10083007812
First of all a short explanation what the measure points are:
- read thread
- received line: Right after fetching a new line from the serial
port, without any processing yet
- received ok: Line logged (+ sanitized to ASCII, which is the
biggest chunk of time here) and parsed as ok, right after this
clear_to_send.set() gets called
- sending from file: We are currently printing, so we now try to
send the next line from the current file - the 0.3ms spent here are due to
also detecting that we are in fact streaming, so the regular command queue
doesn't apply and shouldn't be processed.
- fetched line from file: next line to send fetched from file,
comments are stripped already
- enqueued new line: next line has entered send queue
- sent from file: that's when we "surface" after entering the sending
from file process
- send thread
- new line to send: send queue has detected that a new line to process
is available (different thread from the prior steps, so we see a bit of
order switchups here)
- increment line number: capture lock, increase line number, add
line to past lines to be able to resend
- calculating checksum: now going to calculate the line's checksum
(prefix with N, build checksum, postfix * )
- sending line: just before serial.write
- sent line: after returning from sending the line via serial
So what we are seeing here is the following "slow runners":
- reading a line from the file (sending from file to fetched line from
file): this is because I must strip comments from the lines I read
(since I must not send comments to the firmware), and since that might have
the line end up completely empty, I potentially have to read more than one
line from the file too (must also not send empty lines to the firmware) -
so here there's nothing to save- line number + checksum: the checksum part cannot be further
optimized as far as I can see - I need to follow the algorithm here, and
that means iterating over every char on the line and XORing it with the
running result, I don't see how to do that differently than iterating over
every char and... well... XORing. The line number delay appears to be
caused by the locking I have to do here in order to prevent a potential
resend response being read at the same time from jumbling up things- processing of send queue (enqueued new line to new line to send):
this is the get method of a Python Queue at work. Apparently there are
some performance issues here. Thing is, I can't use a simple dequeue
here since I don't want a busy wait in the send loop (that would bring the
CPU to its knees), so I need a lock here, and a Queue is a dequeue +
lock, so I don't really see how to optimize that part- The elephant in the room, the sent-read delay (sent line to next received
line): I'm seeing a lot of time spent here. After my flush experiment
it appears to in fact be that the printer DOES send a new line quite fast,
but after if fire a line to the serial.write it takes ages to actually
get sent out. As long as this is the case, basically all optimization I
might be able to do in code under my control have no chance to really
influence things. I'm going to give the new pyserial version a spin, maybe
that improved things, but I also did a quick google search for slow writes
with pyserial and the results were a bit disheartening.Finally, how things look right now if I limit the output to received line,
received ok and sent line and have received ok and sent line report
relative to received line:received line: 7.1240234375
--- received ok: 0.6630859375
--- sent line: 2.93310546875
received line: 8.42797851562
--- received ok: 0.680908203125
--- sent line: 2.61010742188
received line: 7.25903320312
--- received ok: 0.684814453125
--- sent line: 2.71411132812
received line: 7.19213867188
--- received ok: 0.67578125
--- sent line: 2.81079101562
received line: 7.1298828125
--- received ok: 0.6630859375
--- sent line: 2.68090820312
received line: 7.1259765625
--- received ok: 0.722900390625
--- sent line: 2.9130859375
received line: 8.46484375
--- received ok: 0.671142578125
--- sent line: 2.94116210938
received line: 8.65234375
--- received ok: 0.661865234375
--- sent line: 2.62573242188
received line: 7.20288085938
--- received ok: 0.73779296875
--- sent line: 2.78784179688
received line: 7.10693359375
--- received ok: 0.656982421875
--- sent line: 2.72998046875
received line: 7.19799804688
--- received ok: 0.682861328125
--- sent line: 2.66381835938
received line: 7.1181640625
--- received ok: 0.663818359375
--- sent line: 2.92797851562
received line: 8.32983398438
--- received ok: 0.755126953125
--- sent line: 2.68701171875
received line: 10.2429199219
--- received ok: 0.72998046875
--- sent line: 3.42407226562
Note the huge delay between sent and received.
And the same with flush:
received line: 10.0180664062
--- received ok: 0.7109375
--- sent line: 9.798828125
received line: 10.0437011719
--- received ok: 0.667236328125
--- sent line: 9.62622070312
received line: 9.99829101562
--- received ok: 0.552734375
--- sent line: 9.90283203125
received line: 10.0048828125
--- received ok: 0.81201171875
--- sent line: 9.494140625
received line: 9.85009765625
--- received ok: 0.517822265625
--- sent line: 9.65283203125
received line: 10.0209960938
--- received ok: 0.5390625
--- sent line: 9.59887695312
received line: 10.3669433594
--- received ok: 0.39697265625
--- sent line: 9.38793945312
received line: 9.75903320312
--- received ok: 0.531005859375
--- sent line: 9.66015625
received line: 9.90478515625
--- received ok: 0.770263671875
--- sent line: 9.59008789062
received line: 9.97119140625
--- received ok: 0.5087890625
--- sent line: 9.6328125
received line: 9.9970703125
--- received ok: 0.520751953125
--- sent line: 9.76977539062
received line: 10.0190429688
--- received ok: 0.682861328125
--- sent line: 9.77294921875
received line: 10.1318359375
--- received ok: 0.554931640625
--- sent line: 9.48803710938
received line: 9.84619140625
--- received ok: 0.630859375
--- sent line: 9.63500976562
received line: 10.0026855469
--- received ok: 0.524169921875
--- sent line: 9.63818359375
received line: 9.98828125
--- received ok: 0.533935546875
--- sent line: 9.806640625
received line: 10.0400390625
--- received ok: 0.6826171875
--- sent line: 9.79760742188
So - there we have the ~10ms. Around 2ms of them are actual "oh, look, new
line can be sent, let's send it" OctoPrint code, plus ~0.5ms for "read
bytes, encode to ascii". Rest appears to be waiting for pyserial. Or am I
misreading things here?—
Reply to this email directly or view it on GitHub
https://github.com/foosel/OctoPrint/issues/450#issuecomment-193730781.
nophead
on 8 Mar 2016
I think I was faster than you: upload.py.
Usage: upload.py <port> <baudrate> <path> <targetname> [ flush ]

If flush is given, serial.flush will be called after each write.

Comm log will be written to stdout, timings to stderr.
Timings without flush:
##### line received: 4.37521934509
##### ---ok received: 0.103950500488
##### ---line sent: 0.389814376831
##### line received: 4.24885749817
##### ---ok received: 0.103950500488
##### ---line sent: 0.353097915649
##### line received: 4.2519569397
##### ---ok received: 0.105142593384
##### ---line sent: 0.355005264282
##### line received: 4.37617301941
##### ---ok received: 0.113964080811
##### ---line sent: 0.361919403076
##### line received: 4.24885749817
##### ---ok received: 0.1060962677
##### ---line sent: 0.353097915649
##### line received: 4.25410270691
##### ---ok received: 0.113964080811
##### ---line sent: 0.362873077393
##### line received: 4.2519569397
##### ---ok received: 0.104904174805
##### ---line sent: 0.351905822754
##### line received: 4.2450428009
##### ---ok received: 0.103950500488
##### ---line sent: 0.351905822754
##### line received: 4.12893295288
##### ---ok received: 0.104904174805
##### ---line sent: 0.356912612915
##### line received: 4.24790382385
##### ---ok received: 0.104188919067
##### ---line sent: 0.354051589966
##### line received: 8.37898254395
##### ---ok received: 0.11420249939
##### ---line sent: 0.365018844604
##### line received: 4.24909591675
##### ---ok received: 0.114917755127
##### ---line sent: 0.363111495972
##### line received: 4.1229724884
##### ---ok received: 0.103950500488
##### ---line sent: 0.354051589966
##### line received: 4.24814224243
##### ---ok received: 0.104904174805
##### ---line sent: 0.35285949707
and with flush:
##### line received: 10.0440979004
##### ---ok received: 0.108003616333
##### ---line sent: 9.4039440155
##### line received: 9.97090339661
##### ---ok received: 0.107049942017
##### ---line sent: 1.0621547699
##### line received: 2.91514396667
##### ---ok received: 0.105857849121
##### ---line sent: 6.51693344116
##### line received: 7.10582733154
##### ---ok received: 0.105142593384
##### ---line sent: 9.41300392151
##### line received: 9.97710227966
##### ---ok received: 0.1060962677
##### ---line sent: 9.44089889526
##### line received: 10.0128650665
##### ---ok received: 0.1060962677
##### ---line sent: 9.42611694336
##### line received: 9.99116897583
##### ---ok received: 0.105857849121
##### ---line sent: 9.43684577942
##### line received: 10.0319385529
##### ---ok received: 0.1060962677
##### ---line sent: 9.4039440155
##### line received: 9.95898246765
##### ---ok received: 0.1060962677
##### ---line sent: 9.44495201111
##### line received: 9.99999046326
##### ---ok received: 0.103950500488
##### ---line sent: 9.44709777832
##### line received: 9.99999046326
##### ---ok received: 0.105142593384
##### ---line sent: 9.4530582428
##### line received: 10.195016861
##### ---ok received: 0.113010406494
##### ---line sent: 9.2670917511
Yes much faster than me and more thorough.
Without flush it was the same as OctoPrint, around 10ms per cycle with about 6ms latency.

With flush it is three times slower, no idea why.

Then I removed the print statements and the latency dropped to about 1.2ms without flush.

With flush it is still much slower.

nophead
on 8 Mar 2016
According to this: http://pyserial.readthedocs.org/en/latest/pyserial_api.html write is blocking when no timeout is specified, so I would have expected a flush after a write to come back immediately. I can't think why it can wait 25ms.
nophead
on 8 Mar 2016
I plotted the data I got from three separate runs and calculated min, max and average, one with upload.py, one with OctoPrint with the CountedEvent used for ok tracking, one with a regular threading.Event (I was wondering if there was a difference - there isn't).

So on average, upload.py is 3ms faster for each round trip. flush always has everything run against the magical 10ms boundary for the received line round trips, regardless of whether I use OctoPrint, upload.py or even Printrun (I modified printcore to also output the same kind of timings).
Just for the record, do you also see similar roundtrip values in the log output on stderr as you see on the actual line?
It's also very weird that while from Python it looks like it's the write that is slow and the read that is fast, on the line it looks just the other way around. Makes me wonder if the readline method might be the real culprit (I so far assumed write).
foosel
on 8 Mar 2016
Ah, just saw your reference to the API docs.
From what I see in the actual code of PySerial, write with no timeout appears to be writing it to the output buffer and flush waits until that is actually processed and hence really went over the line. But I agree that that shouldn't take _that_ long...
Also, forget what I said about read vs write being slow, the timing diagram can be interpreted just as easily the other way around.
So, at this point I'm a bit stumped. I have absolutely no idea what's happening with flush there and where the read delays are coming from that I'm saying. And the only explanation that I have for the avg. 3ms between OctoPrint and upload.py I'm seeing in my current tests is the GIL. But that is just a hunch, and I'm a bit wary of sinking the amount of time I'd need into the current comm layer in order to make it multiprocessing capable to test that theory (from my understanding of multiprocessing, it should get rid of the GIL since it would indeed use separate processes instead of threads in the same process then, but there is a bit of an overhead involved there, and especially on single core CPUs (Pi1) it seems to not be that good of an idea depending on who you ask). So I guess I need to think about this some more, read up on multiprocessing a bit more and figure out if it's viable at all (especially considering the gcode hook situation).
foosel
on 8 Mar 2016
I hacked your upload to accumulate stats in a dictionary instead of printing them. This is what I get:
Uploading file /mnt/reprap/tmp/Dice.gco as dice.gco to printer on port /dev/ttyAMA0, baudrate 115200. Serial flush is disabled
Connected.
line received count 13352 ave  5.7 min  0.8 max 59.5
ok received count 13349 ave  0.1 min  0.1 max 6.4
line sent count 13350 ave  0.5 min  0.4 max 10.8
Done.
So on the face of it looks like receive is slow but send is faster than the line so actually it looks like write is non-blocking and read has to wait for the write to happen before the OK comes back. This is running at almost the full line half duplex bandwidth. The Python is only wasting about 1ms.
With flush both the read and the write get much longer:
Uploading file /mnt/reprap/tmp/Dice.gco as dice.gco to printer on port /dev/ttyAMA0, baudrate 115200. Serial flush is enabled
Connected.
line received count 13352 ave 20.0 min  0.8 max 58.4
ok received count 13349 ave  0.1 min  0.1 max 0.6
line sent count 13350 ave 19.1 min  0.8 max 29.5
Done.
What I would expect is for sent to be around 5ms longer and received to be 5ms shorter.
In conclusion I think pyserial flush must be broken. Raw Python is about twice as fast as OctoPrint. I don't think it is necessary or wise to have send and receive in separate threads for a half duplex protocol. I have always done it with one but then I only allow my slaves to reply to the master, they never speak out of turn and they must reply within a specified timeout. Again I think RepRap is horribly and irrecoverably broken and will go back to my own simple system design, blow the cobwebs of HydraRaptor and bring it up to modern standards with a 32 bit controller and an RPi 2 host or perhaps 3 if I can get the serial port to work.
nophead
on 8 Mar 2016
I don't think multiprocessing will work to separate the reader from the writer on Windows because only one process at a time can have the device open.
markwal
on 8 Mar 2016
Unless you modified that too, keep in mind that ok received and line sent are relative to the last collected timestamp for line received (set swap=True on the _process_tick call to have it actually record a new time tick).
So in the first block, the lines actually take 5.7ms on average to be received, with a delay of 5.7 - 0.5 = 5.2ms between writing and receiving. And the ok gets recognized immediately after the read since there's not much besides one line of python or so in between.
For the second block that means about 20ms on average between each received line, with the sending incl. flush taking 19.1ms of those, so only 0.9ms delay between sending the next line and receiving the ok for it.
And good point with the windows device restrictions. Might still work with a single threaded half duplex read/write process as you suggest that uses queues to exchange what it reads and writes with OctoPrint, but that's going to be tricky to keep dynamic.
foosel
on 8 Mar 2016
Getting people confused, sorry, long day. So single threaded half duplex like @nophead suggested.
foosel
on 8 Mar 2016
10 ms is probably the dispatch cycle time. So, multiple processes should have no effect at all. (Id only guess.)
Doing real time work in a non-real time environment only works well when the speed of work is much faster
than the job.
Taking ftdi and writing it to be a usb/3d printer driver would allow octoprint to queue up all kinds of output
and be ready, and give a “Where is it really at” interface.
Users space shouldn’t design below a specific speed or they go around in circles.
—
A flush on a serial port says “Im done. Let another process have the queue.”
On Mar 8, 2016, at 11:33 AM, Mark Walker [email protected] wrote:
I don't think multiprocessing will work to separate the reader from the writer on Windows because only one process at a time can have the device open.
—
Reply to this email directly or view it on GitHub https://github.com/foosel/OctoPrint/issues/450#issuecomment-193851678.
gddeen
on 8 Mar 2016
@gddeen Thing is though, there ARE faster speeds from user space possible than with the current design as the upload.py examples shows. I agree that there's a limit for a non-RTOS situation, but OctoPrint's current speeds aren't near it.
However, this will be a long term thing to change, I can't see a good way to solve this as part of a maintenance release without risking breaking things across the board or destroying backwards compatibility for third party plugins. What I will do however is push some more small changes that shave off some more processing time here and there to hopefully improve things and try to find the time to experiment with alternatives.
foosel
on 9 Mar 2016
OK I have now changed swap to be always be true and get the following: -
Uploading file /mnt/reprap/tmp/Dice.gco as dice.gco to printer on port /dev/ttyAMA0, baudrate 115200. Serial flush is disabled
Connected.
line received count 13352 ave  5.2 min  0.8 max 56.9
ok received count 13349 ave  0.1 min  0.1 max 3.5
line sent count 13350 ave  0.4 min  0.4 max 5.6
Done.
Uploading file /mnt/reprap/tmp/Dice.gco as dice.gco to printer on port /dev/ttyAMA0, baudrate 115200. Serial flush is enabled
Connected.
flushed count 13351 ave 18.6 min  0.1 max 29.2
ok received count 13349 ave  0.1 min  0.1 max  2.7
line received count 13352 ave  0.9 min  0.8 max353.2
line sent count 13350 ave  0.4 min  0.4 max  4.7
Done.
So write must be non blocking until perhaps you try to do a second one before the first one has completed. Flush takes 18.6ms to flush a message that only takes about 5ms to transmit so must be broken on the RPi.
Looking at the Pyserial code it does termios.tcdrain(self.fd) and looking at the definition of tcdrain I found an example of using it to control the RTS line, see https://en.wikibooks.org/wiki/Serial_Programming/termios#tcdrain. That would not work on RS485 if it had a 15ms latency as RTS needs to be dropped just after the last bit to allow slaves to reply.
Having implemented RTS control myself on many embedded UARTs I know it is difficult unless the UART has a separate interrupt for transmit under-run. Often they only interrupt for transmit buffer empty but that is one character too early because of the character in the shift register. Then you have to set up a timer interrupt and this may be where the bug is.
nophead
on 9 Mar 2016
_sigh_ I think I'm giving up on the improve/commPerformance branch. On monday and yesterday, what I did made it faster than maintenance. Now - running everything as a service again instead of in debug mode - maintenance has about the same speed as upload.py (total time needed for file uploads, NOT line measurements or something like that) and improve/commPerformance is - ironically - way slower. I have no idea what's going on any more at that point. Maybe it really is a timing issue due to the threading, and what looked good with debug output in the middle (slowing stuff JUST enough down to cause pleasant side effects elsewhere) is just worse under production. The new branch is ready for the bin in any case :/
For reference, streaming a file 20mm-box-h2.gcode, 123.2KB at 115200 baud:
- via OctoPrint
improve/commPerformance:turtle: :
- 30.43s
- 29.83s
- 30.21s
- via OctoPrint
maintenance:
- 17.24s
- 17.33s
- 17.37s
- via
upload.py(modified, see below):
  $ python upload.py /dev/ttyUSB0 115200 ~/.octoprint/uploads/20mm-box-h2.gcode test.gco
  Uploading file /home/pi/.octoprint/uploads/20mm-box-h2.gcode as test.gco to printer on port /dev/ttyUSB0, baudrate 115200. Serial flush is disabled, commlog is enabled, timinglog is enabled
  Connected.
  Finished in 17.9356861115s.
  Done.
  $ python upload.py /dev/ttyUSB0 115200 ~/.octoprint/uploads/20mm-box-h2.gcode test.gco
  Uploading file /home/pi/.octoprint/uploads/20mm-box-h2.gcode as test.gco to printer on port /dev/ttyUSB0, baudrate 115200. Serial flush is disabled, commlog is enabled, timinglog is enabled
  Connected.
  Finished in 17.9593060017s.
  Done.
  $ python upload.py /dev/ttyUSB0 115200 ~/.octoprint/uploads/20mm-box-h2.gcode test.gco
  Uploading file /home/pi/.octoprint/uploads/20mm-box-h2.gcode as test.gco to printer on port /dev/ttyUSB0, baudrate 115200. Serial flush is disabled, commlog is enabled, timinglog is enabled
  Connected.
  Finished in 17.9585530758s.
  Done.
(modified: comm and timing output disabled by completely commenting out the calls to the corresponding functions, job duration as time between sending of M28 and reception of ok to M29 added)
So, for the record... for now, I'll have to leave things as they are, simply because I'm all out of ideas.
I'll keep the stupid branch around probably (at least locally), just in case, but it's a dead end at this point considering above results.
Since I'm (at least currently?!) seeing similar completion times for the same file in the multithreaded OctoPrint comm layer as in the strictly single threaded ping-pong-based upload.py, IMHO it doesn't make much sense looking into reducing the thread count within the comm layer as long as it's the same process as the rest of the application still.
Getting the communication into a different process is something I've been pondering anyhow though, simply due to the reason that it would open up the possibility to renice it. But that's a huge undertaking due to the current communication of internal states and data simply not being up to the task (too complex, not pickleable etc).
Current recommendation is, if you run into slow down issues while printing via serial, make sure your slicer doesn't produce insanely small segments, and if it doesn't and the issue persists either consider printing slower or from SD. Due to the nature of the protocol and serial comms there will be an upper limit for what the serial can master in any case, the current implementation drags that limit lower is all. Personally I haven't really been able to witness quality impact myself anymore since switching over to the 1.2.x approach, but I'll continue digging anyhow.
Meh.
foosel
on 9 Mar 2016
I find the maintenance branch is about 2ms faster than my fork from devel, but it has the spare ok problem so I need to fix that for a true comparison. I can only run it from the command line though. When I start it as a service nothing happens in the log.
Started from the command line I get this error but it continues to run.
016-03-09 18:19:25,612 - octoprint.plugin.core - ERROR - Error loading plugin corewizard
Traceback (most recent call last):
  File "/home/pi/oprint/local/lib/python2.7/site-packages/OctoPrint-1.2.10.dev25_g1a308a1-py2.7.egg/octoprint/plugin/core.py", line 601, in _import_plugin
    instance = imp.load_module(key, f, filename, description)
  File "/home/pi/oprint/lib/python2.7/site-packages/OctoPrint-1.2.10.dev25_g1a308a1-py2.7.egg/octoprint/plugins/corewizard/__init__.py", line 14, in <module>
    octoprint.plugin.WizardPlugin,
AttributeError: 'module' object has no attribute 'WizardPlugin'
I also get
2016-03-09 18:20:58,123 - py.warnings - WARNING - /home/pi/oprint/local/lib/python2.7/site-packages/requests-2.7.0-py2.7.egg/requests/packages/urllib3/util/ssl_.py:90: InsecurePlatformWarning: A true SSLContext object is not available. This prevents urllib3 from configuring SSL appropriately and may cause certain SSL connections to fail. For more information, see https://urllib3.readthedocs.org/en/latest/security.html#insecureplatformwarning.
  InsecurePlatformWarning
When started as a service I don't even see the startup message in the log. My fork from devel works as a service though.
nophead
on 9 Mar 2016
F--k, I forgot about the spare ok!
foosel
on 9 Mar 2016
THANK YOU @nophead, you just solved a mystery for me! Fixing the spare ok makes maintenance slower on streaming than improve/commPerformance ;) That of course is a bad thing, but at least now I don't have to doubt my sanity anymore.
foosel
on 9 Mar 2016
I have to doubt mine though because earlier I stated the extra OK didn't make it go any faster.
Why is maintenance faster than devel?
Any ideas why I can't start it as a service? Is there another log I can look at?
nophead
on 9 Mar 2016
Why is maintenance faster than devel?
No idea right now, and I'll have to figure that out at a later date.
Any ideas why I can't start it as a service? Is there another log I can look at?
No definitive idea. I regularly switch between devel, maintenance, master and what ever else back and forth. Just make sure to do a python setup.py clean && python setup.py install so left overs from devel don't interfere with other parts (the "Wizard Plugin" error was such a case, caught, but still hints at stuff being mixed). If there is not even a startup message in the log after starting the service, it didn't even start. Normally running it manually will then show you a big fat error explaining the issue, but apparently not here. Make sure the way your init script (the service) is calling it is the same as when you did it manually.
The "InsecurePlatformWarning" thing means that you don't have pyopenssl installed. It should also warn you about that at startup (although I'm not sure right now in which version, maintenance or devel).
foosel
on 9 Mar 2016
Doing a clean fixed the Wizard Plugin problem, thanks.
It still wont start as a service. /etc/default/octoprint has DAEMON=/home/pi/oprint/bin/octoprint and that is the same path that I type to run it.
I can checkout another branch, run python setup.py clean && python setup.py install again and that will start as a service.
With the maintenance branch it seems to start for a moment and then stop but nothing in the log.
(oprint)pi@octopi-black ~/OctoPrint $ sudo service octoprint start
[ ok ] Starting OctoPrint Daemon: OctoPrint.
(oprint)pi@octopi-black ~/OctoPrint $ sudo service octoprint status
[ ok ] OctoPrint is running.
(oprint)pi@octopi-black ~/OctoPrint $ sudo service octoprint status
[FAIL] OctoPrint is not running ... failed!
I can't see how to debug it further.
If pyopenssl is a requirement why isn't that installed as a dependency?
nophead
on 9 Mar 2016
It occurs to me that when I run it from the command line I am not giving any parameters but the service start does. If I run it with bad parameters then it does pause for about 5 seconds before giving a usage message and doesn't put anything in the log. Has the command line changed between devel and maintenance?
nophead
on 9 Mar 2016
Yep I had to remove the server command line parameter from /etc/init.d/octoprint to make maintenance branch start as a service.
It doesn't seem to run any faster as a service though.
nophead
on 10 Mar 2016
With the M28/M29 ok change to maintenance it is a little slower. I get cycle time out about 10ms with 4.5ms latency. This is what I originally expected as logically it should remove the time taken for Marlin to reply with OK.
With upload.py the cycle time is about half and so is the total transfer time.
nophead
on 10 Mar 2016
Sorry, I didn't come to the simple conclusion that you might have adjusted your init script already to work with the new server sub command (or used the adjusted version included in the sources) - devel is backwards compatible (starts up just fine with old parameters), but maintenance naturally isn't forwards compatible.
Just for entertainment value why I continue to experiment (got some ideas last night while waiting to fall asleep), I'm currently seeing very very funny behaviour when testing from the Windows machine instead of the Pi. I removed the extra ok on maintenance and turned the whole comm layer into a command line tool like upload.py, same basic parameters, minimal logging. Result: same completion times between the single-threaded upload.py, the 2-threaded (I think) comm.py and the many-threaded OctoPrint. Tiny file of around 42KB takes 23s on all three O_O
Switched over to the Pi2. upload.py at 6.7s, 2-threaded comm.py 10.7s, OctoPrint 12.1s. So I guess a) there's something up with pyserial's windows implementation that makes it even worse than the delays we are seeing on linux and b) if I want to see progress at all I need to jump through the hoops of developing on the Pi, urgh. But alright...
The odd results on Windows confused me so much that I even installed a serial port monitor and had that log the traffic for me (I verified that at the completion speeds were not influenced whether I used that tool or not).
This is the 2-threaded comm.py:
[12:47:48:237] Read data (COM3)
    6f 6b 0a                                          ok.
[12:47:48:237] Written data (COM3)
    4e 31 38 30 20 47 31 20 58 31 30 39 2e 38 31 20   N180 G1 X109.81
    59 31 31 30 2e 35 32 20 45 33 2e 31 32 34 30 37   Y110.52 E3.12407
    2a 31 31 30 0a                                    *110.
[12:47:48:253] Read data (COM3)
    6f 6b 0a                                          ok.
[12:47:48:254] Written data (COM3)
    4e 31 38 31 20 47 31 20 58 31 30 39 2e 35 36 20   N181 G1 X109.56
    59 31 31 30 2e 37 35 20 45 33 2e 31 33 30 33 31   Y110.75 E3.13031
    2a 39 36 0a                                       *96.
[12:47:48:269] Read data (COM3)
    6f 6b 0a                                          ok.
[12:47:48:270] Written data (COM3)
    4e 31 38 32 20 47 31 20 58 31 30 38 2e 38 32 20   N182 G1 X108.82
    59 31 31 31 2e 33 36 20 45 33 2e 31 34 38 35 30   Y111.36 E3.14850
    2a 31 30 31 0a                                    *101.
[12:47:48:285] Read data (COM3)
    6f 6b 0a                                          ok.
[12:47:48:286] Written data (COM3)
    4e 31 38 33 20 47 31 20 58 31 30 38 2e 36 31 20   N183 G1 X108.61
    59 31 31 31 2e 35 32 20 45 33 2e 31 35 33 32 39   Y111.52 E3.15329
    2a 31 31 31 0a                                    *111.
[12:47:48:301] Read data (COM3)
    6f 6b 0a                                          ok.
[12:47:48:302] Written data (COM3)
    4e 31 38 34 20 47 31 20 58 31 30 35 2e 38 35 20   N184 G1 X105.85
    59 31 31 33 2e 33 38 20 45 33 2e 32 31 35 39 38   Y113.38 E3.21598
    2a 31 30 36 0a                                    *106.
[12:47:48:317] Read data (COM3)
    6f 6b 0a                                          ok.
[12:47:48:318] Written data (COM3)
    4e 31 38 35 20 47 31 20 58 31 30 32 2e 35 34 20   N185 G1 X102.54
    59 31 31 31 2e 36 31 20 45 33 2e 32 38 36 34 38   Y111.61 E3.28648
    2a 31 30 35 0a                                    *105.
[12:47:48:333] Read data (COM3)
    6f 6b 0a                                          ok.
[12:47:48:334] Written data (COM3)
    4e 31 38 36 20 47 31 20 58 39 39 2e 34 30 20 59   N186 G1 X99.40 Y
    31 31 33 2e 31 31 20 45 33 2e 33 35 31 38 39 2a   113.11 E3.35189*
    39 35 0a                                          95.
[12:47:48:349] Read data (COM3)
    6f 6b 0a                                          ok.
[12:47:48:350] Written data (COM3)
    4e 31 38 37 20 47 31 20 58 39 39 2e 34 30 20 59   N187 G1 X99.40 Y
    31 32 31 2e 31 33 20 45 33 2e 35 30 32 38 36 2a   121.13 E3.50286*
    38 32 0a                                          82.
[12:47:48:365] Read data (COM3)
    6f 6b 0a                                          ok.
[12:47:48:366] Written data (COM3)
    4e 31 38 38 20 47 31 20 58 39 36 2e 33 35 20 59   N188 G1 X96.35 Y
    31 32 34 2e 31 38 20 45 33 2e 35 38 33 39 32 2a   124.18 E3.58392*
    38 32 0a                                          82.
[12:47:48:381] Read data (COM3)
    6f 6b 0a                                          ok.
[12:47:48:382] Written data (COM3)
    4e 31 38 39 20 47 31 20 58 38 33 2e 33 39 20 59   N189 G1 X83.39 Y
    31 32 34 2e 31 38 20 45 33 2e 38 32 37 38 33 2a   124.18 E3.82783*
    38 38 0a                                          88.
[12:47:48:397] Read data (COM3)
    6f 6b 0a                                          ok.
[12:47:48:398] Written data (COM3)
    4e 31 39 30 20 47 31 20 58 38 30 2e 33 34 20 59   N190 G1 X80.34 Y
    31 32 31 2e 31 33 20 45 33 2e 39 30 38 38 38 2a   121.13 E3.90888*
    38 37 0a                                          87.
[12:47:48:412] Read data (COM3)
    6f 6b 0a                                          ok.
[12:47:48:414] Written data (COM3)
    4e 31 39 31 20 47 31 20 58 38 30 2e 33 34 20 59   N191 G1 X80.34 Y
    31 30 38 2e 31 37 20 45 34 2e 31 35 32 37 39 2a   108.17 E4.15279*
    38 37 0a                                          87.
[12:47:48:428] Read data (COM3)
    6f 6b 0a                                          ok.
[12:47:48:430] Written data (COM3)
    4e 31 39 32 20 47 31 20 58 38 33 2e 33 39 20 59   N192 G1 X83.39 Y
    31 30 35 2e 31 32 20 45 34 2e 32 33 33 38 32 2a   105.12 E4.23382*
    38 32 0a                                          82.
[12:47:48:444] Read data (COM3)
    6f 6b 0a                                          ok.
[12:47:48:445] Written data (COM3)
    4e 31 39 33 20 47 31 20 46 32 34 30 30 20 45 2d   N193 G1 F2400 E-
    30 2e 32 36 36 31 38 2a 34 36 0a                  0.26618*46.
[12:47:48:460] Read data (COM3)
    6f 6b 0a                                          ok.
[12:47:48:462] Written data (COM3)
    4e 31 39 34 20 47 30 20 46 32 35 32 30 20 58 39   N194 G0 F2520 X9
    37 2e 38 31 20 59 31 30 33 2e 32 37 2a 31 31 39   7.81 Y103.27*119
    0a                                                .
[12:47:48:476] Read data (COM3)
    6f 6b 0a                                          ok.
[12:47:48:478] Written data (COM3)
    4e 31 39 35 20 47 31 20 46 32 34 30 30 20 45 34   N195 G1 F2400 E4
    2e 32 33 33 38 32 2a 32 0a                        .23382*2.
[12:47:48:492] Read data (COM3)
    6f 6b 0a                                          ok.
[12:47:48:493] Written data (COM3)
    4e 31 39 36 20 47 31 20 46 31 31 34 30 20 58 39   N196 G1 F1140 X9
    37 2e 38 30 20 59 31 30 32 2e 39 38 20 45 34 2e   7.80 Y102.98 E4.
    32 33 39 33 34 2a 34 39 0a                        23934*49.
[12:47:48:508] Read data (COM3)
    6f 6b 0a                                          ok.
[12:47:48:509] Written data (COM3)
    4e 31 39 37 20 47 31 20 58 39 37 2e 38 31 20 59   N197 G1 X97.81 Y
    31 30 32 2e 36 39 20 45 34 2e 32 34 34 38 31 2a   102.69 E4.24481*
    38 39 0a                                          89.
[12:47:48:524] Read data (COM3)
    6f 6b 0a                                          ok.
[12:47:48:525] Written data (COM3)
    4e 31 39 38 20 47 31 20 58 39 37 2e 38 38 20 59   N198 G1 X97.88 Y
    31 30 32 2e 31 30 20 45 34 2e 32 35 35 39 34 2a   102.10 E4.25594*
    38 35 0a                                          85.
[12:47:48:540] Read data (COM3)
    6f 6b 0a                                          ok.
[12:47:48:541] Written data (COM3)
    4e 31 39 39 20 47 31 20 58 39 38 2e 30 33 20 59   N199 G1 X98.03 Y
    31 30 31 2e 35 33 20 45 34 2e 32 36 37 30 35 2a   101.53 E4.26705*
    38 35 0a                                          85.
[12:47:48:556] Read data (COM3)
    6f 6b 0a                                          ok.
[12:47:48:557] Written data (COM3)
    4e 32 30 30 20 47 31 20 58 39 38 2e 32 35 20 59   N200 G1 X98.25 Y
    31 30 30 2e 39 37 20 45 34 2e 32 37 38 33 37 2a   100.97 E4.27837*
    38 34 0a                                          84.
[12:47:48:572] Read data (COM3)
    6f 6b 0a                                          ok.
[12:47:48:573] Written data (COM3)
    4e 32 30 31 20 47 31 20 58 39 38 2e 33 38 20 59   N201 G1 X98.38 Y
    31 30 30 2e 37 32 20 45 34 2e 32 38 33 36 34 2a   100.72 E4.28364*
    38 30 0a                                          80.
[12:47:48:588] Read data (COM3)
    6f 6b 0a                                          ok.
[12:47:48:589] Written data (COM3)
    4e 32 30 32 20 47 31 20 58 39 38 2e 37 30 20 59   N202 G1 X98.70 Y
    31 30 30 2e 32 32 20 45 34 2e 32 39 34 38 39 2a   100.22 E4.29489*
    39 35 0a                                          95.
[12:47:48:604] Read data (COM3)
    6f 6b 0a                                          ok.
[12:47:48:605] Written data (COM3)
    4e 32 30 33 20 47 31 20 58 39 39 2e 30 37 20 59   N203 G1 X99.07 Y
    39 39 2e 37 37 20 45 34 2e 33 30 35 37 37 2a 31   99.77 E4.30577*1
    30 32 0a                                          02.
[12:47:48:620] Read data (COM3)
    6f 6b 0a                                          ok.
[12:47:48:621] Written data (COM3)
    4e 32 30 34 20 47 31 20 58 39 39 2e 35 31 20 59   N204 G1 X99.51 Y
    39 39 2e 33 36 20 45 34 2e 33 31 37 31 31 2a 31   99.36 E4.31711*1
    30 30 0a                                          00.
[12:47:48:636] Read data (COM3)
    6f 6b 0a                                          ok.
[12:47:48:637] Written data (COM3)
    4e 32 30 35 20 47 31 20 58 39 39 2e 39 38 20 59   N205 G1 X99.98 Y
    39 39 2e 30 32 20 45 34 2e 33 32 38 31 33 2a 31   99.02 E4.32813*1
    30 35 0a                                          05.
[12:47:48:652] Read data (COM3)
    6f 6b 0a                                          ok.
[12:47:48:653] Written data (COM3)
    4e 32 30 36 20 47 31 20 58 31 30 30 2e 35 30 20   N206 G1 X100.50
    59 39 38 2e 37 33 20 45 34 2e 33 33 39 32 33 2a   Y98.73 E4.33923*
    39 31 0a                                          91.
[12:47:48:668] Read data (COM3)
    6f 6b 0a                                          ok.
[12:47:48:669] Written data (COM3)
    4e 32 30 37 20 47 31 20 58 31 30 31 2e 30 36 20   N207 G1 X101.06
    59 39 38 2e 35 31 20 45 34 2e 33 35 30 35 36 2a   Y98.51 E4.35056*
    38 35 0a                                          85.
[12:47:48:684] Read data (COM3)
    6f 6b 0a                                          ok.
[12:47:48:686] Written data (COM3)
    4e 32 30 38 20 47 31 20 58 31 30 31 2e 33 33 20   N208 G1 X101.33
    59 39 38 2e 34 33 20 45 34 2e 33 35 35 37 36 2a   Y98.43 E4.35576*
    38 38 0a                                          88.
[12:47:48:700] Read data (COM3)
    6f 6b 0a                                          ok.
[12:47:48:702] Written data (COM3)
    4e 32 30 39 20 47 31 20 58 31 30 31 2e 39 31 20   N209 G1 X101.91
    59 39 38 2e 33 32 20 45 34 2e 33 36 36 39 32 2a   Y98.32 E4.36692*
    39 33 0a                                          93.
[12:47:48:716] Read data (COM3)
    6f 6b 0a                                          ok.
[12:47:48:717] Written data (COM3)
    4e 32 31 30 20 47 31 20 58 31 30 32 2e 35 31 20   N210 G1 X102.51
    59 39 38 2e 32 38 20 45 34 2e 33 37 38 32 33 2a   Y98.28 E4.37823*
    38 34 0a                                          84.
[12:47:48:732] Read data (COM3)
    6f 6b 0a                                          ok.
[12:47:48:733] Written data (COM3)
    4e 32 31 31 20 47 31 20 58 31 30 32 2e 37 39 20   N211 G1 X102.79
    59 39 38 2e 32 39 20 45 34 2e 33 38 33 35 35 2a   Y98.29 E4.38355*
    39 31 0a                                          91.
and this is upload.py:
[12:48:29:007] Read data (COM3)
    6f 6b 0a                                          ok.
[12:48:29:008] Written data (COM3)
    47 31 20 58 31 30 30 2e 31 34 20 59 39 39 2e 37   G1 X100.14 Y99.7
    35 20 45 36 2e 38 30 38 33 38 0a                  5 E6.80838.
[12:48:29:023] Read data (COM3)
    6f 6b 0a                                          ok.
[12:48:29:024] Written data (COM3)
    47 31 20 58 39 39 2e 35 34 20 59 31 30 30 2e 32   G1 X99.54 Y100.2
    39 20 45 36 2e 38 31 38 34 36 0a                  9 E6.81846.
[12:48:29:039] Read data (COM3)
    6f 6b 0a                                          ok.
[12:48:29:040] Written data (COM3)
    47 31 20 58 39 39 2e 30 39 20 59 31 30 30 2e 38   G1 X99.09 Y100.8
    39 20 45 36 2e 38 32 37 39 30 0a                  9 E6.82790.
[12:48:29:055] Read data (COM3)
    6f 6b 0a                                          ok.
[12:48:29:056] Written data (COM3)
    47 31 20 58 39 38 2e 37 36 20 59 31 30 31 2e 35   G1 X98.76 Y101.5
    36 20 45 36 2e 38 33 37 32 37 0a                  6 E6.83727.
[12:48:29:071] Read data (COM3)
    6f 6b 0a                                          ok.
[12:48:29:072] Written data (COM3)
    47 31 20 58 39 38 2e 36 33 20 59 31 30 31 2e 39   G1 X98.63 Y101.9
    39 20 45 36 2e 38 34 32 39 32 0a                  9 E6.84292.
[12:48:29:087] Read data (COM3)
    6f 6b 0a                                          ok.
[12:48:29:088] Written data (COM3)
    47 31 20 58 39 38 2e 35 33 20 59 31 30 32 2e 34   G1 X98.53 Y102.4
    38 20 45 36 2e 38 34 39 31 39 0a                  8 E6.84919.
[12:48:29:103] Read data (COM3)
    6f 6b 0a                                          ok.
[12:48:29:104] Written data (COM3)
    47 31 20 58 39 38 2e 35 31 20 59 31 30 32 2e 37   G1 X98.51 Y102.7
    33 20 45 36 2e 38 35 32 32 39 0a                  3 E6.85229.
[12:48:29:119] Read data (COM3)
    6f 6b 0a                                          ok.
[12:48:29:120] Written data (COM3)
    47 31 20 58 39 38 2e 35 30 20 59 31 30 32 2e 39   G1 X98.50 Y102.9
    39 20 45 36 2e 38 35 35 35 35 0a                  9 E6.85555.
[12:48:29:135] Read data (COM3)
    6f 6b 0a                                          ok.
[12:48:29:135] Written data (COM3)
    47 31 20 58 39 38 2e 35 33 20 59 31 30 33 2e 34   G1 X98.53 Y103.4
    39 20 45 36 2e 38 36 31 38 33 0a                  9 E6.86183.
[12:48:29:151] Read data (COM3)
    6f 6b 0a                                          ok.
[12:48:29:152] Written data (COM3)
    47 31 20 58 39 38 2e 36 33 20 59 31 30 33 2e 39   G1 X98.63 Y103.9
    38 20 45 36 2e 38 36 38 31 34 0a                  8 E6.86814.
[12:48:29:167] Read data (COM3)
    6f 6b 0a                                          ok.
[12:48:29:167] Written data (COM3)
    47 31 20 58 39 38 2e 37 38 20 59 31 30 34 2e 34   G1 X98.78 Y104.4
    36 20 45 36 2e 38 37 34 34 37 0a                  6 E6.87447.
[12:48:29:183] Read data (COM3)
    6f 6b 0a                                          ok.
[12:48:29:184] Written data (COM3)
    47 31 20 58 39 39 2e 31 30 20 59 31 30 35 2e 30   G1 X99.10 Y105.0
    38 20 45 36 2e 38 38 33 31 36 0a                  8 E6.88316.
[12:48:29:199] Read data (COM3)
    6f 6b 0a                                          ok.
[12:48:29:200] Written data (COM3)
    47 31 20 58 39 39 2e 32 36 20 59 31 30 35 2e 33   G1 X99.26 Y105.3
    32 20 45 36 2e 38 38 36 38 30 0a                  2 E6.88680.
[12:48:29:215] Read data (COM3)
    6f 6b 0a                                          ok.
[12:48:29:216] Written data (COM3)
    47 31 20 58 39 39 2e 32 36 20 59 31 30 36 2e 39   G1 X99.26 Y106.9
    30 20 45 36 2e 39 30 36 36 32 0a                  0 E6.90662.
[12:48:29:231] Read data (COM3)
    6f 6b 0a                                          ok.
[12:48:29:231] Written data (COM3)
    47 31 20 58 39 39 2e 30 31 20 59 31 30 36 2e 36   G1 X99.01 Y106.6
    39 20 45 36 2e 39 31 30 37 31 0a                  9 E6.91071.
[12:48:29:247] Read data (COM3)
    6f 6b 0a                                          ok.
[12:48:29:247] Written data (COM3)
    47 31 20 58 39 38 2e 35 37 20 59 31 30 36 2e 32   G1 X98.57 Y106.2
    33 20 45 36 2e 39 31 38 36 39 0a                  3 E6.91869.
[12:48:29:263] Read data (COM3)
    6f 6b 0a                                          ok.
[12:48:29:263] Written data (COM3)
    47 31 20 58 39 38 2e 31 36 20 59 31 30 35 2e 36   G1 X98.16 Y105.6
    36 20 45 36 2e 39 32 37 35 34 0a                  6 E6.92754.
[12:48:29:279] Read data (COM3)
    6f 6b 0a                                          ok.
[12:48:29:279] Written data (COM3)
    47 31 20 58 39 37 2e 37 34 20 59 31 30 34 2e 37   G1 X97.74 Y104.7
    39 20 45 36 2e 39 33 39 36 31 0a                  9 E6.93961.
[12:48:29:295] Read data (COM3)
    6f 6b 0a                                          ok.
[12:48:29:295] Written data (COM3)
    47 31 20 58 39 37 2e 35 35 20 59 31 30 34 2e 31   G1 X97.55 Y104.1
    39 20 45 36 2e 39 34 37 35 37 0a                  9 E6.94757.
[12:48:29:311] Read data (COM3)
    6f 6b 0a                                          ok.
[12:48:29:311] Written data (COM3)
    47 31 20 58 39 37 2e 34 34 20 59 31 30 33 2e 36   G1 X97.44 Y103.6
    31 20 45 36 2e 39 35 34 39 36 0a                  1 E6.95496.
[12:48:29:327] Read data (COM3)
    6f 6b 0a                                          ok.
[12:48:29:327] Written data (COM3)
    47 31 20 58 39 37 2e 34 31 20 59 31 30 33 2e 33   G1 X97.41 Y103.3
    30 20 45 36 2e 39 35 38 37 38 0a                  0 E6.95878.
[12:48:29:343] Read data (COM3)
    6f 6b 0a                                          ok.
[12:48:29:343] Written data (COM3)
    47 30 20 46 39 30 30 30 20 58 39 37 2e 38 31 20   G0 F9000 X97.81
    59 31 30 33 2e 32 36 20 5a 30 2e 37 30 0a         Y103.26 Z0.70.
[12:48:29:359] Read data (COM3)
    6f 6b 0a                                          ok.
[12:48:29:359] Written data (COM3)
    47 31 20 46 39 36 30 20 58 39 37 2e 38 30 20 59   G1 F960 X97.80 Y
    31 30 32 2e 39 38 20 45 36 2e 39 36 32 33 35 0a   102.98 E6.96235.
[12:48:29:375] Read data (COM3)
    6f 6b 0a                                          ok.
[12:48:29:375] Written data (COM3)
    47 31 20 58 39 37 2e 38 34 20 59 31 30 32 2e 33   G1 X97.84 Y102.3
    39 20 45 36 2e 39 36 39 38 32 0a                  9 E6.96982.
[12:48:29:391] Read data (COM3)
    6f 6b 0a                                          ok.
[12:48:29:391] Written data (COM3)
    47 31 20 58 39 37 2e 38 38 20 59 31 30 32 2e 31   G1 X97.88 Y102.1
    32 20 45 36 2e 39 37 33 32 34 0a                  2 E6.97324.
[12:48:29:407] Read data (COM3)
    6f 6b 0a                                          ok.
[12:48:29:407] Written data (COM3)
    47 31 20 58 39 38 2e 31 34 20 59 31 30 31 2e 32   G1 X98.14 Y101.2
    34 20 45 36 2e 39 38 34 37 35 0a                  4 E6.98475.
[12:48:29:423] Read data (COM3)
    6f 6b 0a                                          ok.
[12:48:29:423] Written data (COM3)
    47 31 20 58 39 38 2e 32 35 20 59 31 30 30 2e 39   G1 X98.25 Y100.9
    39 20 45 36 2e 39 38 38 31 31 0a                  9 E6.98811.
[12:48:29:439] Read data (COM3)
    6f 6b 0a                                          ok.
[12:48:29:439] Written data (COM3)
    47 31 20 58 39 38 2e 35 33 20 59 31 30 30 2e 34   G1 X98.53 Y100.4
    36 20 45 36 2e 39 39 35 36 33 0a                  6 E6.99563.
[12:48:29:455] Read data (COM3)
    6f 6b 0a                                          ok.
[12:48:29:455] Written data (COM3)
    47 31 20 58 39 38 2e 38 39 20 59 39 39 2e 39 37   G1 X98.89 Y99.97
    20 45 37 2e 30 30 33 32 33 0a                      E7.00323.
[12:48:29:471] Read data (COM3)
    6f 6b 0a                                          ok.
[12:48:29:471] Written data (COM3)
    47 31 20 58 39 39 2e 30 36 20 59 39 39 2e 37 38   G1 X99.06 Y99.78
    20 45 37 2e 30 30 36 34 36 0a                      E7.00646.
[12:48:29:487] Read data (COM3)
    6f 6b 0a                                          ok.
[12:48:29:487] Written data (COM3)
    47 31 20 58 39 39 2e 35 30 20 59 39 39 2e 33 36   G1 X99.50 Y99.36
    20 45 37 2e 30 31 34 30 38 0a                      E7.01408.
[12:48:29:503] Read data (COM3)
    6f 6b 0a                                          ok.
[12:48:29:503] Written data (COM3)
    47 31 20 58 31 30 30 2e 32 35 20 59 39 38 2e 38   G1 X100.25 Y98.8
    36 20 45 37 2e 30 32 35 33 39 0a                  6 E7.02539.
[12:48:29:519] Read data (COM3)
    6f 6b 0a                                          ok.
[12:48:29:519] Written data (COM3)
    47 31 20 58 31 30 30 2e 34 39 20 59 39 38 2e 37   G1 X100.49 Y98.7
    33 20 45 37 2e 30 32 38 37 35 0a                  3 E7.02875.
[12:48:29:535] Read data (COM3)
    6f 6b 0a                                          ok.
[12:48:29:535] Written data (COM3)
    47 31 20 58 31 30 31 2e 33 33 20 59 39 38 2e 34   G1 X101.33 Y98.4
    33 20 45 37 2e 30 33 39 39 34 0a                  3 E7.03994.
[12:48:29:551] Read data (COM3)
    6f 6b 0a                                          ok.
[12:48:29:551] Written data (COM3)
    47 31 20 58 31 30 32 2e 32 33 20 59 39 38 2e 32   G1 X102.23 Y98.2
    39 20 45 37 2e 30 35 31 33 35 0a                  9 E7.05135.
[12:48:29:567] Read data (COM3)
    6f 6b 0a                                          ok.
[12:48:29:567] Written data (COM3)
    47 31 20 58 31 30 32 2e 34 39 20 59 39 38 2e 32   G1 X102.49 Y98.2
    38 20 45 37 2e 30 35 34 36 39 0a                  8 E7.05469.
[12:48:29:583] Read data (COM3)
    6f 6b 0a                                          ok.
[12:48:29:583] Written data (COM3)
    47 31 20 58 31 30 33 2e 31 30 20 59 39 38 2e 33   G1 X103.10 Y98.3
    32 20 45 37 2e 30 36 32 32 38 0a                  2 E7.06228.
[12:48:29:599] Read data (COM3)
    6f 6b 0a                                          ok.
[12:48:29:599] Written data (COM3)
    47 31 20 58 31 30 33 2e 33 36 20 59 39 38 2e 33   G1 X103.36 Y98.3
    36 20 45 37 2e 30 36 35 36 39 0a                  6 E7.06569.
[12:48:29:615] Read data (COM3)
    6f 6b 0a                                          ok.
[12:48:29:615] Written data (COM3)
    47 31 20 58 31 30 34 2e 32 35 20 59 39 38 2e 36   G1 X104.25 Y98.6
    32 20 45 37 2e 30 37 37 32 30 0a                  2 E7.07720.
[12:48:29:631] Read data (COM3)
    6f 6b 0a                                          ok.
[12:48:29:631] Written data (COM3)
    47 31 20 58 31 30 34 2e 34 39 20 59 39 38 2e 37   G1 X104.49 Y98.7
    33 20 45 37 2e 30 38 30 35 36 0a                  3 E7.08056.
[12:48:29:647] Read data (COM3)
    6f 6b 0a                                          ok.
[12:48:29:647] Written data (COM3)
    47 31 20 58 31 30 35 2e 30 32 20 59 39 39 2e 30   G1 X105.02 Y99.0
    32 20 45 37 2e 30 38 38 30 38 0a                  2 E7.08808.
[12:48:29:663] Read data (COM3)
    6f 6b 0a                                          ok.
[12:48:29:663] Written data (COM3)
    47 31 20 58 31 30 35 2e 35 31 20 59 39 39 2e 33   G1 X105.51 Y99.3
    37 20 45 37 2e 30 39 35 36 38 0a                  7 E7.09568.
[12:48:29:679] Read data (COM3)
    6f 6b 0a                                          ok.
[12:48:29:679] Written data (COM3)
    47 31 20 58 31 30 35 2e 37 30 20 59 39 39 2e 35   G1 X105.70 Y99.5
    34 20 45 37 2e 30 39 38 39 31 0a                  4 E7.09891.
[12:48:29:695] Read data (COM3)
    6f 6b 0a                                          ok.
[12:48:29:695] Written data (COM3)
    47 31 20 58 31 30 36 2e 31 32 20 59 39 39 2e 39   G1 X106.12 Y99.9
    38 20 45 37 2e 31 30 36 35 33 0a                  8 E7.10653.
[12:48:29:710] Read data (COM3)
    6f 6b 0a                                          ok.
[12:48:29:711] Written data (COM3)
    47 31 20 58 31 30 36 2e 36 32 20 59 31 30 30 2e   G1 X106.62 Y100.
    37 33 20 45 37 2e 31 31 37 38 34 0a               73 E7.11784.
[12:48:29:726] Read data (COM3)
    6f 6b 0a                                          ok.
[12:48:29:727] Written data (COM3)
    47 31 20 58 31 30 36 2e 37 35 20 59 31 30 30 2e   G1 X106.75 Y100.
    39 37 20 45 37 2e 31 32 31 32 30 0a               97 E7.12120.
[12:48:29:742] Read data (COM3)
    6f 6b 0a                                          ok.
[12:48:29:743] Written data (COM3)
    47 31 20 58 31 30 37 2e 30 35 20 59 31 30 31 2e   G1 X107.05 Y101.
    38 31 20 45 37 2e 31 33 32 33 39 0a               81 E7.13239.
[12:48:29:758] Read data (COM3)
    6f 6b 0a                                          ok.
[12:48:29:759] Written data (COM3)
    47 31 20 58 31 30 37 2e 31 39 20 59 31 30 32 2e   G1 X107.19 Y102.
    37 31 20 45 37 2e 31 34 33 38 30 0a               71 E7.14380.
[12:48:29:774] Read data (COM3)
    6f 6b 0a                                          ok.
[12:48:29:775] Written data (COM3)
    47 31 20 58 31 30 37 2e 32 30 20 59 31 30 32 2e   G1 X107.20 Y102.
    39 37 20 45 37 2e 31 34 37 31 34 0a               97 E7.14714.
[12:48:29:790] Read data (COM3)
    6f 6b 0a                                          ok.
[12:48:29:791] Written data (COM3)
    47 31 20 58 31 30 37 2e 31 36 20 59 31 30 33 2e   G1 X107.16 Y103.
    35 37 20 45 37 2e 31 35 34 36 38 0a               57 E7.15468.
[12:48:29:806] Read data (COM3)
    6f 6b 0a                                          ok.
[12:48:29:807] Written data (COM3)
    47 31 20 58 31 30 37 2e 30 35 20 59 31 30 34 2e   G1 X107.05 Y104.
    31 34 20 45 37 2e 31 36 31 39 37 0a               14 E7.16197.
[12:48:29:822] Read data (COM3)
    6f 6b 0a                                          ok.
[12:48:29:823] Written data (COM3)
    47 31 20 58 31 30 36 2e 38 33 20 59 31 30 34 2e   G1 X106.83 Y104.
    38 30 20 45 37 2e 31 37 30 36 38 0a               80 E7.17068.
Delay between ok and write of next line around 2ms for comm.py and around 1ms for upload.py, delay between ok and ok ~15-16ms for both.
Sadly, this is an "USB only" connection (no good way to access the decoded serial signal via hardware), and the USB converter I used on an input on the controller in order to be able attach some probes to the whole thing proofed to make things too slow to give comparable results. I mean, look at that:

Yes, that's roughly 85ms between the code sending a full line and the ok coming back. Comport monitor is seeing similar values. So I guess that experimental setup is not very helpful for figuring out any real values either.
foosel
on 10 Mar 2016
I think the issue with a command line change between versions and branches is that yes you get a new service script that matches the version that you checkout but that doesn't get installed automatically when you run setup.py. I set up the service manually only recently following the wiki instructions because my RPI is so old it was starting octoprint from rc.local.
The fundamental problem with sending packets over USB serial is the OS has to decide when to dispatch a part filled USB packet as it accumulates characters, potentially one at a time. Then it gets received as one or more packets at the other end, sent out serially and then parsed back into a packet by Marlin, madness! That same happens on the return trip. When the FTDI chip gets ok\n how does it know when to dispatch an almost empty USB packet with that in? It may get more characters a few ms later.
It is much more efficient to send each protocol packet in one USB packet but then you need to write your own drivers. Not difficult but then you have to get it certified for each OS and buy VID and PID numbers and all that crap. That is why I prefer Ethernet. You can just send UDP datagrams from user space in Python and it works on any OS and is very low latency on a hard wired connection.
Windows has a device manager advanced setting for USB serial ports called Latency Timer. I think this sets how long it waits for more characters before dispatching a packet.
nophead
on 10 Mar 2016
When I set the Windows latency timer to 1ms upload.py on Win7 is much faster than my RPi.
When sending a 13350 line file I get the following transfer times: -
RPI model B 115200 serial 75s
RPI model B 250000 USB 69s
Win7 64bit Core I7 @ 2.9GHz 250000 USB 41s nearly all the time is spent in the receive since that also includes the send time.
The default latency on the serial port was 16ms and that made the receive time and hence most of the cycle time 16.1ms. The total transfer time was then 215s.
So it looks like you may have your latency timer set at 85ms?
nophead
on 10 Mar 2016
I'm seeing transfer rates that are similar to those on the RPi2 now with upload.py.
I checked the latency setting for the other USB adapter I used for the direct connection this afternoon (the screenshot above was for the one integrated on the printer controller itself), and that also was set to 16ms, plus I was seeing the 85ms delay on Linux (1ms) as well. So there's still an issue somewhere in that setup, making the actual signal analysis tricky. But at least the combination of serial port monitor and regular USB connection now behaves identically under Windows and Linux, which is a huge relief.
I'm also seeing roughly the same performance between upload.py and standalone comm.py after changing implementation of comm.py for fixing #1271 (plus fixing #1272 and #1273 ). From within OctoPrint it's still much slower, however I haven't yet used any of the performance changes, so it could be both the multithreadedness causing issues as well as some of the potential bottlenecks I'd already identified and solved in improve/commPerformance. I still have that branch around on disk, so I can backport stuff now and experiment anew.
foosel
on 10 Mar 2016
Note the file I am using for testing is 549KB, so when you said "42KB takes 23s on all three" it is a lot slower than I am seeing. For completeness on OctoPrint at 115200 it takes 139s compared to 75s for upload.py.
A good metric is simply to divide the total time by the number of lines to get the cycle time. Since the receive time in upload.py is actually the total line time plus Marlin processing, subtracting that from the cycle time gives the host latency (not including the OS / drivers).
RPi B 115200 : Done in 75.2s, cycle: 5.6ms, latency: 0.5ms
RPi B 250000 : Done in 67.8s, cycle: 5.1ms, latency: 0.7ms
PC 250000 : Done in 40.3s, cycle: 3.0ms, latency: 0.2ms
nophead
on 10 Mar 2016
I just noticed that after an SD upload OctoPrint refreshes the file list twice with M20.
Here: https://github.com/nophead/OctoPrint/blob/maintenance/src/octoprint/util/comm.py#L1497
and here: https://github.com/nophead/OctoPrint/blob/maintenance/src/octoprint/util/comm.py#L1092. I.e. both when it sends M29 and when it gets the response from M29. I think it should only be the latter.
nophead
on 11 Mar 2016
I also noticed that. Created #1274 for it just now.
In the meantime I adjusted upload.py to output the approx. lines per second and ms per line, and to also support checksumming & numbering the sent lines, because otherwise it can't really be used as a reference implementation suitable for comparing performance of the comm layer if it misses that step that is necessary for most printer's out there. Adjusted version is here.
Adding line numbers and checksums added ~1ms per line. Testing against a WIP version of the comm layer I'm currently seeing 5.705 ms/line in upload.py (175.293 lines/s), 6.431 ms/line in comm.py (155.495 lines/s) and 7.059 ms/line in OctoPrint proper (141.657 lines/s).
foosel
on 11 Mar 2016
Your functional method for calculating the checksum:
checksum = reduce(lambda x, y: x ^ y, map(ord, to_send))
takes 0.4ms on average.
This simple loop is twice as fast:
checksum = 0
for c in to_send: checksum ^= ord(c)
So it shaves off 0.2 ms per cycle, not much in the scheme of things, but I am surprised how slow Python is on the RPi.
nophead
on 11 Mar 2016
A bit late to show, but I think I will add some of my own observations. TL;DR "ftdi / uart hardware matters"
My main print controller is a Arduino mega clone, with a cheap ch341 ftdi. Today something in my kernel/new computer/something crapped out and I could not communicate reliable with the arduino.
So I dragged out a collection of other ftdi adapters: cp2103, pl2303 and a completely unknown one.
RPi B. Gina's upload.py. A file containing 5000 G1 commands. 115200 baud. Marlin configured to use uart 1.
Results:
RPi uart: 348.791 lines/s (through a 2n7000 based level shifter)
cp2103 : 61.020 lines/s
pl2303: 257.540 lines/s
ch341: 192.233 lines/s (wired connection uart0 to uart1 on the arduino, a bit hackish..)
Some of the inconsistency and fuss in my reports earlier are probably due to me not using the same serial hardware devices between the individual tests.
MortenGuldager
on 11 Mar 2016
@nophead great find, will adapt this in comm.py asap (same code really). I actually could have remembered that loops are often faster than the functional constructs...
@MortenGuldager those are some very helpful insights. Considering that most printers out there use one or the other usb serial adapter, I wonder how many printers out there run at way lower speed than theoretically possible due to "wrong" chipsets or - like in my case yesterday in my Windows tests - the wrong latency setting in the driver. Not saying that OctoPrint's comm layer is never at fault mind you, but it makes me wonder if I haven't tackled some support requests in the wrong way the past years.
foosel
on 11 Mar 2016
Just for the record, I benchmarked various implementation variants of the checksum function, really a nice find of you @nophead:
$ python checksum_benchmark.py

Benchmark Report
================

BenchmarkChecksumCalculation
----------------------------

                       name | rank | runs |     mean |        sd | timesBaseline
----------------------------|------|------|----------|-----------|--------------
concatenating nonfunctional |    1 |  100 | 0.005404 | 0.0008305 |           1.0
              concatenating |    2 |  100 |  0.01021 |  0.001459 |  1.8884364485
                 new format |    3 |  100 |  0.01107 |   0.00186 | 2.04811849319
                 old format |    4 |  100 |  0.01169 |  0.001685 | 2.16313488247

Each of the above 400 runs were run in random, non-consecutive order by
`benchmark` v0.1.5 (http://jspi.es/benchmark) with Python 2.7.10
Windows-7-AMD64 on 2016-03-12 08:36:24.
Similar relative times on an RPi B, but 35 times slower!
Benchmark Report
================

BenchmarkChecksumCalculation
----------------------------

                       name | rank | runs |   mean |       sd | timesBaseline
----------------------------|------|------|--------|----------|--------------
concatenating nonfunctional |    1 |  100 |  0.214 | 0.005365 |           1.0
                 new format |    2 |  100 | 0.4031 | 0.006683 | 1.88355473265
              concatenating |    3 |  100 | 0.4247 | 0.007389 | 1.98450098227
                 old format |    4 |  100 | 0.4546 | 0.006029 | 2.12393446906

Each of the above 400 runs were run in random, non-consecutive order by
`benchmark` v0.1.5 (http://jspi.es/benchmark) with Python 2.7.3
Linux-3.6.11+-armv6l on 2016-03-12 09:03:40.
On RPi3 five times faster than RPi B!
Benchmark Report
================

BenchmarkChecksumCalculation
----------------------------

                       name | rank | runs |    mean |        sd | timesBaseline
----------------------------|------|------|---------|-----------|--------------
concatenating nonfunctional |    1 |  100 | 0.04041 | 0.0004763 |           1.0
              concatenating |    2 |  100 | 0.07371 |  0.000761 | 1.82408656543
                 new format |    3 |  100 |  0.0739 |  0.001207 | 1.82891633544
                 old format |    4 |  100 | 0.07928 | 0.0009364 | 1.96214511767

Each of the above 400 runs were run in random, non-consecutive order by
`benchmark` v0.1.5 (http://jspi.es/benchmark) with Python 2.7.9
Linux-4.1.18-v7+-armv7l on 2016-03-12 09:13:42.
Progress. I have now made my own version of upload.py, a complete rewrite. It works like Gina's except for a few things:
- I rolled my own readline instead of the one from pyserial. Behind pyserial's readline is read, pyserial reads only one byte at a time, easy to optimize.
- I have a window with outstanding commands. Sending next command before reading the "ok" from the previous. With a max of 4 "open" commands at a time line is almost full.
With these optimizations I can now upload 1250 "G0 Y2" commands per second on my old RPi at 250000 baud.
Unfortunately my patch to pyserial (new module that inherits) is posix only, and also the transmit window might be a Marlin only feature.
MortenGuldager
on 20 Mar 2016
My money would be on the 4 open commands making the difference here. OctoPrint used to accidentally do something similar (by simply sending until the send blocked due to the buffer being full). The problem with this is that some controller/serial implementations seem to not like that (buffer overwrites or full out crashes as a result), and that a very large number of firmware setups out there make it impossible to track the buffer fill state due to commands being acknowledged in a different order than they were received in. Thing is, the firmware-side read buffer has a byte size, so in order to properly track it's fill state you need to track bytes sent vs. acknowledged, not lines sent vs. acknowledged. And that get's somewhat killed by the above issue, which you also can't reliably identify (I only noticed it once I tried to track responses received for sent commands in an older version of my comm layer rewrite attempts, when I suddenly saw temperature responses to move commands).
So what I could do is add a mechanism of forcing some lines into the buffer at the start of a print to get rid of the true ping-pong, but that could lead to all kind of problems the fixes in 1.2.x actually are supposed to avoid. So it would have to be something people would need to opt-in for.
In related news, I got a bit curious with regards to how much pyserial vs. other environmental factors are at play here. So I whipped up a version of upload.py in java (yeah, I know). Funnily enough I get next to identical results there:
Python: Finished in 17.746s. Approx. transfer rate of 160.207 lines/s or 6.242 ms per line
Java: Finished in 17s. Approx. transfer rate of 162.96126 lines/s or 6.1364274 ms per line.
The Java implementation uses jssc, which in turn uses a native component in C via JNI for the actual serial port access.
I was _very_ surprised to see such identical values (I did multiple tests of course, not just one).
foosel
on 21 Mar 2016
And another data point, this time in probably completely horrible C:
Finished in 15.326000s. Approx. transfer rate of 185.501755 lines/s or 5.390784 ms per line.
(1ms less if line numbers are disabled).
foosel
on 22 Mar 2016
Any developments on this issue? It's still present, and plagues me.
Comparison between the same gcode file, on the same raspberry pi (Pi Zero): left is Octoprint, right is Repetier Server. Quite a dramatic difference.
The test object is a small 10mm cylinder with 256 sides, printed at 40mm/s.
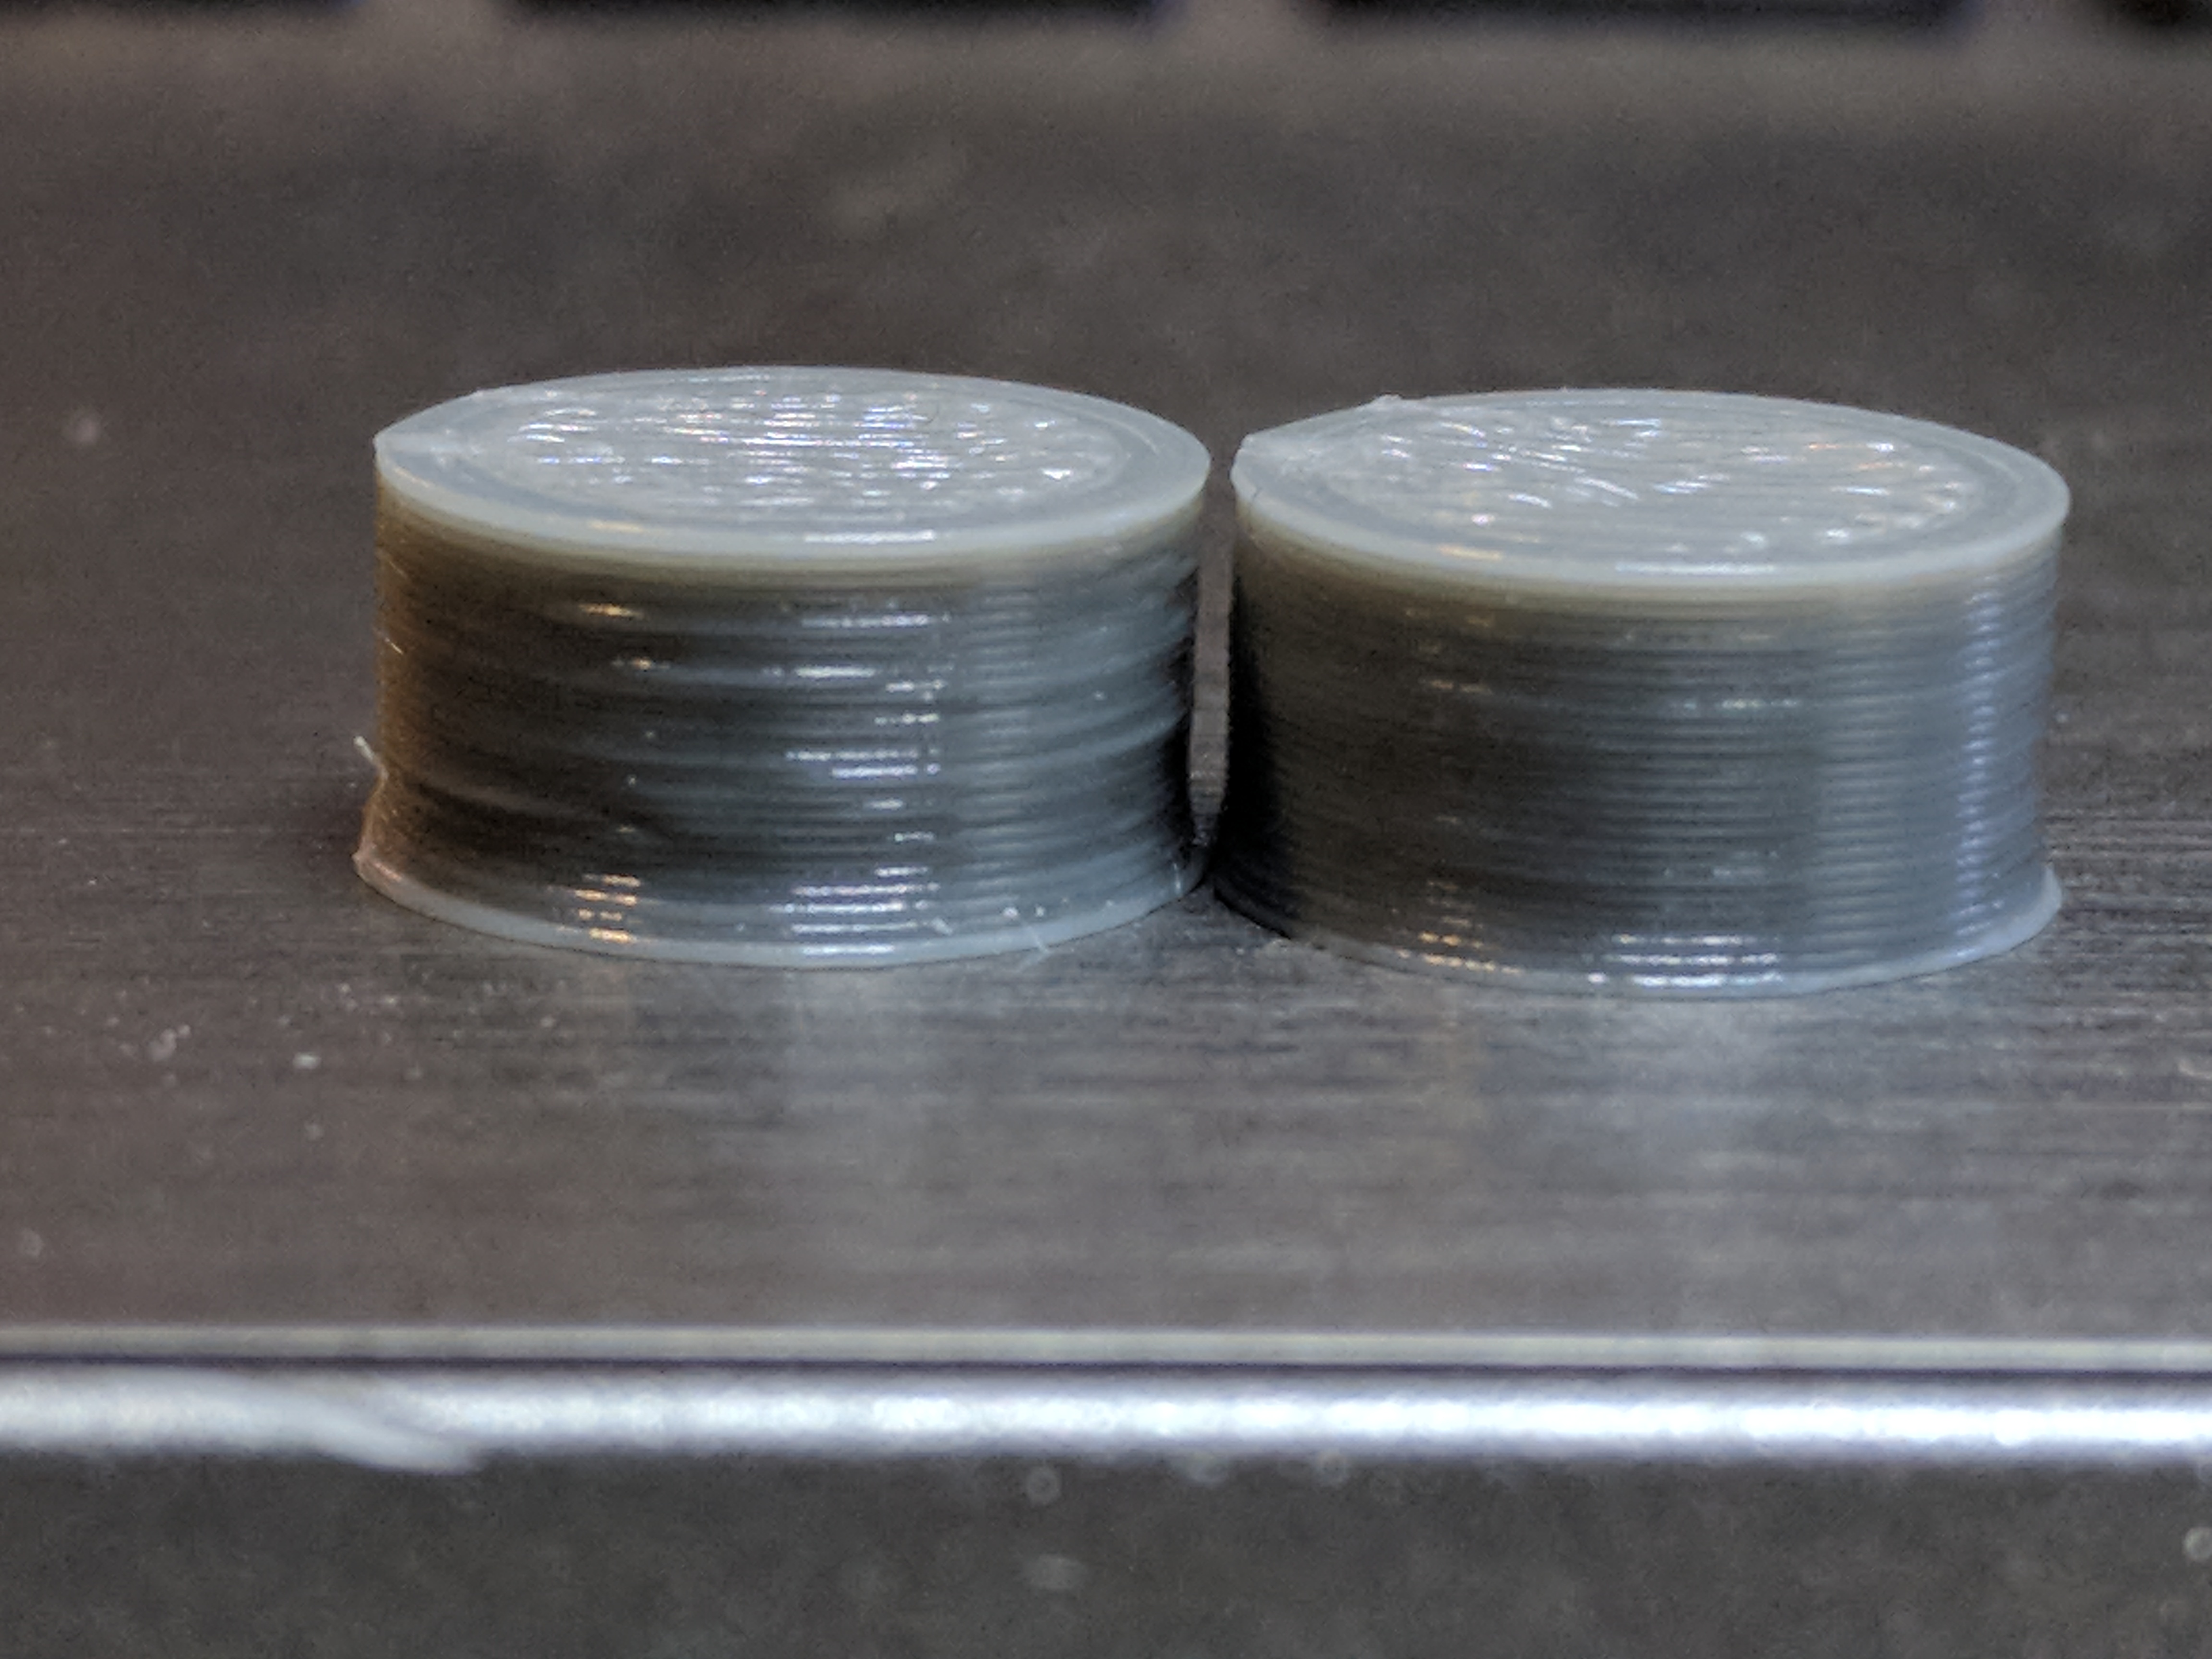
 lokster
on 7 Nov 2017
lokster
on 7 Nov 2017
A rewrite of the comm layer is scheduled for 1.4.0. Until then based on my personal experience I'd recommend to print stuff with loads of short segments rather from a Pi2 or Pi3 (I don't see any stuttering there myself).
10mm cylinder with 256 sides
Why? Honest question.
foosel
on 8 Nov 2017
I print a lot of gears, many segments makes them run smoother. They almost always turn out better if printed directly from a SD card than if sent over a serial interface in real time. Quite often Marlin empties it's queue which leads to the stuttering .
Unfortunately, uploading the file to SD via serial is also a very slow process, mostly due to the un-windowed communication protocol in use.
The "real" solution would involve a add on to the firmware (Marlin) as well, something that allowed us up upload data in near wire speed, not waiting for acknowledge between every single line of g-code.
MortenGuldager
on 8 Nov 2017
Why? Honest question.
It was a test case, to better illustrate the issue without wasting too much time & material. But I have the same issue with regular prints too - especially with smaller "organic" models like skulls, dragons etc. with smooth curved surfaces.
I have done some Marlin tweaks that hide the issue a bit (mostly, increasing the buffer sizes) - because the "default" configuration has quite the small buffers.
The issue is still present though - although not as dramatic. And I still get much smoother results with repetier server (which I don't like and don't want to use... let alone pay for) :)
In fact, repetier server's result is comparable to the one I get from SD card.
Even the print time is considerably shorter. For example, this cylinder prints in about 2min 35 sec with Octoprint, and just 1min 50sec with Repetier Server. Same Pi Zero (and the same raspbian installation), same gcode.
Note: my idea is not to whine and trash Octoprint, just trying to improve it :)
Let me share what I had found regarding Marlin, even if it's a bit off-topic (it might help others):
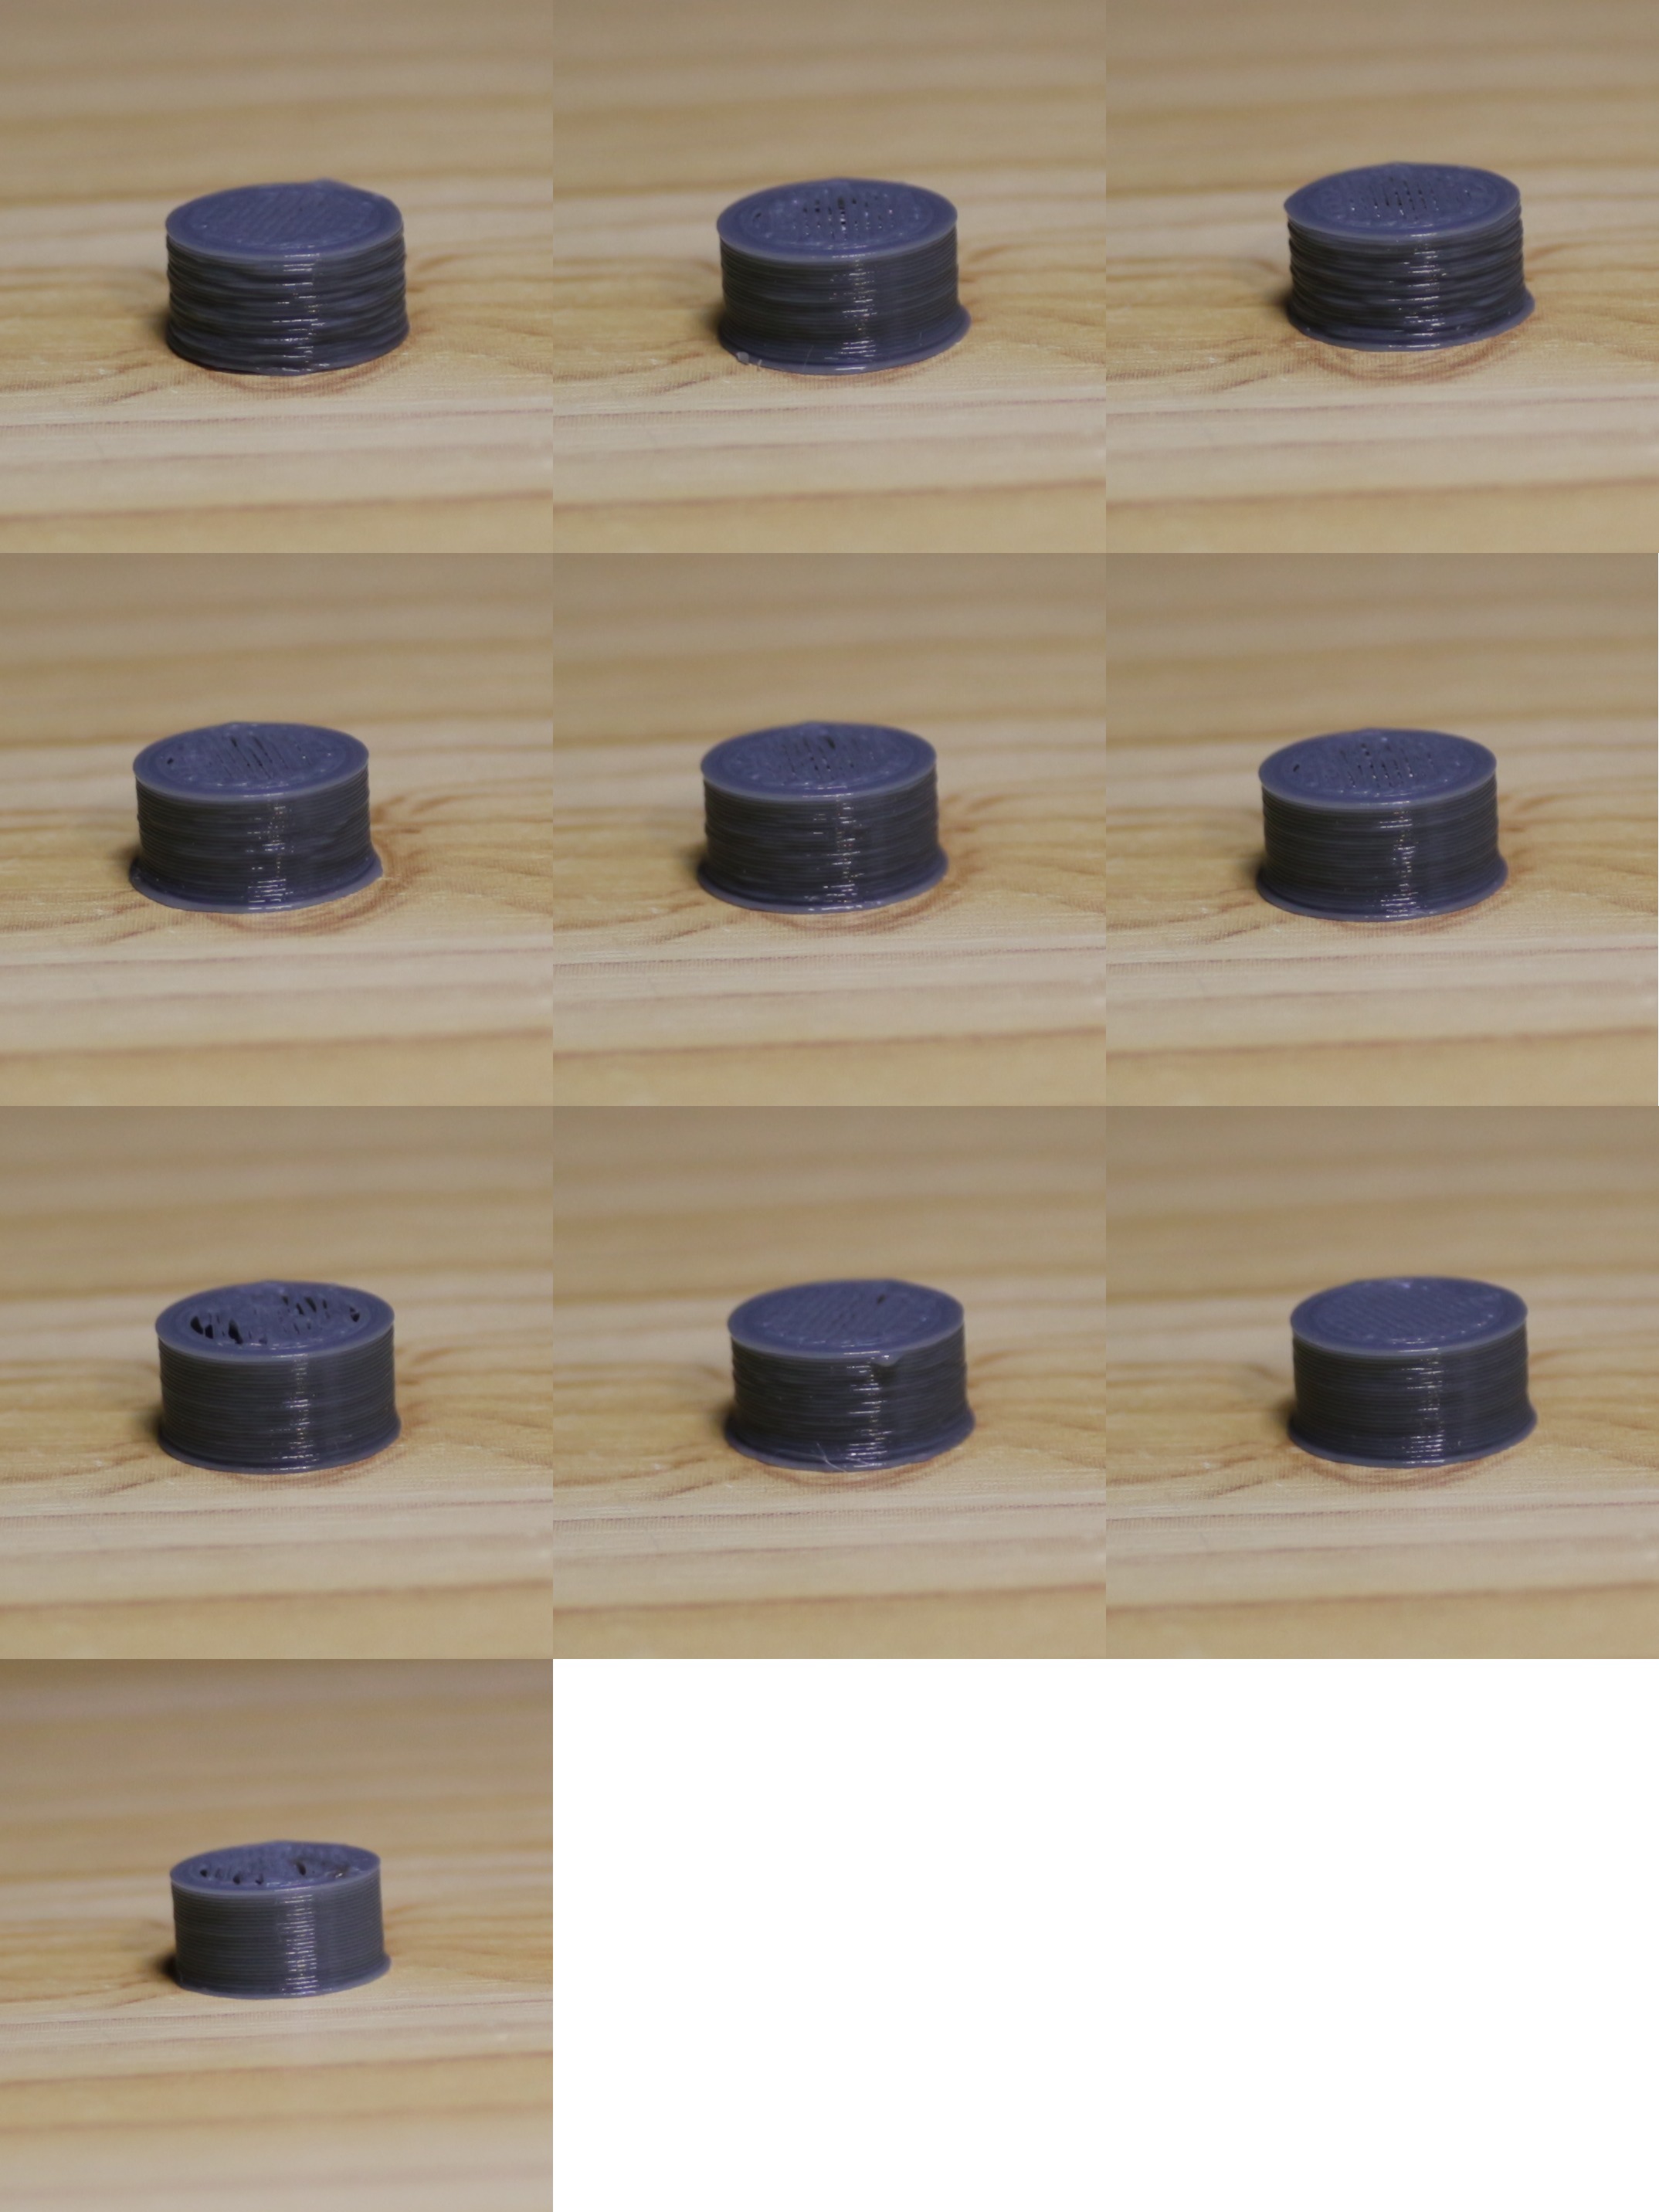
Image numbering: first row 1,2,3, second row 4,5,6 etc.
Octoprint via USB
1 - BLOCK_BUFFER_SIZE = 16; BUFSIZE = 4; TX_BUFFER_SIZE = 0; DEFAULT_MINSEGMENTTIME = 20000 Print time: 00:02:31 (stock marlin)
2 - BLOCK_BUFFER_SIZE = 128; BUFSIZE = 4; TX_BUFFER_SIZE = 0; DEFAULT_MINSEGMENTTIME = 20000. Print time: 00:02:29
3 - BLOCK_BUFFER_SIZE = 16; BUFSIZE = 32; TX_BUFFER_SIZE = 0; DEFAULT_MINSEGMENTTIME = 20000. Print time: 00:02:29
5 - BLOCK_BUFFER_SIZE = 128; BUFSIZE = 32; TX_BUFFER_SIZE = 4; DEFAULT_MINSEGMENTTIME = 20000. Print time: 00:02:33
8 - BLOCK_BUFFER_SIZE = 128; BUFSIZE = 32; TX_BUFFER_SIZE = 0; DEFAULT_MINSEGMENTTIME = 20000. Print time: 00:02:35
4 - BLOCK_BUFFER_SIZE = 128; BUFSIZE = 32; TX_BUFFER_SIZE = 0; DEFAULT_MINSEGMENTTIME = 20000 Print time: 00:02:22
7 - BLOCK_BUFFER_SIZE = 128; BUFSIZE = 32; TX_BUFFER_SIZE = 0; DEFAULT_MINSEGMENTTIME = 50000. Print time: 00:02:37
6 - BLOCK_BUFFER_SIZE = 128; BUFSIZE = 32; TX_BUFFER_SIZE = 4; DEFAULT_MINSEGMENTTIME = 50000. Print time: 00:02:26
9 - BLOCK_BUFFER_SIZE = 128; BUFSIZE = 32; TX_BUFFER_SIZE = 4; DEFAULT_MINSEGMENTTIME = 75000. Print time: 00:02:25
Repetier Server via USB
10 - BLOCK_BUFFER_SIZE = 128; BUFSIZE = 32; TX_BUFFER_SIZE = 0; DEFAULT_MINSEGMENTTIME = 50000. Print time: 00:01:50
Repetier's result (image 10 is obviously the best, followed by image 7.
The default small buffers in Marlin just make the things worse.
lokster
on 8 Nov 2017
...print stuff with loads of short segments rather from a Pi2 or Pi3 (I don't see any stuttering there myself)
How do you know you don't see any stuttering ? :) I think you mean you don't observe any obvious stuttering, but it is surely there. I setup an IO pin on Marlin (with OP on the Pi2) to trigger when the queue was drained and it absolutely still does (albeit not as grotesquely as on my orignal B+ ).
The "real" solution would involve a add on to the firmware (Marlin) as well, something that allowed us up upload data in near wire speed, not waiting for acknowledge between every single line of g-code.
Marlin side is done and merged on both 1.1 and 2.0 dev branches : https://github.com/MarlinFirmware/Marlin/pull/7818 https://github.com/MarlinFirmware/Marlin/pull/7459
Not a whole lot of testing so could certainly be some stumbling blocks once any hosts are outfitted to support it, but you gotta start somewhere…
 fiveangle
on 8 Nov 2017
fiveangle
on 8 Nov 2017
There is basically a finite limit to the number of line segments per
second. I don't use line segments shorter than half my filament width and
print at 50mm/s. I never see the problem with things I have designed myself.
On 8 November 2017 at 15:55, Dave Johnson notifications@github.com wrote:
...print stuff with loads of short segments rather from a Pi2 or Pi3 (I
don't see any stuttering there myself)How do you know you don't see any stuttering ? :) I think you mean you
don't observe any obvious stuttering, but it is surely there. I setup an IO
pin on the Pi2 to trigger when the queue was drained and it absolutely
still does (albeit not as grotesquely as on my orignal B+ ).The "real" solution would involve a add on to the firmware (Marlin) as
well, something that allowed us up upload data in near wire speed, not
waiting for acknowledge between every single line of g-code.Marlin side is done and merged on both 1.1 and 2.0 dev branches :
MarlinFirmware/Marlin#7818
https://github.com/MarlinFirmware/Marlin/pull/7818
MarlinFirmware/Marlin#7459
https://github.com/MarlinFirmware/Marlin/pull/7459Not a whole lot of testing so could certainly be some stumbling blocks
once any hosts are outfitted to support it, but you gotta start somewhere…—
You are receiving this because you were mentioned.
Reply to this email directly, view it on GitHub
https://github.com/foosel/OctoPrint/issues/450#issuecomment-342861370,
or mute the thread
https://github.com/notifications/unsubscribe-auth/AAijhXDub-jWsmAQ8wwhi06KBmfgOqr6ks5s0c7-gaJpZM4Bzp__
.
nophead
on 8 Nov 2017
The thing is, it's obvious we are not hitting hardware/mechanical limitation here, because the same setup (gcode, raspberry pi and printer) works considerably better with repetier server or a simple gcode sender.
So, using slower print speed and lower mesh resolution just hides the problem, and is not really a solution.
lokster
on 8 Nov 2017
True but there is no point in printing segments shorter than half your filament width. The filament smooths out the curve so you don't need more detail in the curve than it can reproduce.
nophead
on 8 Nov 2017
First, you mean "half the nozzle width", not "half the filament width". Because "half the filament width" is nonsense.
Second - the question is not whether there is a point or there isn't. This is a subject of another discussion, unrelated to octoprint. "There is no point" is just an excuse, and this is not the place to argue about it.
I say there IS a point.
And third - most of the people with 3D printers don't actually design all the models they print. And even if they do, just a small fraction of them cares to "optimize" them. This is highly unlikely scenario. Just check 10 random thingiverse models with "organic" shapes.
So, if repetier or whatever + pi + printer is able to produce smooth prints, so should octoprint + the same pi + the same printer.
The issue is real, and is quite easy to reproduce. Even on models with lower resolution (but stil not "low-poly").
Don't try to understate the issue, just because it is not present in your workflow / setup.
lokster
on 8 Nov 2017
@fiveangle
I literally said "I don't see any stuttering", not "there cannot be any stuttering!!1!"
[XON/XOFF]
Do I see it correctly that there's currently no way to detect if the firmware supports that (e.g. by checking capability report, then adjusting serial parameters accordingly)? 🤔
@lokster & @nophead Both of you have a point and stated it accordingly, keep it civil ;)
works considerably better with repetier server or a simple gcode sender
The thing here is - OctoPrint is not a simple gcode sender. It offers a load of functionality. And I fear that I'm simply hitting the limits of the underlying architecture due to that. I've spent a ton of time trying to make the current comm layer faster. There have been some performance gains here and there, but considering that everything has to run in the same process that also means that API, business logic and the gcode sender have to share the same resources constantly. That plus gcode processing on sending (think plugin hooks, think check summing etc) is a bad combination. And that is why this is not a simple quick fix but something that needs a very invasive rewrite of a very important component to address. If I'd known what I know now around four or five years ago, I'd done things differently back then, but alas, I didn't.
The first attempt at this rewrite happened in late 2014 and made me hit a crippling firmware issue present in pretty much all Marlin forks out there that happened earlier than that and that forced me to abandon the whole approach I had back then and start completely from scratch.
The second attempt at this rewrite happened in early 2016 (@nophead might actually still remember the benchmarking we did back then), was going strong, and then the funding crisis hit. Since then I've been trying to get back on this, but this ain't something that I can do "in between" other things, so I didn't manage so far thanks to drowning in regular maintenance, support, ticket triage etc. As I mentioned above, I have this scheduled for 1.4.0 though and I also recently did a huge change in my general task management approach that finally freed up some valuable development time again, en bloc.
If you think I'm not aware of there being an issue somewhere in the comm layer or possibly in the general architecture that is negatively influencing achievable sending speeds, you are mistaken. But: It's also not bad enough in the majority of cases (if noticeable at all without adding actual sensor equipment in the one or other way) that I can justify dropping everything else to exclusively concentrate on this - and also risk breaking compatibility with the hundreds or thousands of firmware variants out there. In fact, I fear the majority of my patrons & other sponsors who even possible for me to work on this don't even necessarily agree that I need to make this rewrite at all, but thankfully so far haven't vetoed as far as I can tell.
foosel
on 9 Nov 2017
@foosel fair enough, and I get your points. Let's see what happens in 1.4.0.
In the mean time I will be researching for workarounds.
lokster
on 9 Nov 2017
Do I see it correctly that there's currently no way to detect if the firmware supports that (e.g. by checking capability report, then adjusting serial parameters accordingly)?
This early mechanism was to rely on the user knowing if it's enabled or not and if so, using the feature. The idea was originally to speed SD uploads. If you are interested in supporting this from the host side, I'll ensure by the time you're ready it will be in the capabilities report. I'll start working on that now (since it really should've been done anyway, but was overlooked).
fiveangle
on 10 Nov 2017
First, you mean "half the nozzle width", not "half the filament width". Because "half the filament width" is nonsense.
No, not the nozzle width or the filament diameter, the width of the filament laid down. You simply can't see tiny facets because the filament smooths them out like a French curve. I design with OpenSCAD with $fs = filament_width / 2 as a good rule of thumb and I don't see facets in my printed curves.
Yes organic models on Thingiverse won't print over USB unless you slice them with Skeinforge. That eliminates tiny facets. More modern slicers don't seem to bother.
IIRC a raw gcode sender is about twice as fast as OctoPrint, so you can hit the problem even then if your segments per second rate gets too high. You can either switch to SD, reduce the number of segments in the model or reduce your print speed.
nophead
on 11 Nov 2017
No, not the nozzle width or the filament diameter, the width of the filament laid down.
I design with OpenSCAD with$fs = filament_width / 2as a good rule of thumb and I don't see facets in my printed curves.
The term is "extrusion width" so you shouldn't be suprised when you conflate it with "filament width" and others don't understand what you are talking about ;)
IIRC a raw gcode sender is about twice as fast as OctoPrint, so you can hit the problem even then if your segments per second rate gets too high.
Comparing the effective GCODE serial rate throughput of Octoprint and raw serial, I find this statement hard to beleive. Can you point us to any discussion where this was determined ? I'd imaging the upper speed limit to be a moving target and highly environmentally dependant so if others have done this work, I would love to read it.
You can either switch to SD, reduce the number of segments in the model or reduce your print speed.
Not sure if you missed it, but the discussion is about brainstorming possibly ways to mitigate the (50%, according to you) throughput drop observed when printing with Octoprint. Your statement to switch to SD card at this point in the discussion is confusing. Are you trolling us ? :)
But I think the situation is far more dire, because the current avg throughput rate of OP is more than enough. It's the occasional hiccup that interrupts realtime GCODE processing that is the real problem, not raw average throughput.
If what you say is true — that there is a doubling of speed on the table — Gina's 1.4.0 rewrite will likely attain that (at a minimum - I'll reserve judgement until I see this discussion about where that 50% number came from). The real value in having the comms layer run as a separate lightweight process is to attain more realtime delivery, while the asynchronous operations can happen at whatever speed the system can muster with what's left over.
Beyond that, flow control (already implemented in Marlin today) should mitigate the speed limitation of ping-pong mode entirely so that the new limit is exponentially higher than 2x of current capabilities, but more importantly, not so dependant on realtime processing. The Marlin implementation currently allows a minimum of 1k RX buffer on the serial (vs. default of 32), which (if it all works as expected) would free the OP process to have a lot more hiccups in processing before draining the planner on the other end.
fiveangle
on 11 Nov 2017
Yes extrusion width is a better term. I will have to a do a global replace in all my code.
The work I did with a logical analyser starts here: https://github.com/foosel/OctoPrint/issues/450#issuecomment-191329482 in this issue.
nophead
on 11 Nov 2017
Thanks.
Btw- this may be wishful thinking but the hints are that the new Prusa MK3 controller board (Ulimaker Einsy) has a pin footprint on the underside to pick up a PiZeroW that the hive mind consensus expects is for use with Octoprint.
With the newly-implemented real-time Linear Advance feature in the Prusa fork (originally by @Sebastianv650 in Marlin 1.1), increased rigidity of the MK3, and ability to adjust microstepping real-time over SPI on the 256-interpolated Trinamic drivers I’d imagine they would easily hit the Octoprint serial comms threshold of affecting the print on the modest Pi0. The question is how will they mitigate ? There’s been speculation on direct GPIO to Marlin but if they stick with serial, perhaps some form of OP optimization maybe on the horizon of being released ? All rumors at this point but we shall see…
fiveangle
on 11 Nov 2017
@fiveangle I'm not sure whether Prusa was just optimistically hoping a PiZeroW would do it or if he's got another trick up his sleeve, but so far PiZeroW testing indicates that when it is using the wifi (send or receive) there isn't a whole lot of core CPU left over for processing.
Maybe he's intending to publish his own barebones g-code sender/server.
He did say in some interview that people shouldn't be so worried about the PiZeroW's limitations because while you can't mount a whole Pi 3 on there, you should be able to connect it easily to the the connector he's put on there.
markwal
on 12 Nov 2017
perhaps some form of OP optimization maybe on the horizon of being released ?
Well, at least I'd hope they'd get in touch with me about something like this, and so far that hasn't happened. They also said they weren't aware of any issues with the 0W WiFi, which struck me as a bit of surprise considering that a simple curl without anything else running on the machine will already gobble up more than 50% CPU. With a Pi0W, I can tell you that OctoPrint's comm layer is the least of your concerns, unless you plug in a USB WiFi/Ethernet dongle (or keep the thing completely off the network, kinda defeating the whole purpose).
foosel
on 13 Nov 2017
I did an interesting observation on the Pi Zero. Not unexpected, but still interesting: when there is a webcam running (and streaming MJPG) the quality drops drastically even though the CPU usage is within ~50-70%.
What's even more interesting, is that when streaming the webcam & printing via Repetier Server, it does not affect the quality :)
So, what is Repetier doing differently?
I tried giving the octoprint process more CPU & IO priority with ionice and renice, but it had absolutely no visible effect.
simple curl without anything else running on the machine will already gobble up more than 50% CPU
Interesting. Is this well know issue with the Pi Zero W?
It does not apply in my case, because I use "regular" Pi Zero + ESP8266 SDIO, connected directly to the SDIO pins on the Zero. Just tested, and a wget download with ~2MB/s takes just 2% CPU.
Not that my comment helps much... just sharing some observations.
lokster
on 13 Nov 2017
It’s because the WiFi implemention is not optimized.
Also, lots of Pi0’s came underclocked from 1GHz To 700MHz, which certainly doesn’t help anything
fiveangle
on 13 Nov 2017
It does not apply in my case, because I use "regular" Pi Zero + ESP8266 SDIO, connected directly to the SDIO pins on the Zero.
Interesting, how do you configure the Pi to use the ESP8266 for its Wifi connection?
I was playing with one of those recently and it seemed to connect to my Wifi much better than the average USB dongle.
nophead
on 13 Nov 2017
Not sure if it's ok to share the link here (might be considered free advertisement) but I have documented the process here: http://lokspace.eu/control-your-anet-a8-3d-printer-using-octoprint-on-raspberry-pi-zero-with-sdio-wifi-addon-direct-uart-connection-and-still-have-one-free-usb/
It uses ESP-12F module, a couple of resistors, and manually compiled driver. Once set up, it's VERY reliable and the connection is fast & stable. E.g. getting 4MB/s download speed without issues.
I got tired of cheap USB wifi dongles constantly losing connectivity...
EDIT: I made this before the Pi Zero W existed :)
lokster
on 13 Nov 2017
…now replace the ESP-12F with an Einsy, and corresponding serial loopback driver with Einsy TTL serial as the endpoint and you understand what I am getting at with my predictions of the forthcoming Pi0 impelmentation in the MK3. No major Octoprint changes necessary, if at all. But again, we shall see…
fiveangle
on 13 Nov 2017
Hey @LangBalthazar On what raspberry pi do you experience such problems? I'm running OctoPrint on Pi Zero now I'm mostly happy regardless small imperfections. I'm switching to Pi3B+ because the load on Pi Zero is far too high to be reliable.
 mpapierski
on 3 Oct 2018
mpapierski
on 3 Oct 2018
Too bad that this issue is still present... I am printing from a Raspberry Pi 3 Model B, and I am getting exactly the same issues. Interestingly, even printing as something as simple as a Benchy will create visible slowdowns while printing the curved bow part. As @lokster explained in their analysis, increasing the buffer in Marlin did help slightly, but I am still not happy with the results.
One very nice way to make these issues clear as day while printing is to enable the linear advance in Marlin. The result will be this wonderful grinding sound that sounds like the printer is physically falling apart (realistically, it might from the vibrations) as Marlin triggers the linear advance movements after each serial buffer empties and waits for the new batch from OctoPrint.
I have made a video last year which showcases this issue quite well on a Benchy: https://www.youtube.com/watch?v=-u8j61-BWLw
At around 11 seconds in, the printer will start making the perimeter walls of the bow. You will notice a sudden slowdown near the end of the bow in the first perimeter, followed by a longer slowdown during the second perimeter. You may ignore the third one as that one is intentionally slower for a better outside finish.
 Thorinair
on 30 Jan 2019
Thorinair
on 30 Jan 2019
I can say I am also seeing this issue. Most my prints are boxy and so I never really noticed it. It wasnt until I made a small object to test and fine tune my retract settings that I found it slowing down considerably on arcs. It came to a crawl on an ark that is about 3.5mm in diam....so I increased it to 10mm in diam and it still had issues going around the curve.
I printed the exact same Gcode from my computer from Repetier-Host and had "zero" issues. So I thought AH-HAAA its the PI and its crummy slow USB.
But then I installed Repetier-Server on the PI's SD card and printed from the PI again, but this time instead of printing using OctoPrint, I was using Repetier-Server.
Both times the PI was connected to the printer with the same USB cable, Same power, same everything. The only difference was one time I was running OctoPi, the other time I was running Repetier-Server.
The Repetier-Server printed flawlessly around the arc features.
So it would appear its not a limitation of the PI, its how Octoprint is implementing its serial communications, or maybe other stuff in the background causing the serial communications to lag.
If there is anything I can provide, let me know what it is, I would be happy to help in any way I can to resolve this issue.
 changedsoul
on 10 Mar 2019
changedsoul
on 10 Mar 2019
googling fix's for stuttering and this old thread popped up.
Delta printer
marlin 2.0x
skr 1.3 <<<- thought it be better on 32bit hardware
pi4 << -- direct
still prints better from sd card...
@lokster saw your article. Thanks for testing and posting the results
cant set BLOCK_BUFFER_SIZE = 128 without compile error. mem limit??
 mylife4aiurr
on 14 Aug 2019
mylife4aiurr
on 14 Aug 2019
googling fix's for stuttering and this old thread popped up.
Delta printer
marlin 2.0x
skr 1.3 <<<- thought it be better on 32bit hardware
pi4 << -- direct
still prints better from sd card...@lokster saw your article. Thanks for testing and posting the results
cant set BLOCK_BUFFER_SIZE = 128 without compile error. mem limit??
SKR1.3 board has 512kb RAM.
Enable "M100 Free Memory Watcher" in conf. to monitor it.
You can reduce LCD lag by modify #15837 .
 MoutatsuLai
on 19 Nov 2019
MoutatsuLai
on 19 Nov 2019
Adding to this thread:
- Raspi 4 2Gb
- Marlin 1.1.9, everything disabled (LA, JD, S-Curve, ...)
- USB Cable is fine, nothing else running on the Pi, even disabled the webcam
- Tested with 112500 and 250000 bauds
Printed a small cylinder (2.5cm width / 1.5 cm height)
Results:
- Stuttering with octoprint (1.3.12)
- Stuttering with octoprint safe mode (1.3.12)
- no problem with SD Card prints
- no problem with repetier
 RomRider
on 27 Nov 2019
RomRider
on 27 Nov 2019
I have exactly the same problem
 Hesi-Re
on 27 Nov 2019
Hesi-Re
on 27 Nov 2019
I'll add my $0.02 to the thread. I'm running Klipper now. I never had this issue w/ Marlin, but I also never printed above 80mm/s and outside perimeters were slowed down. I'm guessing the slower perimeter might have helped mask the issue. I haven't updated to the latest Octo version yet; still running 1.3.12 and 0.17.0
This is typical of what I see when the nozzle gets "stuck" on my test gcode of the day. It manages to, sometimes, complete the layer for the circle then sits a couple sec before moving on.
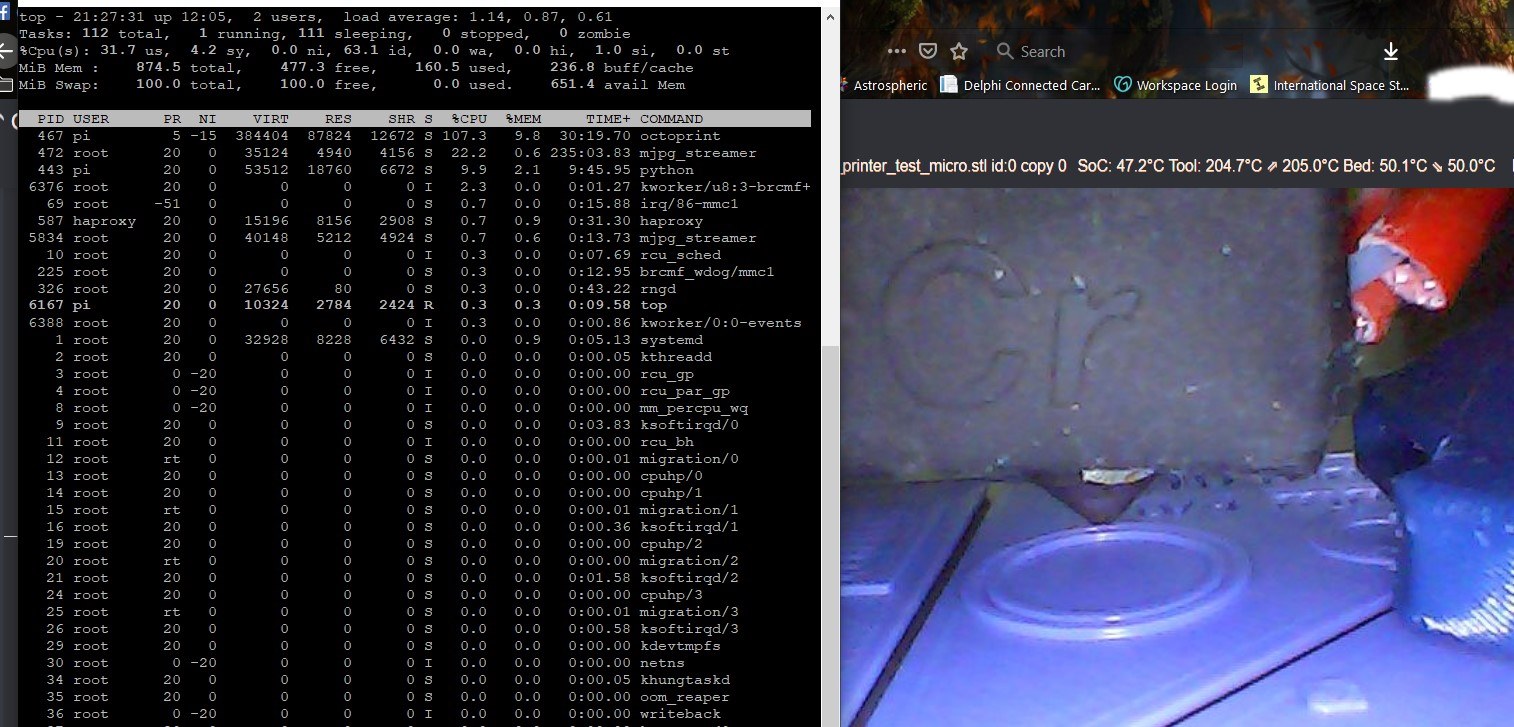
I had 2 webcam daemons active above so I disabled them on a recommendation from Justin Habe on facebook. Here's the result; no change.
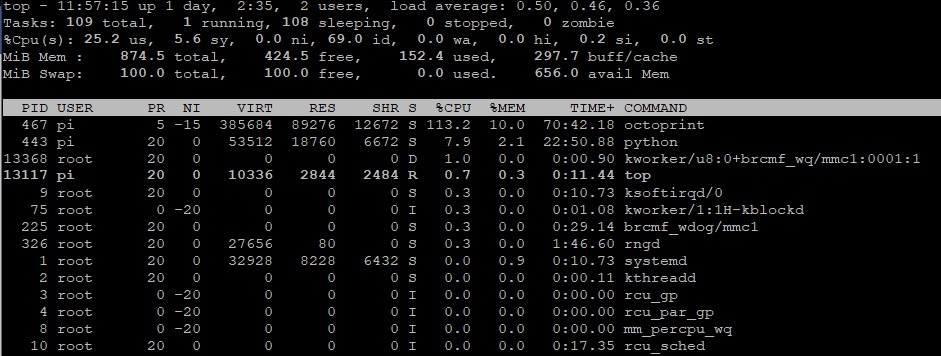
I can print a near-perfect benchy in 47min from Octo with 140mm/s (projected) speeds sliced with Prusaslicer; no pauses or blobs and I watched it via the webcam the whole time.
I wanted to print this model using vase mode, but had to cut the default speed of 60mm/s down to nearly 15% on the LCD to get smooth motion. At that point I just stopped the print.
Using the Klipper virtual SD card feature clears up any issues I've had with Octo, but I like having Octo fully functional. The virtual card uses space on the Pi's physical SD so that rules out the physical USB as the issue unless I'm mistaken.
I have a 'temporarily' spare NUC sitting in the closet that I might put an image on and see if the extra horsepower can just force its way past the bottleneck.
@foosel I don't know if you'll have the time or ability to get this nailed down and corrected, but hopefully you will eventually. Sorry for the others' posts that come across as less than cordial. I'd like to think that most of "us" are grateful and appreciative of the efforts you continue to put into this project. I know I am.
 ProfEngr
on 10 Mar 2020
ProfEngr
on 10 Mar 2020
Octoprint needs a separate process for serial communication.
If octoprint serves a web page or plug-in requires CPU resources octoprint pauses sending print commands to printer while it does other task.
Increasing the firmwares serial buffer is a bandaid but it does allow the printer to ride out any pauses in Octoprints ability to send print commands. Trouble is some printer boards don't have spare memory needed to increase buffer size without turning off other features of the firmware. The fault lies with octoprint according to Tim Hoogland:
https://youtu.be/OhVbUdStMlE
mylife4aiurr
on 10 Mar 2020
Larger buffers are a workaround for Marlin, yes. I haven't found a buffer option in Klipper yet.
ProfEngr
on 10 Mar 2020
There is an undocumented option in klipper to change the buffer size:
[printer]
buffer_time_high: XX (value in seconds, default is 2)
cant set BLOCK_BUFFER_SIZE = 128 without compile error. mem limit??
I don't know if this is true in stock Marlin, but at least in Prusa's fork, 128 is too big -- block_index is an 8 bit signed number and 128 is an overflow regardless of free memory -- you also get a compiler warning about this.
Prusa-Firmware-build/sketch/planner.cpp:140:22: warning: comparison is always false due to limited range of data type [-Wtype-limits]
   if (++ block_index == BLOCK_BUFFER_SIZE)
                      ^
 rrauenza
on 19 Apr 2020
rrauenza
on 19 Apr 2020
You are printing from the Pi, right? You might simply crash against it's
limitations there. For toolpaths with a lot of small lines (e.g. lots of
rounds and direction changes, as in gears) you will have a lot of gcode
lines generated, each only moving the head a tiny fraction. Now, all those
lines of gcode need to be transfered to the printer, and that quite fast.
On a regular work pc, you won't run into problems here. On a pi though,
transfer plus house keeping can be too much. Personally, I've taken to
doing prints like that from SD instead of streaming them via USB. Serial
communication is a bottleneck. Printing slower might help.
@foosel, I happen to be looking at the Marlin buffers this weekend. I added a diagnostic menu to my Prusa to monitor them. The serial buffer (4 blocks of 96 bytes) on the Prusa so far hasn't gone over 1 out of 4, which I think makes sense due to the send/ack OK workflow. ....would it be possible to do some sort of windowing where octoprint sends 4 commands and doesn't send another until it gets an OK back? That way you're always keeping the printer's serial queue full with 4 "in flight" so to speak.
(....but the additional problem is the short planner buffer in the Marlin.)
[Edit: ah, I've spent some time now in util/comm.py... We'd keep a queue count, say, N, each time you send a command you decrement N. Each time you get an OK, you increment N. If N is zero, you block and activate the Ok timeout. I don't know if this handles the synchronous case like M109 -- as I think the spec says the printer will block. Or specific synchronous commands could be handled. I'm wondering if I can prototype this in a serial proxy ...]
Code to add the menu:
diff --git a/Firmware/ultralcd.cpp b/Firmware/ultralcd.cpp
index fc39b14..406b37c 100755
--- a/Firmware/ultralcd.cpp
+++ b/Firmware/ultralcd.cpp
@@ -140,6 +140,8 @@ static void lcd_menu_fails_stats_mmu_total();
 static void mmu_unload_filament();
 static void lcd_v2_calibration();
 //static void lcd_menu_show_sensors_state();      // NOT static due to using inside "Marlin_main" module ("manage_inactivity()")
+static void lcd_menu_serial();
+static void lcd_menu_planner();

 static void mmu_fil_eject_menu();
 static void mmu_load_to_nozzle_menu();
@@ -2203,11 +2205,40 @@ static void lcd_support_menu()
   MENU_ITEM_SUBMENU_P(PSTR("Debug"), lcd_menu_debug);////c=18 r=1
 #endif /* DEBUG_BUILD */

+  MENU_ITEM_SUBMENU_P(PSTR("Planner"), lcd_menu_planner);
+  MENU_ITEM_SUBMENU_P(PSTR("Serial"), lcd_menu_serial);
+
   #endif //MK1BP

   MENU_END();
 }

+static void lcd_menu_serial()
+{
+  lcd_home();
+  lcd_printf_P(PSTR(" Size: %d\n"
+                    " Used: %d\n"),
+               BUFSIZE,
+               buflen
+  );
+  menu_back_if_clicked_fb();
+}
+
+static void lcd_menu_planner()
+{
+  lcd_home();
+  lcd_printf_P(PSTR("Size: %d\n"
+                    "Moves Planned: %d\n"
+                    "Blocks Queued: %c\n"
+                    "Queue Full: %c\n"),
+               BLOCK_BUFFER_SIZE,
+               moves_planned(),
+               blocks_queued() ? 'Y':'N',
+               planner_queue_full() ? 'Y':'N'
+  );
+  menu_back_if_clicked_fb();
+}
+
 void lcd_set_fan_check() {
        fans_check_enabled = !fans_check_enabled;
        eeprom_update_byte((unsigned char *)EEPROM_FAN_CHECK_ENABLED, fans_check_enabled);
Is there still no final fix since 6 years?
I tried so much tips but still a load of 100%+ with Klipper and Octoprint during many little moves :-(
 Sonsi79
on 22 Apr 2020
Sonsi79
on 22 Apr 2020
One tip I don't hear discussed much is to use the resolution option in your favorite slicer to reduce the number of segments present in the small curves. For 0.4mm nozzle, reducing resolution to 0.05mm (or larger even) results in no noticeable change in the resulting print to my observation, but test for yourself because it is obviously model and printer dependant (and still not guaranteed to resolve all cases).
fiveangle
on 22 Apr 2020
Or to use arc commands instead of line segments for everything, something which slicers sadly still fail to do for some reason (and which has caused support for G2 and G3 to drop from firmware builds here and there sadly), but @FormerLurker is working on something really interesting: https://community.octoprint.org/t/new-plugin-anti-stutter-need-testers/18077?u=foosel
foosel
on 22 Apr 2020
I see some of you are using Prusa Firmware. It does not print arc's well currently if the radius is very small (less than 2 mm), but I'm working on a patch. I just need to finish up testing.
FYI, while modifying the G2/G3 commands, I discovered some performance issues inserting items into the planner. The G2/G3 code is highly optimized, but it almost doesn't matter compared to the overhead of adding the segments to the planner. I guess that makes sense since a whole lot of things are going on in there. I don't really understand that code yet, but I'm wondering if there is a way to take advantage of the fact that G2/G3 only produces relatively small segments to increase planner performance?
Anyway, I believe the simplest way to increase performance from OctoPrint's perspective is to send fewer lines of gcode, and as @foosel mentions, G2/G3 generally takes care of this. It may take a while for the firmware to catch up though.
 FormerLurker
on 22 Apr 2020
FormerLurker
on 22 Apr 2020
Or to use arc commands instead of line segments for everything, something which slicers sadly still fail to do for some reason (and which has caused support for
G2andG3to drop from firmware builds here and there sadly), but @FormerLurker is working on something really interesting: https://community.octoprint.org/t/new-plugin-anti-stutter-need-testers/18077?u=foosel
In an ideal world, yes. Similar to the difficulty and attempting to rasterize bitmap images efficiently, the trouble is that curve-fitting to a polygonal 3D object is not a trivial task, somewhat computationally intensive, and generally adds a bit of uncertainty (at least to humans who don't understand the concept of "resolution" :) ). The approaches that have been tried are 2D curve fitting each layer individually, and that has had some marginal success (you can try one such approach here from 2016). That project IS interesting Gina ! Thanks for calling attention to it.
But the reality is that G2/G3 was originally envisioned as a means of exporting existing CAM paths directly to gcode. It was never intended for taking tesselated objects and trying to gleam the mathematical arcs that could make them up. G2/G3 support is being dropped mostly by projects that have moved away from CNC control and are focused solely on FDM printing where there is no strong use model for arc support (other than to get around the serial limitation of processing GCODE ping-pong style of course !)
fiveangle
on 23 Apr 2020
@fiveangle, I reviewed the source of the project you mentioned in detail AFTER I finished my algorithm (I hadn't heard about it before until someone else pointed it out to me). It can convert arcs in some limited cases, but not everywhere you would expect. Try dropping a benchy in there and compare it to the results you'll find in the thread @foosel linked to (one of the first replies).
The creator was definitely on the right track, but I had some additional tools at my disposal from my last project (Octolapse) that made it much easier to detect and convert a many more segments into arcs, all while maintaining a toolpath accuracy that is user controlled. The default settings guarantee that all tool paths will be within +- 0.025mm. You can increase the accuracy at the cost of reducing the number of arcs generated. Additionally, it doesn't take much time to process even a very large file. It could be sped up considerably if it were integrated with a slicer so that layers could be done in parallel (the current process is linear).
G2/G3 support is not being dropped. In fact it's being improved (see marlin 2's newer implementation). Nearly all firmware supports it unless it is disabled to save a small bit of memory. The main issue is that most (no??) slicer's support G2/G3 generation. I think it's one of those,
"If you build it they will come," things.
I will say that the actual implementations are quite varied. I'm attempting to create a patch for Prusa's fork of Marlin right now so that it can draw more accurate arcs. They are using very old code for G2/G3 segment interpolation. It has some problems currently drawing arcs of a small radius, and there were performance issues increasing the accuracy via the MM_PER_ARC_SEGMENT setting. I've made some improvements since my last post there that allows one to enforce a minimum arc segment length.
FormerLurker
on 23 Apr 2020
@fiveangle, I reviewed the source of the project you mentioned in detail AFTER I finished my algorithm (I hadn't heard about it before until someone else pointed it out to me). It can convert arcs in some limited cases, but not everywhere you would expect.
It was just a proof of concept a guy through together as a school project I think. I'm not promoting it at all (and don't use it either).
G2/G3 support is not being dropped. In fact it's being improved (see marlin 2's newer implementation). Nearly all firmware supports it unless it is disabled to save a small bit of memory.
Marlin is very much focused on continuing to provide CNC based capabilities so no, arc support will not be in jeopardy of being dropped by Marlin in the near term, if ever. I don't think Gina was suggesting so for Marlin specifically, but perhaps by other FDM printer firmware ? (I don't think the proprietary Lerdge FW supports G2/G3.)
However, ARC_SUPPORT is _absolutely_ one of the one of the first things to go when users are attempting to configure Marlin for PROGMEM-limited boards. I challenge you to find a CR-10 (Melzi) running Marlin 2.x with it enabled. From: https://github.com/MarlinFirmware/Marlin/blob/0518dec60d0931745efa2812fa388f33d68cfa29/Marlin/Configuration_adv.h#L1632
#define ARC_SUPPORT // Disable this feature to save ~3226 bytes
The main issue is that most (no??) slicer's support G2/G3 generation. I think it's one of those,
"If you build it they will come," things.
Is it though ? If the slicer outputs gcode from the tesselated model, it does so in true form to the model and can do so without any curve-fitting trickery. If there were no limitations in gcode string processing (such as when running 32-bit board and reading directly from on-board SPI-connected SD card) then there should be no benefit of curve-fitting.
It's only because of the serial limitations and ping-pong command processing of gcode (where XON/XOFF is not implemented and functioning on both ends) where the arc support allows the large number of gcode lines to be represented by very small numbers of gcode arc requests where it makes any sense at all for FDM. That said, I ❤️ your ingenuity in basically creating a gcode-specific version of a fuzzy compression algorithm as a means to bandaid this data throughput problem.
I will say that the actual implementations are quite varied. I'm attempting to create a patch for Prusa's fork of Marlin right now so that it can draw more accurate arcs. They are using very old code for G2/G3 segment interpolation. It has some problems currently drawing arcs of a small radius, and there were performance issues increasing the accuracy via the MM_PER_ARC_SEGMENT setting. I've made some improvements since my last post there that allows one to enforce a minimum arc segment length.
I suspect this will be turtles all the way down... and in the end, tackling the original gcode processing throughput issue might be more fruitful, but again, I love the fact that your idea tries to alleviate the problem today, and in a cool and ingenious way 👍
fiveangle
on 23 Apr 2020
It was just a proof of concept
Yes, that's exactly what I was saying. I didn't mean to imply that you were promoting it, I just wanted to point out that it yields very different results. The author did a good job making something that would run on a browser, and our methods were somewhat similar!
I challenge you to find a CR-10 (Melzi) running Marlin 2.x with it enabled.
I already know of people who have CR-10s running marlin 2 with arc support enabled (check that thread Gina linked to), though I'm not sure about the Melzi board (never heard of it until now).... Users may be trained to disable this feature when trying squeeze out a bit more memory, but the official firmware has it enabled (I know it's 1.x), so vastly more CR10 users have arc support enabled than those who don't. Also, if arc support was something people used, it would not be cut out so easily. Additionally, users who are capable of compiling their own firmware usually don't have much trouble re-compiling it if they want to change something. Lastly, it is enabled in stock marlin, so most likely this will be the typical setting.
If the slicer outputs gcode from the tesselated model, it does so in true form to the model and can do so without any curve-fitting trickery.
Well, there is a lot of fitting trickery going on in the slicer right now, it just doesn't involve G2/G3 as of yet. Also, I've been hearing that kisslicer will be adding G2/G3 support soon, which may add perceived (if not real) value and may push other slicers to add that feature as well.
I want to make it clear that I think you make very good points about whether to use or not use G2/G3, and if it's important even, especially when talking about more modern boards. I believe the importance is relative to the use case. You have suggested that the use case may vanish with time. And while I definitely believe that is likely at some point, I think it may be useful to consider that as the hardware/printing capabilities advance, resolution and speed will increase, which will yield more peak segments/gcodes per second, which will require more bandwidth and processing power. More segments would also result in a proportional increase in gcode size. The more segments the better compression you'll get from using G2/G3. We tend to always push the hardware that is available to the limit, no matter what the capabilities are. I think it's quite likely that some new bottleneck will be hit with the next generation of more powerful boards. Perhaps G2/G3 will help with that, perhaps not.
I hope I'm not sounding combative here, but I really enjoy a good discussion with someone who can hold their own, and who raises good and thoughtful points. Plus it makes me think a bit more about the future of FDM, which is very important for me when thinking about future projects. Thank you for your participation, your thoughts, and your compliments! Please feel free to contact me if you have other ideas. I feel like I'm starting to derail this thread, so I'm going to stop doing that :)
FormerLurker
on 23 Apr 2020
Yes, you're right that this discussion is starting to commandeer this thread (although it's already a bit unwieldy after so many years ;) ). We can drop this discussion here, but I wanted to point out that the default Marlin CR10 configuration does not have ARC_SUPPORT due to the 128k PROGMEM size constraint on the Melzi board it uses (similar to Printrboard, and a handful of others):
https://github.com/MarlinFirmware/Configurations/blob/c1b2dcd74721c777e96780be752a9e8a8ef4cac8/config/examples/Creality/CR-10/Configuration_adv.h#L1651
//#define ARC_SUPPORT // Disable this feature to save ~3226 bytes
But yes, recompiling is always a possibility (if one can find the extra space from somewhere. Unfortunately, it's a juggling act and I really hate to see people start ditching things like protection from long extrusion or cold extrusion prevention, but such is life ! :)
fiveangle
on 23 Apr 2020
I enjoyed reading the smart people discuss and highlight nuisances. Really I'm glad I'm on the thread, because I can sorta keep up with ideas and development.
Back to stuttering and print artifacts. Struggled with this for years on a Delta. I've read countless forums (how I found this thread), did the buffer tricks, reduced segments, reduced DELTA_SEGMENTS_PER_SECOND, turned off features like linear advance, reduced print resolution, upgraded to Marlin 2.0, then 32bit skr1.3 but still stuttering, still less detail and print quality with Octoprint.
None of the above helped more then just printing from SD card even on the 8bit CPU, compared to printing from octoprint.
Wish serial comms had there own process on octoprint or flow control or something.
Why is end user expected to make other sacrifices instead of fixing the fundamental issue. Ok rant over.
(I love Octoprint, I'm a monthly supporter of Gina's)
mylife4aiurr
on 23 Apr 2020
I use a slicer that doesn't output ridiculously short segments and I model with OpenSCAD with $fs set to half my extrusion width and never have a any problems with serial printing in OctoPrint.
There really isn't any point in using segments that are tiny compared to the line width. Filament smooths out the corners.
nophead
on 24 Apr 2020
Or to use arc commands instead of line segments for everything, something which slicers sadly still fail to do for some reason (and which has caused support for
G2andG3to drop from firmware builds here and there sadly), but @FormerLurker is working on something really interesting: https://community.octoprint.org/t/new-plugin-anti-stutter-need-testers/18077?u=foosel
@foosel,
I did see one warning somewhere in the Prusa firmware or their gcode manual or somewhere -- that the arc commands ignore bed level mesh. I don't know if that's a valid reason -- but a possible one?
What's odd is S3D apparently _used_ to support arcs and it disappeared?
At the Marlin level, after looking at the debug output during a stutter -- the planner occasionally gets drained. I don't think anyone is surprised by that? On my Prusa firmware I can't increase the buffer. I think I'm out of memory (it fails during boot). The serial queue is allowed to have four 96 byte commands buffered, but only ever buffers one because Octoprint waits for the ack before sending the next one. I'm not sure why the buffer is 4 x 96 instead of just 1 x 96 unless clients aren't expected to wait for ack's.
I wonder if some kind of windowing of the protocol might help with the stalls. Maybe testable by setting the ok timeout near 0 in the octoprint code and turning on simulated ok's?
At most that only puts 3 more commands in the Marlin to be added to the planner queue.
Adding more serial buffers costs about 96 bytes per buffer. I haven't counted the size of the planning buffer, but there are a lot of fields in it, and you can only increase it by doubling its depth (which is something else that could be looked at -- not requiring the planning buffer length to be a power of 2. It's done for some indexing optimization that might be unnecessary.)
(For now, I'm just migrating to a Toshiba FlashAir wifi SD and printing from the SD card in octoprint...)
rrauenza
on 30 Apr 2020
All you need is a slicer or gcode filter that combines short segments into longer ones. That is what Skeinforge must do and it always works for me. Segments shorter than half your filament width don't add any more detail to your print as they cant be seen.
nophead
on 30 Apr 2020
@rrauenza I've asked about this in the Klipper forum, but have not received an official response about the mesh offsets. I did get this link in a comment though: GCodeArcOptimiser
@nophead you mean nozzle/line width I think. I can definitely see details that are 0.8mm (half my filament dia) in size. I cannot, however, print reliably at less than 50% of my nozzle width.
I gave up on Marlin months ago when sensorless homing broke in 2.x and moved to Klipper. Can't say I regret the choice. I increased the buffer size to 10 and I got a preview-accurate benchy in 47min w/ a slicer setting of 140mm/s and acceleration of 1500, no blobs. Buffer size isn't a panacea, but they sure help for moderately fast printing. I haven't tried the thingiverse vase mode pyramid again since the last config change in Klipper. My first attempt on the stock buffer size "failed" after the 2nd "layer" started. I was down to 25% of the 30mm/s slicer speed and still getting stutters so I stopped the print. That thing has an insane amount of small gcode moves.
Here's an explanation of the data density I was given in the Klipper github. It applies to Marlin since Octo has to move plain text ASCII across the USB, and to the internal virtual port that Klipper uses. Klipper sends a compressed protocol over USB to the board so that's unlikely to create a bottleneck.
@foosel what is the highest baud rate that can be set on a virtual port: /tmp/printer
ProfEngr
on 30 Apr 2020
Not details less that half the extrusion width but noticeable bumps in curves that have segments that size.
I use 0.5mm extrusion width and 0.25mm minimum segments. I get smooth curves because the filament acts like a French curve and smooths out tiny segments. I print at 50mm/s second so only ever get a maximum of 200 segments per second which doesn't exceed the comms bandwidth, so I never get zits on my prints.
nophead
on 30 Apr 2020
@ProfEngr
For reference,
https://help.prusa3d.com/en/article/prusa-specific-g-codes_112173
G2, G3 - Controlled Arc Move G2 & G3: Controlled Arc Move
These commands don't properly work with MBL enabled. The compensation only happens at the end of the move, so avoid long arcs.
rrauenza
on 10 May 2020
Actually, MBL is performed for every segment. I verified this for a PR im hoping will be approved. The documentation is apparently out of date.
FormerLurker
on 10 May 2020
One tip I don't hear discussed much is to use the resolution option in your favorite slicer to reduce the number of segments present in the small curves. For 0.4mm nozzle, reducing resolution to 0.05mm (or larger even) results in no noticeable change in the resulting print to my observation, but test for yourself because it is obviously model and printer dependant (and still not guaranteed to resolve _all_ cases).
Reducing maximum resolution in slicer (Cura 4.6) from 0.05mm to 0.5mm greatly reduced stuttering when printing a 14mm diameter cylinder in vase mode (lightsaber segment, thing:3606120), but it was still problematic when opening octoprint web interface or any other slight additional activity. Finally printed from SD card alone perfectly.
 mihaimatei
on 19 Jun 2020
mihaimatei
on 19 Jun 2020
Hi all, i've skimmed through the thread, and this one. I have two raspizeroWs in two of my Prusa MK3Ss, both running same exact gcode for a batch print we're doing. Both running octopi, latest version, all updates done. One was freshly installed, almost no plugins, printing perfectly, visually identical to SD. One was printing extremely poorly, like in link above, very noticeable stuttering in circles and zig-zag moves. I noticed system load avg was about 3. This second pi had about 10 plugins installed, so i rebooted in safe mode, problem solved, perfect print, no stuttering. I then rebooted into normal, disabled a few plugins, while leaving the others enabled, and still no problem. Now my "vanilla" install on the first pi, which is still printing great has a load avg of 0.7 over 15mins, while the other one, with several plugins still enabled, has 1.04 load avg. I read about the G2 / G3 commands, stuttering reducing plugin, new marlin release 2.0.6, and more, but I still have a question: is there a way - beyond visual inspection - to know if system load avg on the PIs is causing slowed down gcode execution during print? I'd like to have a way to tell even if they're being reduced by 1%, therefore not producing visible artifacts, because that way I could rest assured I have not enabled too many plugins, and not having to rely on visual inspection of every piece. Is a load avg over 15mins higher than 1 already a warning sign? Is there a log signaling slowed-down serial command transfer? Thanks to all
 nordurljosahvida
on 17 Aug 2020
nordurljosahvida
on 17 Aug 2020
@nordurljosahvida, most of the lagging is due to serial communication delays, which won't cause much/any cpu load. IF your pi is under too much load, that can cause stuttering, but what I'm saying is that low load doesn't mean no stuttering. The only real way to check is to do a side-by-side SD to serial comparison.
However, I believe there is a plugin that will show the min/max/average gcodes per second. That is a useful metric, but there is no way I'm aware of to prove there was serial induced stuttering within Octoprint or any other serial printing method. I would love to see a plugin like this, but I'm not sure it's possible.
That being said, a pi 0 is likely to cause stuttering, especially with high numbers of gcodes per second. I would recommend you find a small test print with lots of curves (maybe a 10-15 min print) and try a side-by-side: 1 printed with Octoprint, one from SD, and one printed using ArcWelder converted gcode from Octoprint to see if you notice any improvements in quality or print time.
FormerLurker
on 17 Aug 2020
@FormerLurker thank you so much for the insight. So there's no real way to understand if there was stuttering, whether it was induced by serial lag or system load, right? I suppose checking that the 24h print was executed to the exact minute of print time could help confirm there was [most likely] no stuttering? I'll try running those tests
nordurljosahvida
on 18 Aug 2020
Only if some method for profiling OP were implemented would there be any way to determine based on timing if there were any aberrations detected during the print. And here, we are assuming timing as the detection mechanism but that would need to be established. There are profiling methods people have made for Python such as dtrace: https://github.com/paulross/dtrace-py but mostly for 3.x and not 2.x. Regardless, there are likely easier ways for Gina to implement such a detection mechanism in a debug-only fashion, but when I say "easier" I mean, compared to "who knows?" 😄
fiveangle
on 7 Oct 2020
I've been thinking about how to diagnose the issue, and I figured that a mechanism that allows the printer to inform the host if the planner and command buffers underrun would be key in detecting if the issue occurs rather than judging print artifacts.
I've opened a PR for Marlin (https://github.com/MarlinFirmware/Marlin/pull/19674) that implements M576 as a buffer monitoring tool, where it reports buffer status as well as underrun count and max buffer empty since last report.
I enabled it to report at 2s intervals, and printed with an identical model (half size 3DBenchy) with the same settings in both Cura 4.6.2 and 4.7.1, as I know 4.7.1 produces dense gcode that causes print quality issues. I stripped extrusion commands from the gcode in order to not waste filament when I ran tests, but I don't think there would be a significant difference in latencies and underruns observed. I redirected the M576 output that was turned on during a print, and charted the data:
Cura 4.6.2:
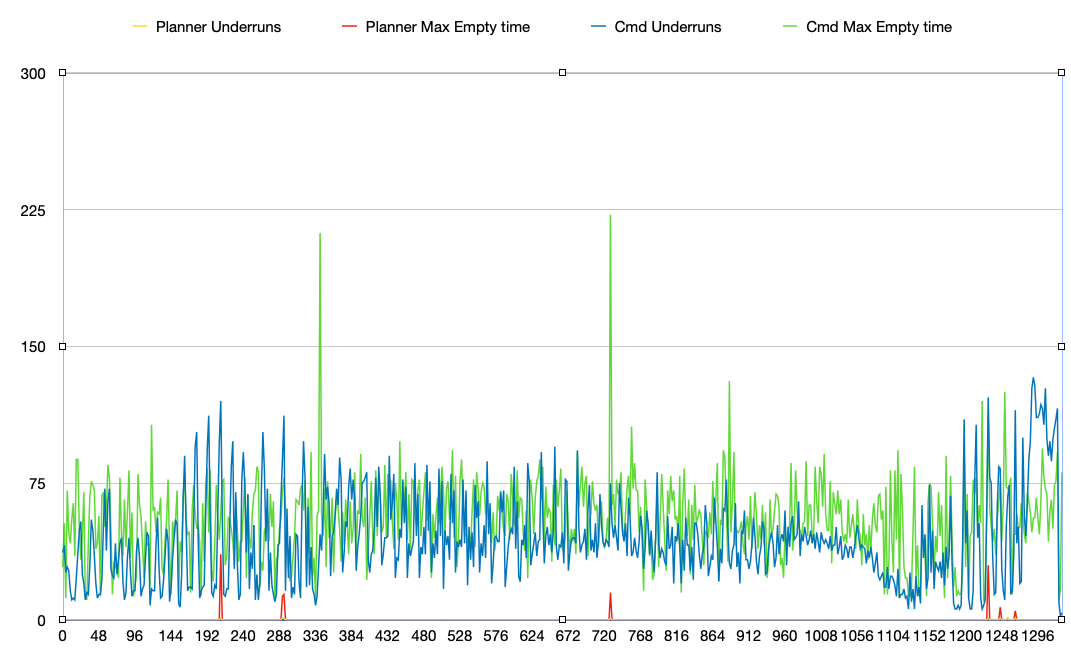
Cura 4.7.1:
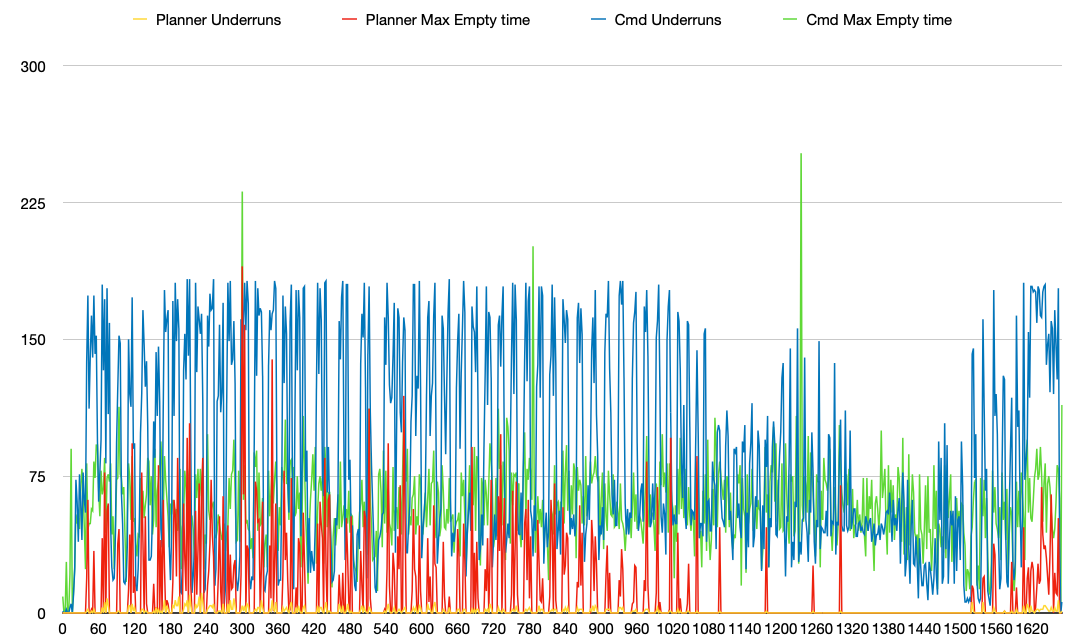
More information and methodology found on this post.
We can use this to detect and inform the user regarding when planner buffer underruns occur and serve as a base to understand if attempts at improving the problem is working, which should help!
 chendo
on 10 Oct 2020
chendo
on 10 Oct 2020
Related issues
 szafran81
·
40Comments
szafran81
·
40Comments
 gege2b
·
64Comments
gege2b
·
64Comments
 lakay
·
44Comments
foosel
·
50Comments
lakay
·
44Comments
foosel
·
50Comments
 devsfan1830
·
55Comments
devsfan1830
·
55Comments
Most helpful comment
I've been thinking about how to diagnose the issue, and I figured that a mechanism that allows the printer to inform the host if the planner and command buffers underrun would be key in detecting if the issue occurs rather than judging print artifacts.
I've opened a PR for Marlin (https://github.com/MarlinFirmware/Marlin/pull/19674) that implements
M576as a buffer monitoring tool, where it reports buffer status as well as underrun count and max buffer empty since last report.I enabled it to report at 2s intervals, and printed with an identical model (half size 3DBenchy) with the same settings in both Cura 4.6.2 and 4.7.1, as I know 4.7.1 produces dense gcode that causes print quality issues. I stripped extrusion commands from the gcode in order to not waste filament when I ran tests, but I don't think there would be a significant difference in latencies and underruns observed. I redirected the
M576output that was turned on during a print, and charted the data:Cura 4.6.2:

Cura 4.7.1:

More information and methodology found on this post.
We can use this to detect and inform the user regarding when planner buffer underruns occur and serve as a base to understand if attempts at improving the problem is working, which should help!