Hello there,
I'd appreciate any help regarding an issue I found in my setup.
I've set up Ocelot in a production environment yesterday (~50 requests/sec). After about 18 hours in production, its memory usage is around 1.9 GB, and still growing. I ain't doing nothing special with it, just forwarding the web requests to a different port (Config attached).
I tried reading the documentation and navigating through GitHub Issues, but had no luck.
Any idea how can I find out why is Ocelot using so much memory?
Thanks in advance!
Ocelot.txt
 hbsis-fernandomedeiros
All 21 comments
@hbsis-fernandomedeiros potentially a memory leak, can you paste your configuration json, program and startup.cs and I will take a look.
 TomPallister
on 12 Jun 2018
TomPallister
on 12 Jun 2018
@hbsis-fernandomedeiros sorry i didnt see you already pasted the config...are you hosting on linux, windows or (not likely) mac?
TomPallister
on 13 Jun 2018
I got the same situation, 60 tps, high memory without reducing; config service discover with Consul
 fanhousanbu
on 14 Jun 2018
fanhousanbu
on 14 Jun 2018
Sorry for late response.
Currently, I'm running on Windows Server 2012. I'm using Peter Kottas' lib (https://github.com/PeterKottas/DotNetCore.WindowsService) to host it as Windows Services, so, my program.cs has some overhead to make it work.
I'll try to provide a working example. Right now, I'm trying to reproduce this behavior locally to memory-profile it, but it requires a heavy load and is taking a while...
Edit:
Accidentally closed, sorry.
hbsis-fernandomedeiros
on 14 Jun 2018
@hbsis-fernandomedeiros @fanhousanbu I cannot replicate this issue yet, but I will try on Windows and see what happens!
TomPallister
on 14 Jun 2018
@hbsis-fernandomedeiros I finally had time to look into this issue today.
I ran about 300 requests per second at Ocelot with JetBrains dotMemory profiler running. I used your configuration and I have not seen any increase in allocated objects over a period of 1 hour so I don't think that there is a memory leak in Ocelot.
If you can push the source code of the application you are running somewhere I might be able to diagnose the issue with it. However I don't think it is going to be Ocelot (it could be). There is a pretty big business that uses Ocelot and they have not reported any memory issues and this is something they would definitely pick up on.
My other suggestion is don't host your application with https://github.com/PeterKottas/DotNetCore.WindowsService and see if you get the same problem! Just use Kestrel.
TomPallister
on 20 Jun 2018
I do have the same issue. I'm using a mix between http and websocket calls.
OS: Windows
Hostservice does use the startup guide program configuration from: http://ocelot.readthedocs.io/en/latest/introduction/gettingstarted.html#net-core-2-0
My requirements: Load a page which then makes 70 requests to initialize the page, in the middle of all that create a ws connection to the backend which starts pushing values (~40v/s).
My Test (traced with dotmemory):
1 Client - Load page -> memory +10, +7k objects
31 Client - Load page -> memory +80, +60k objects
all clients close - memory -10, -10 k objects
So between the first launch and 32 client connecting and disconnecting
Memory +90MB, 62k objects
Same thing again
32 Clients - Load page -> memory +30, 40k objects
32 Client (run 5 minutes) -> memory +20, 10k objects
all clients close -> memory -15, -6k objects
no clients for 30 minutes -> memory +7, same
Second run
Memory +30MB, +40k objects
After that we results are always almost the same (Memory +30MB, +40k objects)
Between every snapshot i forced the gc multiple times to ensure the most optimal result.
This setup is reproducable and can be scales via the amount of clients (more clients = higher memory increase with each test run)
Configuration
1 Route -> http calls
1 Route -> ws connect
70 http calls initially then only values over ws
 Thio
on 22 Jun 2018
Thio
on 22 Jun 2018
@Thio thanks for helping with this issue! Would it be possible to upload code that shows how to replicate this issue? Also what are you using to get the memory allocations? Is it possible to get the full output of the trace?
TomPallister
on 22 Jun 2018
@hbsis-fernandomedeiros @Thio it would also help if you could upload the code of your respective applications that are having the memory problems so I can run it myself.
TomPallister
on 22 Jun 2018
Sorry for the delay. Sadly i cant provide you with the exact application. But i can provide you with the memory dump from dotmemory.
But i dont know how the error can't happen on your end, because even if i just access simple http api's without a realtime signalr connection the memory does "explode".
Testrun 1: simple config → all over HTTP requests (no SignalR)

Each client does around 20 simple http requests. And after around 120 Clients (2400 request) the memory already almost doubled and is still increasing with every testrun i do (this is important because it excludes the possibility of it being caching).
I have to redo the dotmemory dump because there is still some internal information in them. I hope the pics do give some inside in how the tests were conducted.
For the time being this where the top survived objects.
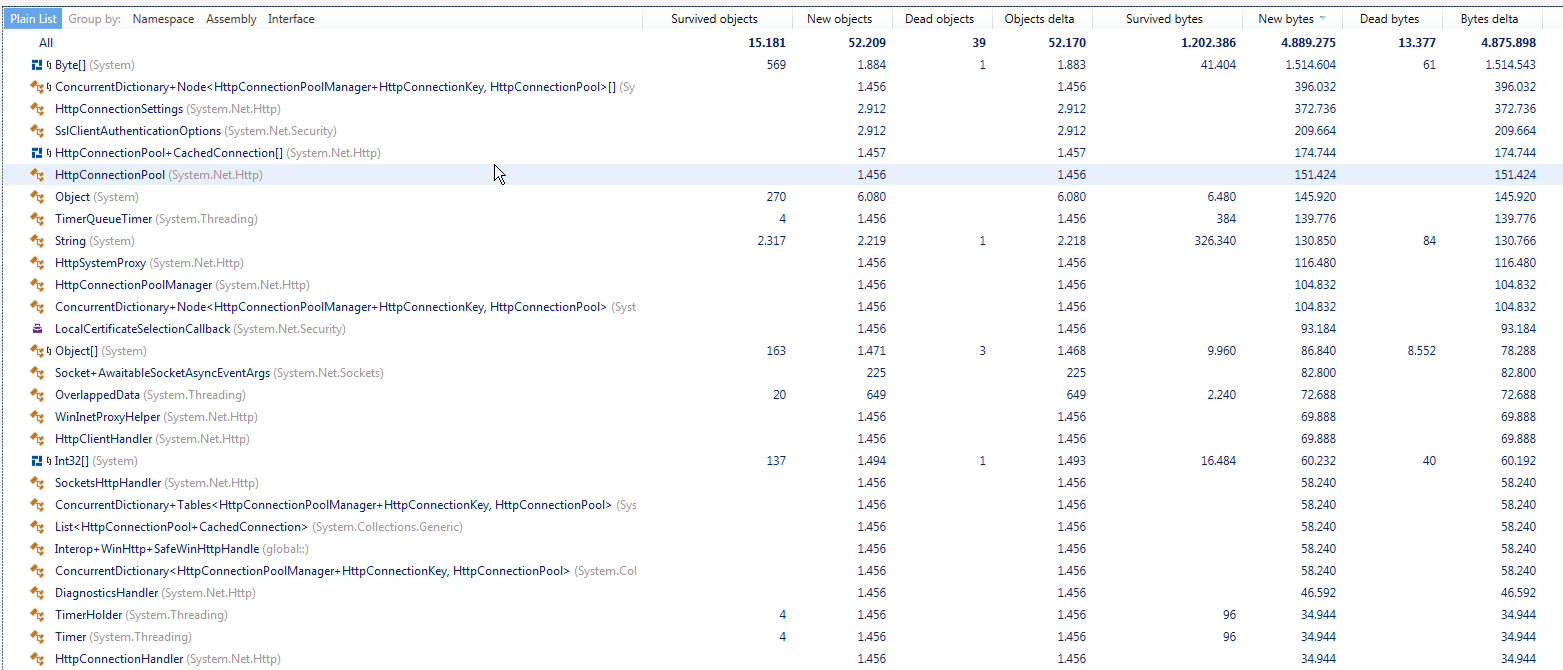
With websocket the problem is even bigger:
Testrun 3: simple config → HTTP and WS requests

Here there is also another problem. After letting this test continue for 3 hours the handle count exploded to over 100.000 handles. Sadly i cant remember the Thread but it also was an obscene amount. The memory was around 800 MB at that point.
PS:
I also found some interessting bug in asp.net core (https://github.com/dotnet/corefx/issues/27884, https://github.com/dotnet/corefx/pull/27900) but even after upgrading ocelot to asp.net core 2.1.1 it wasnt fixed =/ So I'm not sure if its not a bug in asp.net core =/
Thio
on 26 Jun 2018
@Thio - out of interest are you running Ocelot on .Net Core runtime or the full .Net runtime? If running .Net Core applications on the full .Net runtime check that you are NOT using server GC.
 MedAnd
on 26 Jun 2018
MedAnd
on 26 Jun 2018
@Thio thanks for the information and @MedAnd thanks for the help!!!
I do not see numbers like this but I will study the information more and see if I can work it out!! :(
TomPallister
on 26 Jun 2018
I do have the same issue. asp.net core 2.1.1 at IIS.
 coolincy
on 4 Jul 2018
coolincy
on 4 Jul 2018
@hbsis-fernandomedeiros @MedAnd @coolincy when you are using Ocelot have you built it in release mode?
I'm so confused by this issue because I dont know enough about memory in .net core. However I profiled a basic .net core app you can see the code here and the amount of memory grows over time just like you are seeing with Ocelot. I think this might be a .net core thing? When I look at the Ocelot memory profiles it seems all the allocated objects are coming from asp.net core code unless I am making a mistake!
TomPallister
on 4 Jul 2018
OK I finally got somewhere with this...there was an issue building up too much memory with MemoryHttpClientCache in Ocelot. I have refactored this and the problem has gone away.
However the memory still grows quite quickly. I noticed that TlsOverPerCoreLockedStacksArrayPool seems to be creating and holding onto a lot of bytes so I looked into it more and eventually go to this issue that was fixes in 2.1.0 https://github.com/dotnet/coreclr/pull/17078 so I will try upgrade and the MemoryHttpClientCache fix to see if the problem goes away!
TomPallister
on 4 Jul 2018
@hbsis-fernandomedeiros @MedAnd @coolincy can you advise if you are using server or workstation GC?
TomPallister
on 5 Jul 2018
Hi @TomPallister... still kicking the tyres however for all production workloads (especially Service Fabric) have been running & recommending using workstation GC...
MedAnd
on 5 Jul 2018
@MedAnd so you are using workstation GC?
@MedAnd @hbsis-fernandomedeiros @coolincy are you using windows to host Ocelot?
TomPallister
on 5 Jul 2018
@TomPallister not running in production with Ocelot however running dozens of other .NET Core microservices in Service Fabric on Windows. Using the full .Net 461 run-time and have seen various memory issues when using Server GC, hence recommend using workstation GC...
MedAnd
on 6 Jul 2018
@MedAnd yep workstation GC is recommended for most workloads I guess.
TomPallister
on 6 Jul 2018
@MedAnd @hbsis-fernandomedeiros @coolincy
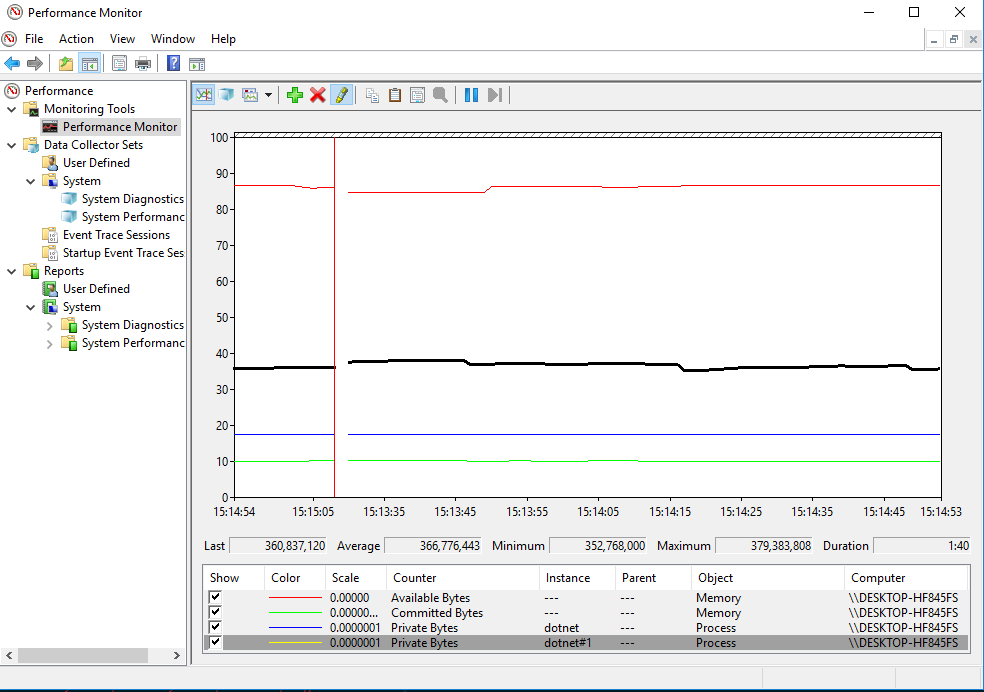
I have just pushed version 7.0.8 to NuGet that fixes a memory leak in the way we were caching HttpClient. After making the change my private bytes went to this and JetBrains .net trace stopped going crazy.
However if you are using netcoreapp2.1 you might still get the memory growth! I haven't actually updated Ocelot to work with netcoreapp2.1 yet. It turns out as usual it won't be a simple upgrade. The problem is HttpClientConnectionPool in netcoreapp2.1 is using LOADS of memory and just keeps growing for some reason that I need to work out.
I'm going to close this issue and have added https://github.com/ThreeMammals/Ocelot/issues/454 to track the netcoreapp2.1 support.
TomPallister
on 8 Jul 2018
Related issues
 lucianoscastro
·
3Comments
lucianoscastro
·
3Comments
 mjrousos
·
6Comments
mjrousos
·
6Comments
 dmitriifilonenko
·
5Comments
dmitriifilonenko
·
5Comments
 bremnes
·
3Comments
TomPallister
·
4Comments
bremnes
·
3Comments
TomPallister
·
4Comments
Most helpful comment
OK I finally got somewhere with this...there was an issue building up too much memory with MemoryHttpClientCache in Ocelot. I have refactored this and the problem has gone away.
However the memory still grows quite quickly. I noticed that TlsOverPerCoreLockedStacksArrayPool seems to be creating and holding onto a lot of bytes so I looked into it more and eventually go to this issue that was fixes in 2.1.0 https://github.com/dotnet/coreclr/pull/17078 so I will try upgrade and the MemoryHttpClientCache fix to see if the problem goes away!