Oceananigans.jl: one_dimensional_advection_schemes.jl fails
This set of tests also fails at least in part because of the lack of high order WENO as in #1271 , but the plots seem to use PyPlot and I ended up just getting a bunch of blank plots. I presume we wanted to update the plotting to use something else?
But I think some of the failures are that the orders do not match the theory close enough.
Test Summary: | Pass  Fail  Total
tmp           |   86     9     95
ERROR: LoadError: Some tests did not pass: 86 passed, 9 failed, 0 errored, 0 broken.
in expression starting at /home/fpoulin/software/Oceananigans.jl/validation/convergence_tests/one_dimensional_advection_schemes.jl:69
 francispoulin
All 26 comments
Hmm yeah I don't think we observe 5th order convergence for UpwindBiasedFifthOrder, for example.
It would be nice to use Plots, I think we were just sad to change because it might not be as easy to have xticks of the form 2^7...
@ali-ramadhan ?
 glwagner
on 15 Dec 2020
glwagner
on 15 Dec 2020
I figured out that the figures are all saved to a file and am including a couple of examples. I have a few thougths to share.
Updating plots shouldn't be difficult but don't know anything about the xticks mentioned above.
I think we have too many items in the legend. I think there should just be two sets of markers and the best fit.
Probably don't want to start at such a coarse grid as clearly we are far from convergence.
I think that UpwindBiasedFifthOrder just needs a little more effort to get the order. The curve seems to flatten out, which we all know should not happen. Maybe the time stepping error dominates and we need to reduce \Delta t?
I am happy to help fixing this (and other validations) but getting some help from someone who understands the script would be a lot faster.
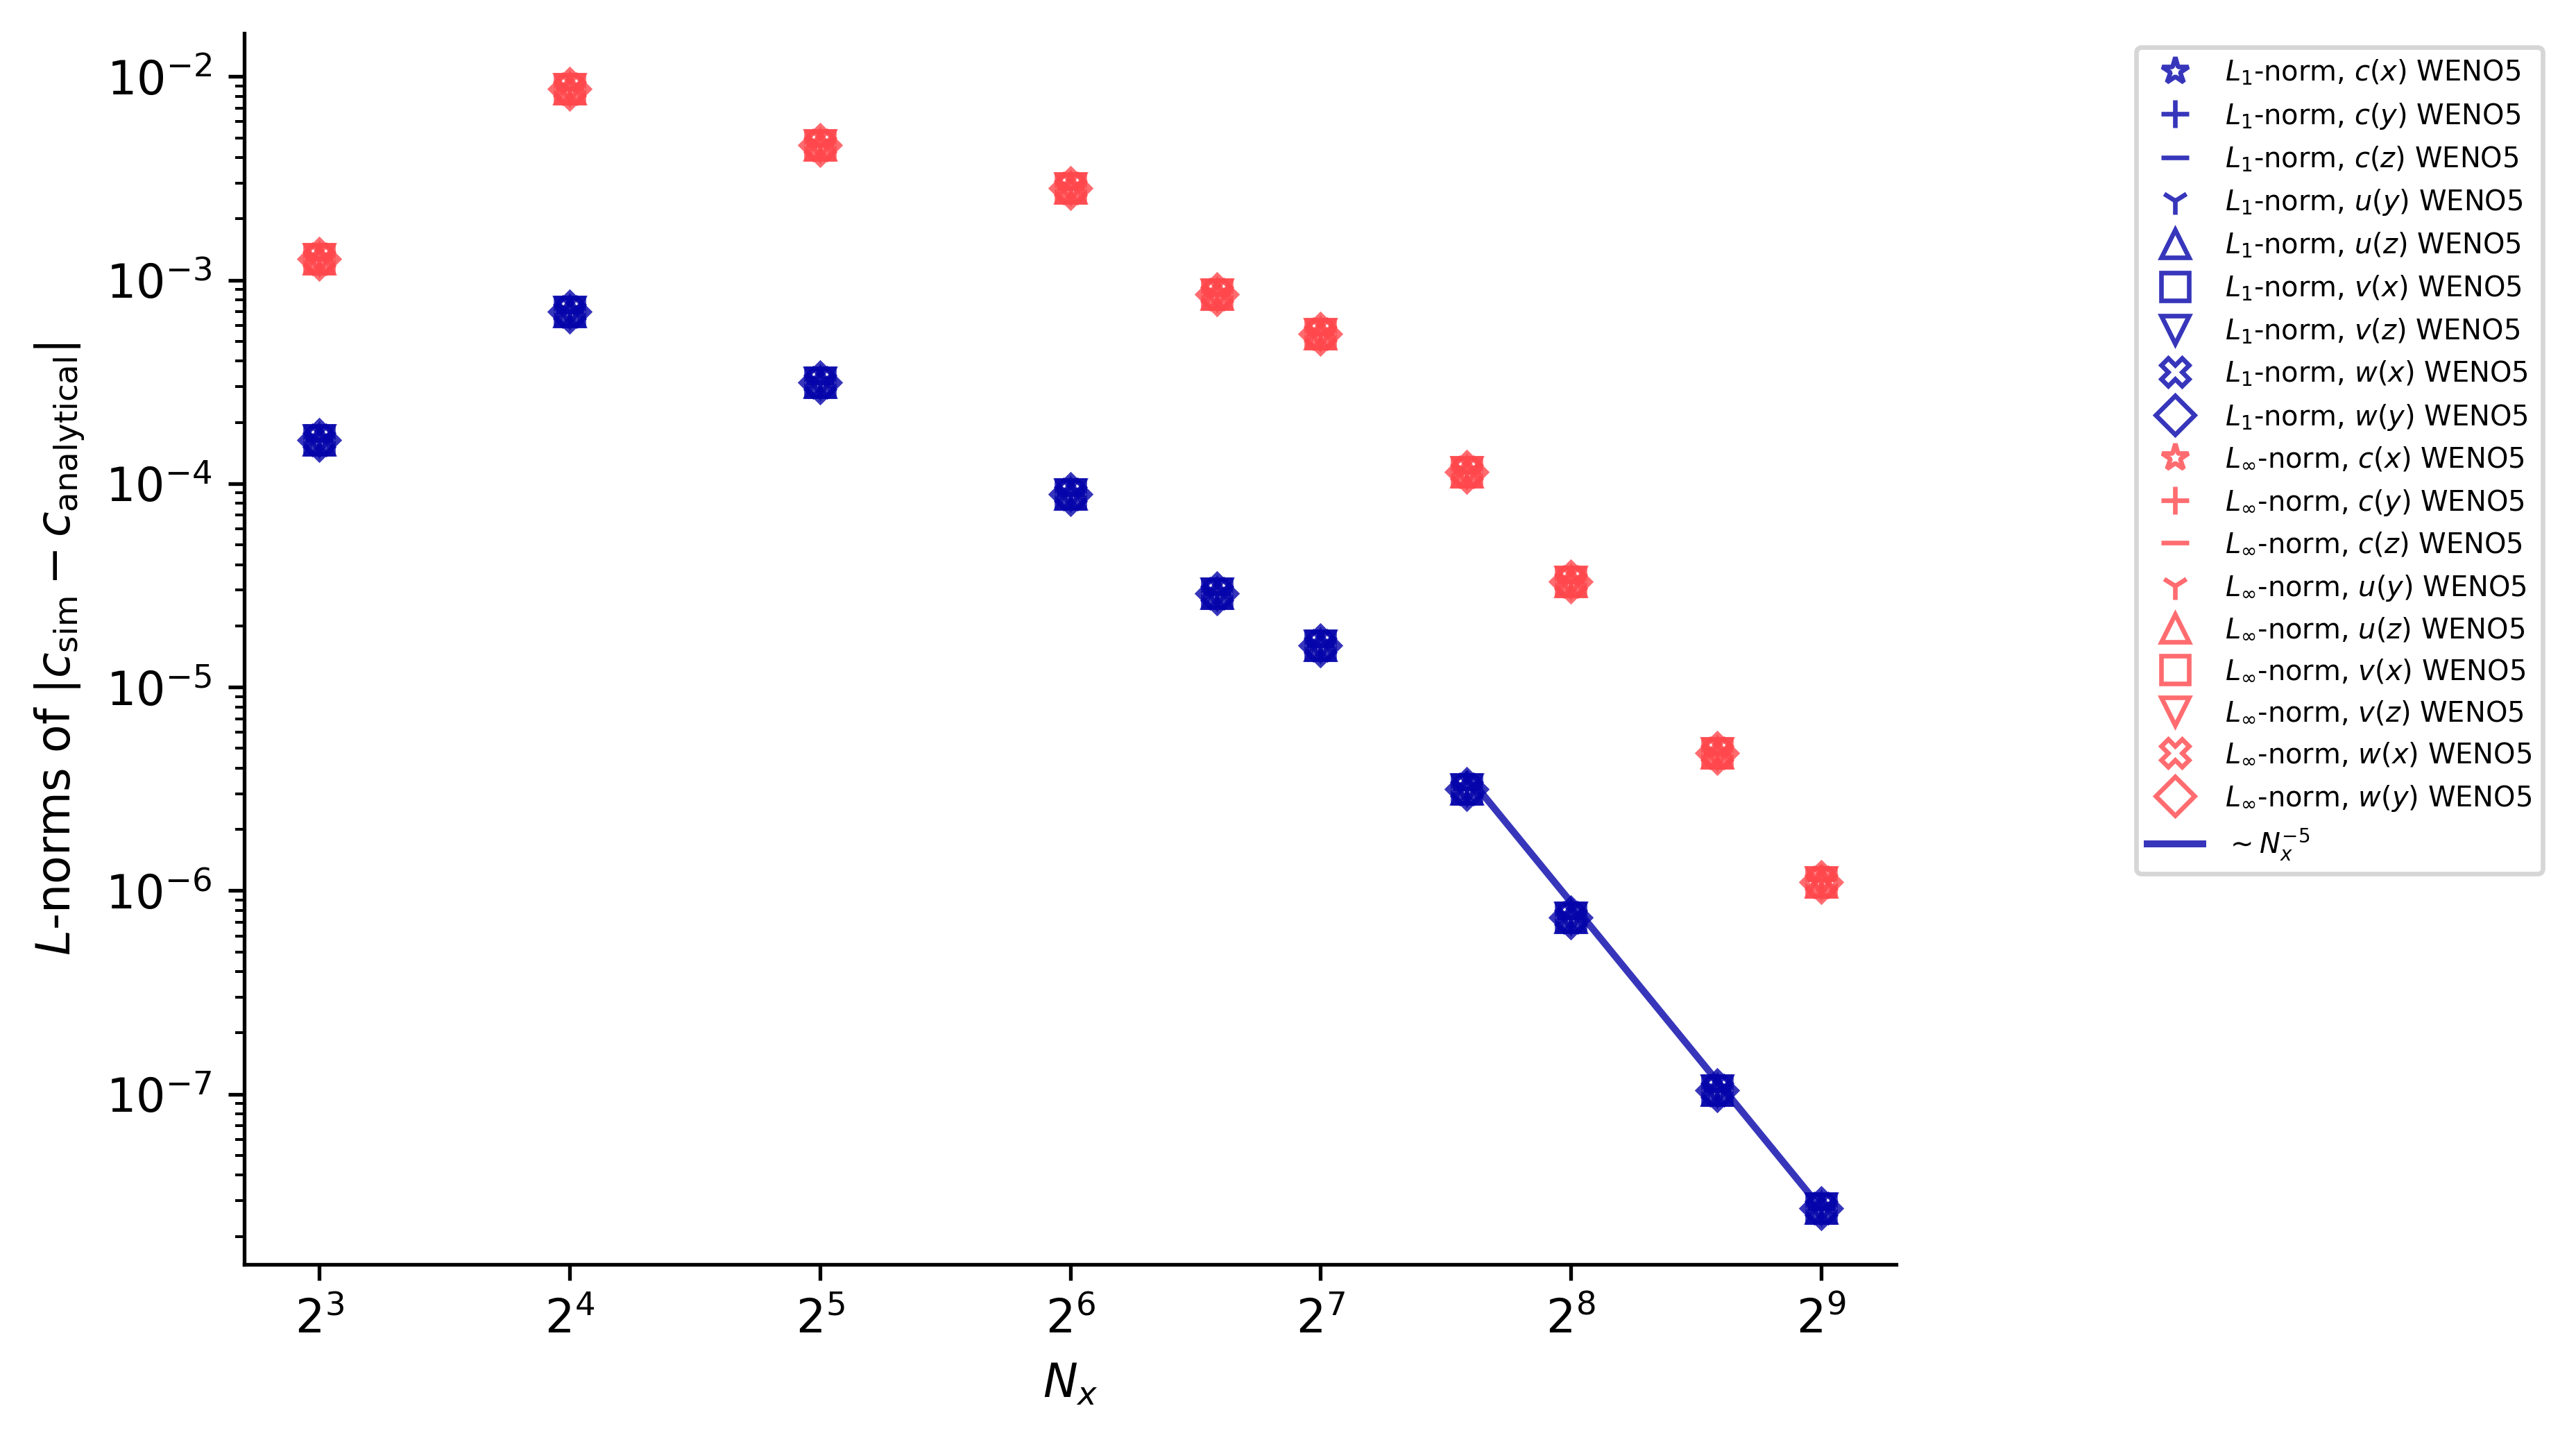
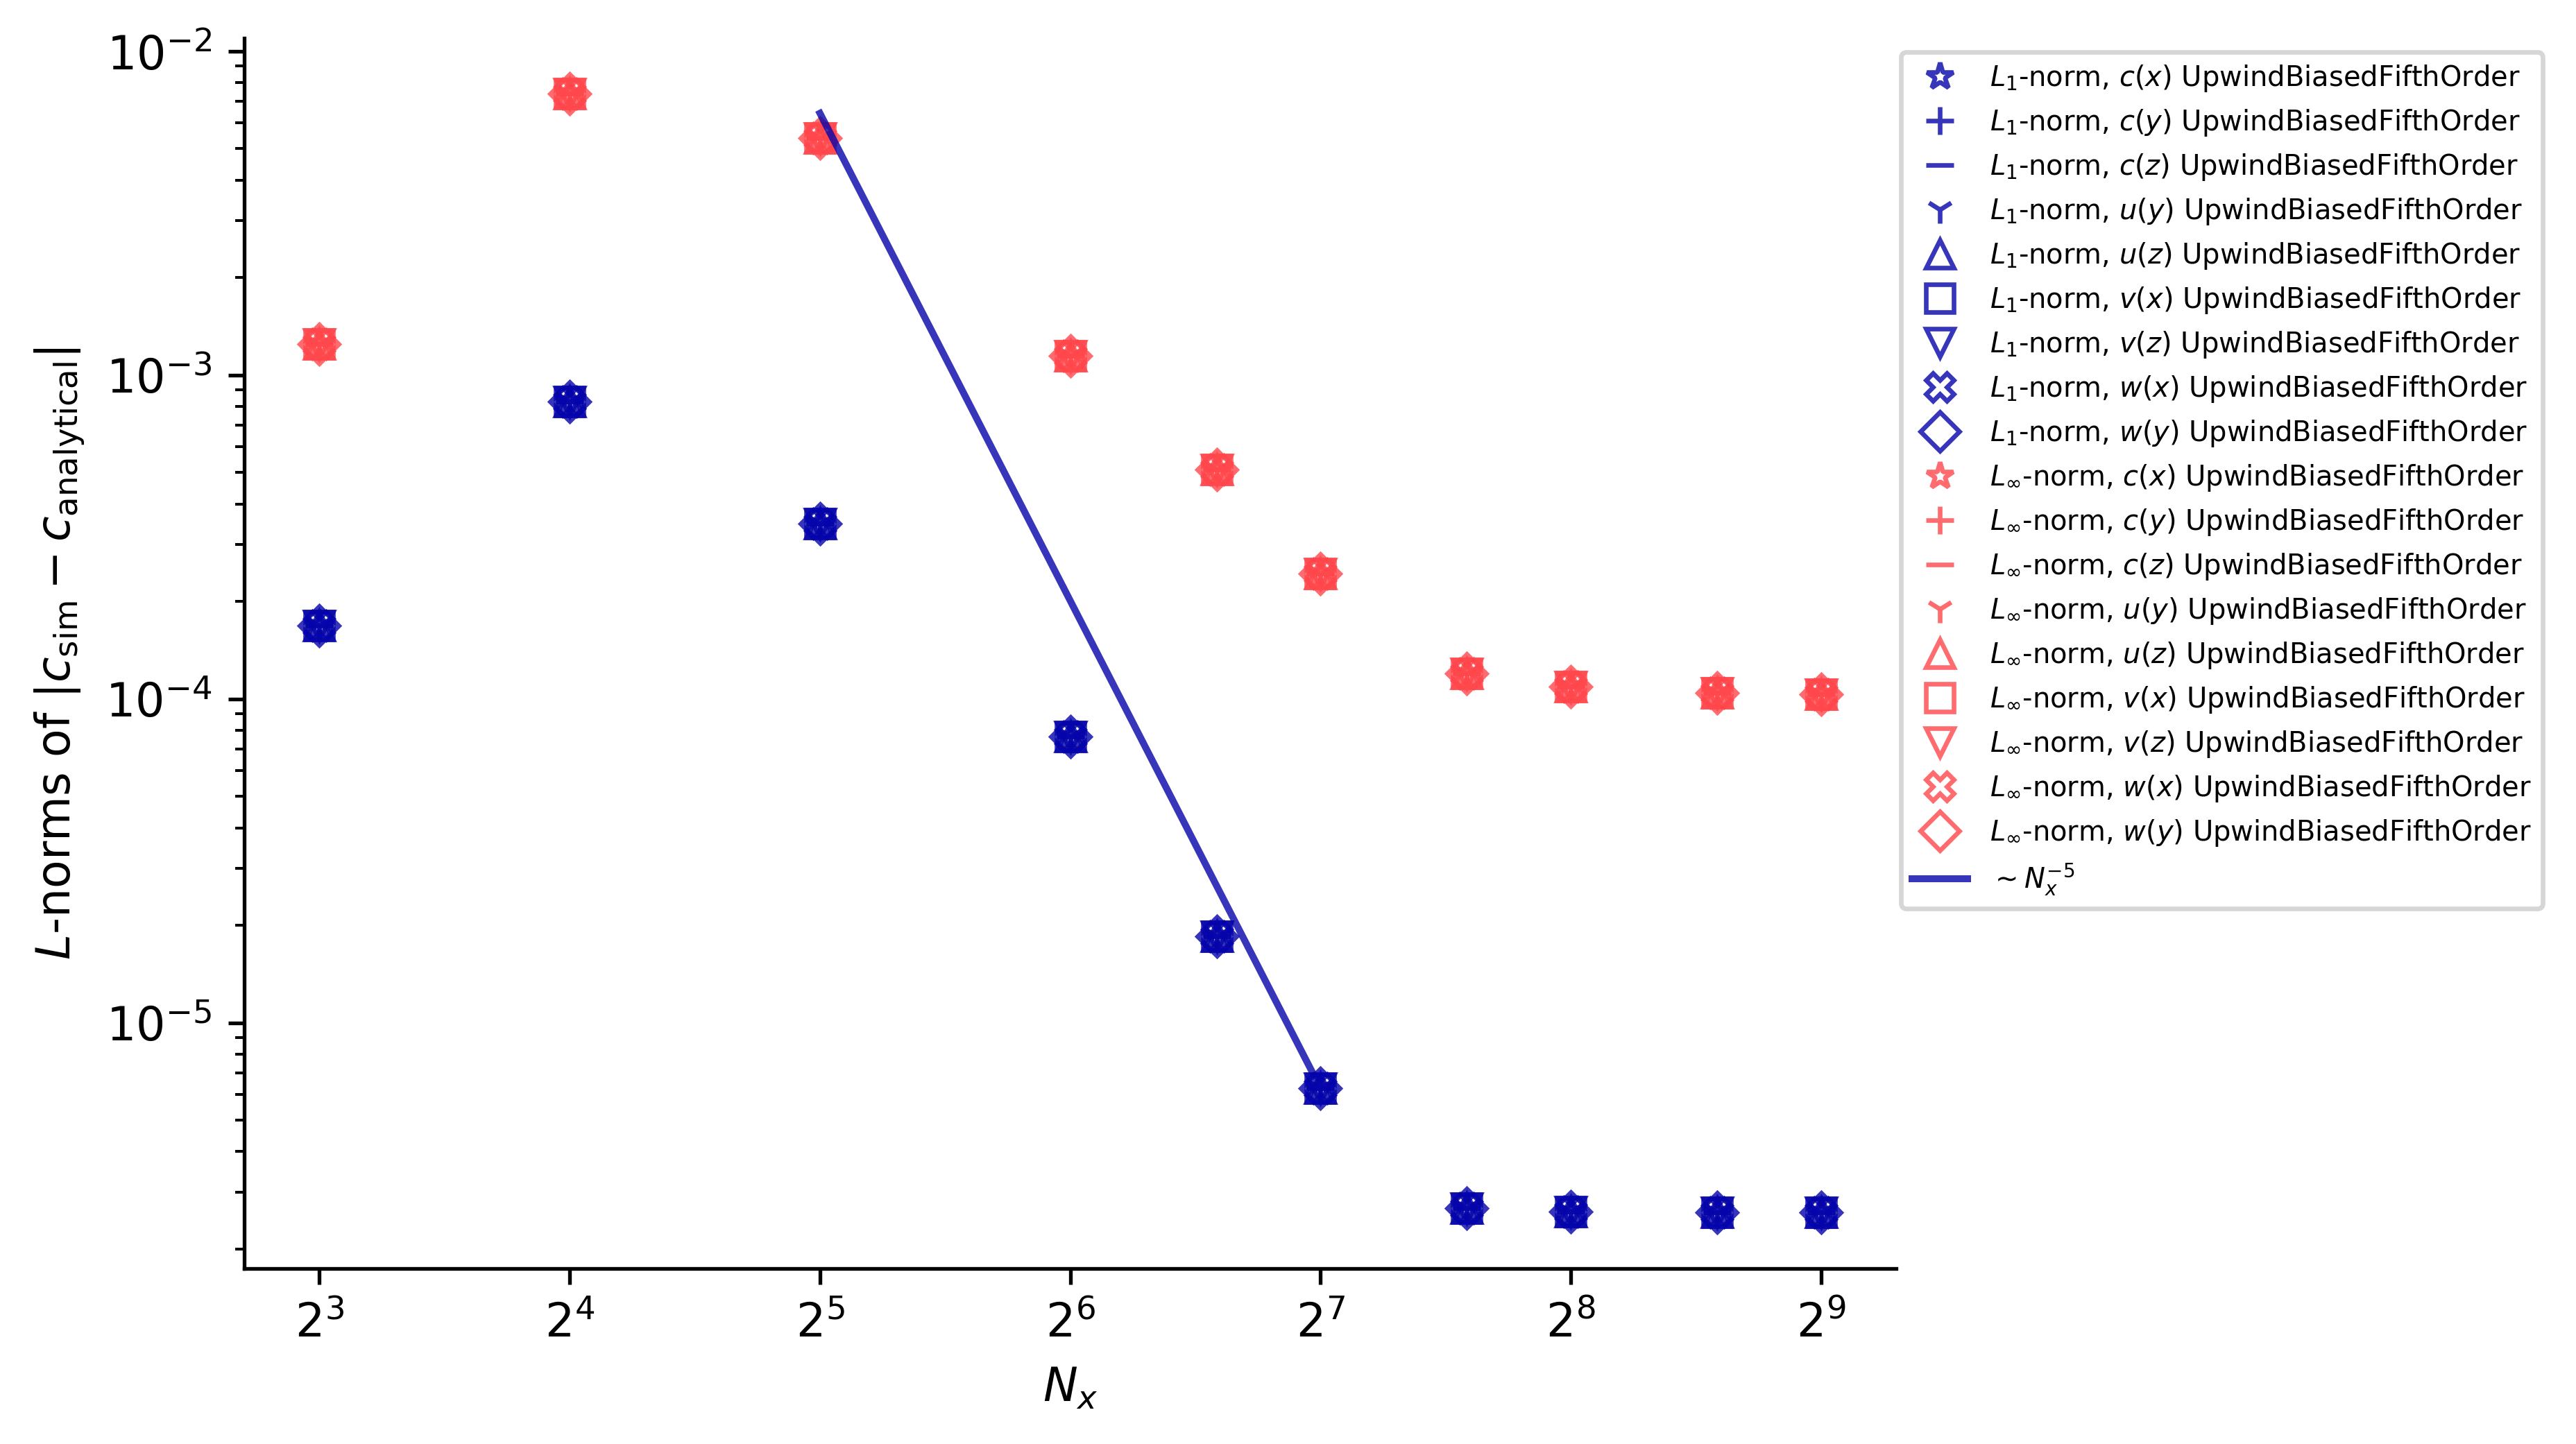
francispoulin
on 15 Dec 2020
The curve seems to flatten out, which we all know should not happen. Maybe the time stepping error dominates and we need to reduce \Delta t?
That seems like a likely culprit. I can't remember if I looked into that. Whatever it is I agree its a flaw in the test design that some other source of error dominates before asymptotic convergence is reached...
glwagner
on 15 Dec 2020
I am happy to help fixing this (and other validations) but getting some help from someone who understands the script would be a lot faster.
It'd be great to clean this up and I can help; we can zoom or you can ask questions here.
glwagner
on 15 Dec 2020
I have a few thougths to share.
I agree with the beautification you've suggested. Also formatting the xticks is far lower priority than readable convergence test plots.
glwagner
on 15 Dec 2020
Thanks @glwagner . I just created a branch that I'm going to play with. First I'm going to work on updating the plotting and then look more closely at the convergence issue. The plotting seems to happen in OneDimensionalUtils.jl. I will start there and let you know how it goes.
francispoulin
on 15 Dec 2020
A general question. In the tests a variable results is created, which is a mutable struct Dict. I see that map is a way to pick out elements of this object. When I ask for information on resutls I get something like this
julia> results
Dict{Any,Any} with 1 entry:
  CenteredSecondOrder => fill((cx = (simulation = [-8.07688e-137, -2.28227e-125, -1.9026e-114, -4.67931e-104, -3.39525e-94, -7.26804e-…
How do I get values from this object?
From looking in the scripts I gather that we need to use map but not sure what fields to get or how to get them.
I found out that I can get a bit more inside using results[CenteredSecondOrder] but still not sure how to access the arrays.
francispoulin
on 15 Dec 2020
What is typeof(results[CenteredSecondOrder])?
glwagner
on 15 Dec 2020
I am still learning how to parse the output but this is what I get.
```julia> typeof(results[CenteredSecondOrder])
Array{NamedTuple{(:cx, :grid),Tuple{NamedTuple{(:simulation, :analytical, :L₁, :L∞),Tuple{Array{Float64,1},Array{Float64,1},Float64,Float64}},Oceananigans.Grids.RegularCartesianGrid{Float64,Oceananigans.Grids.Periodic,Oceananigans.Grids.Periodic,Oceananigans.Grids.Periodic,OffsetArrays.OffsetArray{Float64,1,StepRangeLen{Float64,Base.TwicePrecision{Float64},Base.TwicePrecision{Float64}}}}}},0}
Also, I found that I can use map in the following way
julia> c_ana = map(r -> r.cx.analytical[:], results[CenteredSecondOrder])
0-dimensional Array{Array{Float64,1},0}:
[8.339763449228298e-167, 9.289942488656767e-154, 3.0530062298945994e-141, 2.960041007581741e-129, 8.466874781928682e-118, 7.14502772471784e-107, 1.7788530458865225e-96, 1.3065667360543323e-86, 2.831251796148466e-77, 1.8100091259558352e-68 … 6.525187676003588e-221, 1.7125465800091643e-236, 1.3260110721966124e-252, 3.0290558443461884e-269, 2.0413749536348825e-286, 4.058762655833247e-304, 2.2e-322, 0.0, 0.0, 0.0]
```
Then I can access the array using `c_ana[1]'. This seems strange to me but I guess this is what I need to be doing?
francispoulin
on 15 Dec 2020
Feel free to change the data structures. I think I just hacked something messy together.
Looks like
results[CenteredSecondOrder]is anArray- the elements of
results[CenteredSecondOrder]areNamedTuple. - write
propertynames(results[CenteredSecondOrder][1])to see the properties of thisNamedTuple - as you've shown, one property is
cx(I think thecconcentration in a simulation wherexis the coordinate of interest cxis itself aNamedTuplewith fieldssimulation,analytical,L₁,L∞- you can find these by typing
propertynames(results[CenteredSecondOrder][1].cx)
hope that helps.
glwagner
on 15 Dec 2020
Ok, what is the result of
julia> propertynames(results[CenteredSecondOrder][1].cx.analytical)
?
(paste the whole expression including what you've typed at the prompt so that we can verify what was entered is also correct)
glwagner
on 15 Dec 2020
I like the structure you propose and am happy to proceed along those lines.
I tried what you suggested and have a very boring output.
julia> propertynames(results[CenteredSecondOrder][1].cx.analytical)
()
I have created a branch and started to make changes to use Plots.jl. Attached are some not so excting plots that are the first of many to come.
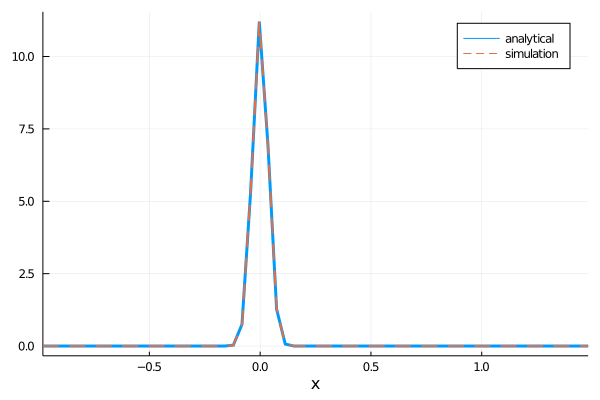
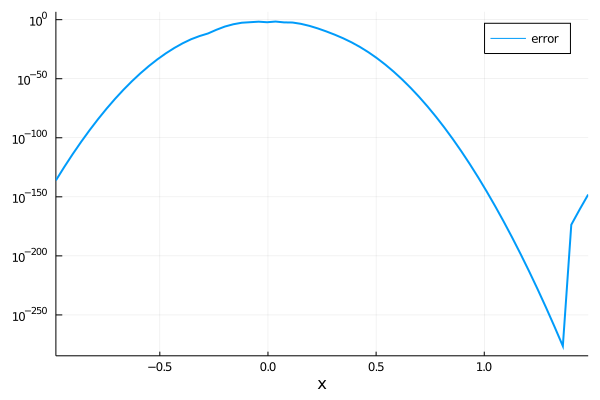
I do have a question on how to do something. If you look in the code here you will see that I need to put in the advection scheme for this to work.
My next step is to try looking over a couple of schemes, but can't do that using the current syntax. Any advice on what I need to change? The old code just had results, which I would like to have as well, but not sure why it's not working.
francispoulin
on 15 Dec 2020
Ah, ok maybe you want to try
typeof(results[CenteredSecondOrder][1].cx.analytical)
Can you describe in detail what you would like to do?
glwagner
on 15 Dec 2020
On master there is an object called all_results, which is looped over:
It looks like you've omitted the loop over the contents of all_results.
glwagner
on 15 Dec 2020
I removed that because in master the length of results is just 1, so there is nothing to look over.
In one_dimensional_gaussian_advection_diffusion.jl at this line it forms all_results by combining different results and I don't believe that I do that in this code. I just have their version of advection_results.
francispoulin
on 15 Dec 2020
Even if the length is 1, you are missing these lines:
glwagner
on 15 Dec 2020
When I try your suggestion I get that it is an Array, which is good to know.
julia> typeof(results[CenteredSecondOrder][1].cx.analytical)
Array{Float64,1}
I wonder if a simpler idea is to call the plotting for each advection_scheme, that way the scheme is fixed.
Clearly results is a very powerful and almost all knowing variable, but I am struggling with how to pin it down.
francispoulin
on 15 Dec 2020
I have removed names and linestyle for now, but will get back to this when things are working.
I changed the input argument to simply be results, instead of all_results, but maybe that was a bad idea. I can try it now and see how it works.
francispoulin
on 15 Dec 2020
I suggest looking at results in the REPL and using things like propertynames and typeof to understand its data structure.
glwagner
on 15 Dec 2020
Sorry, didn't mean to close the issue.
glwagner
on 15 Dec 2020
Okay, I figured that part of it out.
t_scheme = typeof(scheme)
results[t_scheme] = run_convergence_test(κ, U, Nx, scheme)

legends = plot_solutions!(results, t_scheme)
Following a previous example, I forgot that I defined results[t_scheme]. Not sure if we need to do this but I found that passing t_scheme as an argument helps. Now i have the structure that we had before.
Next, to try and do multiple resolutions and see how badly that breaks ;)
francispoulin
on 15 Dec 2020
I am happy to say that I am now able to get plots of the solutions and errors for a range of resolutions and advections_schemes. I have also learned a lot about Plots.jl in the process.
Tomorrow I will work on modifying plot_error_convergence!, since that actually gives us the plots that we want.
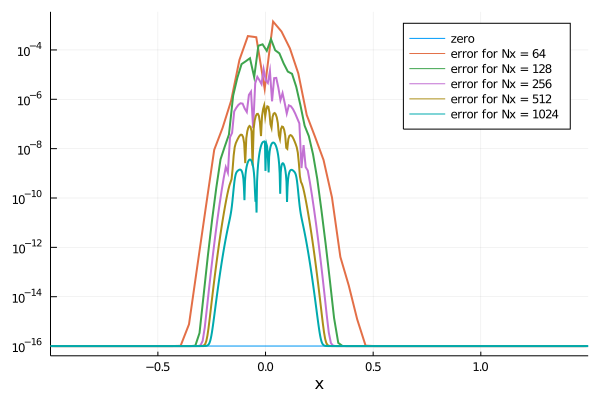
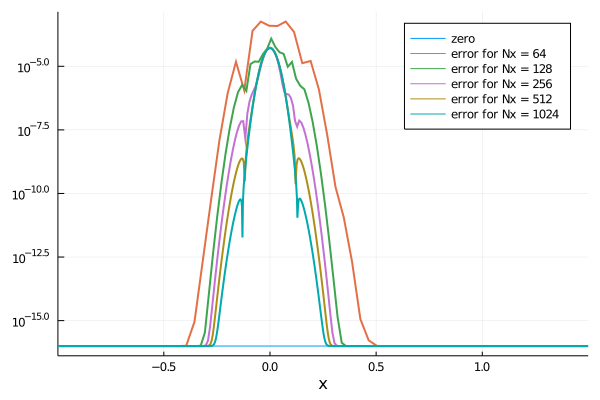
Here are a couple of samples. They can and will be improved up.
The first is the error for WENO5 and the scaling matches the theory very well, as I will confirm tomorrow.
The second is the error from the UpwindBiasedFifthOrder, that shows that the error in the centre does not converge. I would guess this is either a time stepping problem or perhaps a but somewhere.
francispoulin
on 16 Dec 2020
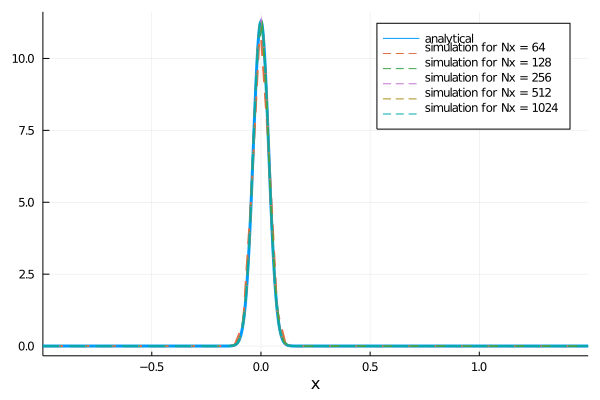
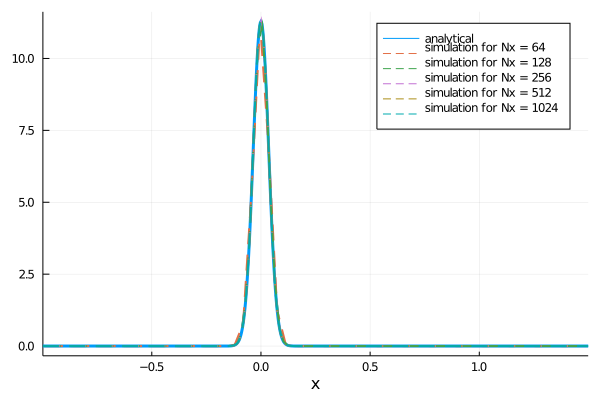
A question: Below are two plots of the profiles at the different resolutions for 2nd order Center Differencing and WENO5. Even though the accuracies are quite differente, they look almost identical. Are these plots we want to create?
francispoulin
on 16 Dec 2020
Should we open a PR and discuss further there?
glwagner
on 16 Dec 2020
Sure. I'm now working on making plots of convergence and should be able to get that done today.
One issue is that I have commented out a lot of stuff, which was there before. I've focused on making the one advection test and haven't integrated it into the other tests, yet. Not sure if this is a problem?
I will create a PR later today.
francispoulin
on 16 Dec 2020
Related issues
 truedichotomy
·
8Comments
truedichotomy
·
8Comments
 ali-ramadhan
·
7Comments
glwagner
·
5Comments
ali-ramadhan
·
7Comments
glwagner
·
5Comments
 Yesse42
·
7Comments
ali-ramadhan
·
3Comments
Yesse42
·
7Comments
ali-ramadhan
·
3Comments