Nuxt.js: How to debug nuxt in JetBrains WebStorm?
All 19 comments
I'm not user of WebStorm, but you should be able to add this task to your package. json:
"scripts" {
  "dev":"nuxt",
  "dev-debug":"node --debug node_modules/.bin/nuxt",
then run the dev-debug script via webstorm debug mode.
(inspired by VS Code debugging: https://medium.com/@marshallswain/debugging-nuxt-js-with-visual-studio-code-724920140b8f)
 NicoPennec
on 5 Sep 2017
NicoPennec
on 5 Sep 2017
No sure how to do this.
I added "dev-debug": ""dev-debug": "node --inspect node_modules\\nuxt\\bin\\nuxt" to scripts.
(Windows version with node 8)
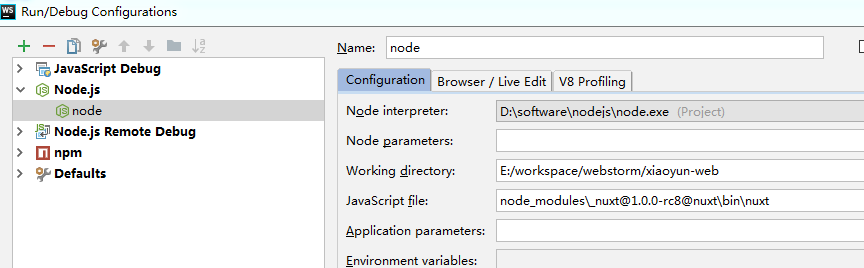
Then configured IntelliJ like this:

When I click "Debug" the app is starting. I can open Chrome Developer Tools and connect to the Node.
But the breakpoints in the IntelliJ doesn't work and in the Chrome Sources I see only node_modules
 awronski
on 5 Sep 2017
awronski
on 5 Sep 2017
debug config:
add debugger to vue:

debug:

 xiaoyun-studio
on 5 Sep 2017
xiaoyun-studio
on 5 Sep 2017
@xiaoyunStudio Thanks for help. The IDE starts the app, doesn't stops at breakpoints but at least stops at debugger.
But the problem is that all variables are undefined.

Any suggestions?
awronski
on 5 Sep 2017
I would also love to be able to use breakpoints. Anyone have any ideas?
The above setup using the debugger trick is also working for me in IntelliJ IDEA Ultimate. Thank you for sharing this, @xiaoyunStudio - even this is already helping a lot.
I have found it useful to wrap the debugger statement like this, so the browser will keep re-triggering the page load on changes, without getting stuck in the chrome devtools when it hits the broken line:
if (context.isServer) {
    debugger
}
 AdmiralPotato
on 5 Sep 2017
AdmiralPotato
on 5 Sep 2017
Wow. I really love this topic. Would be awesome if we have a section in docs FAQ about "How to debug SSR" before closing issue. (& Certainly, contributions welcome)
 pi0
on 5 Sep 2017
pi0
on 5 Sep 2017
Hi! There must be a way to do this. WebStorm is the one or maybe event the best IDE. If it is possible to debug React or webpack why not Nuxt.
I follow both @xiaoyunStudio suggestion and official WebStorm docs but it doesn't work as it suppose to. Especially the undefined variables are big problem. With this debuging is useless.
There must be someone who know how to do this :)
awronski
on 6 Sep 2017
Also same question for this debug feature , all the variables are undefined ,
Why close this topic here?
 alterhu2020
on 27 Sep 2017
alterhu2020
on 27 Sep 2017
I am also looking for answer to this, has anyone found a proper solution yet ?
 fbrbovic
on 6 Oct 2017
fbrbovic
on 6 Oct 2017
Not sure why this was closed, @xiaoyun-studio? Debugging the serverside part of the code is a crucial part of any serious development, the current approach of simply logging errors and showing an error page is not sufficient.
 Etheryte
on 9 Oct 2017
Etheryte
on 9 Oct 2017
Is there an update on this? This is a 100% must have feature in my book.
 jetrii
on 16 Mar 2018
jetrii
on 16 Mar 2018
..bump
 o1lab
on 17 May 2018
o1lab
on 17 May 2018
bump bump
 uptownhr
on 18 May 2018
uptownhr
on 18 May 2018
I have posted configuration for Webstorm in issue #2781
 LancerComet
on 29 Jun 2018
LancerComet
on 29 Jun 2018
LancerComet's configuration works so far only allow the breakpoint show at the right line. However the variables are still undefined. I knew the variable is defined because I have a line "console.log(theVariable);" right before "debugger" and the output is right. But if I type "theVariable" on the console it's not defined. How can this happen? My guessing is that this is not a source map problem but webpack / loader issue? Anyone has a solution to the variable undefined problem?
 bingtimren
on 24 Aug 2018
bingtimren
on 24 Aug 2018
Ok I may have find a way to work with this variable undefined problem, not to solve the problem. The variables are there, but under a different name. For example, I have "import {Auth} from 'aws-amplify'". I know it worked cause right before "debugger" I have "console.log(Auth)" and it worked. However if I type "Auth" in console it said the variable is not defined.
If I switch to "sources" tab and look at the "Local" tab at the right side, although I cannot find "Auth", I can find "__WEBPACK_IMPORTED_MODULE_1_aws_amplify__" and then "__WEBPACK_IMPORTED_MODULE_1_aws_amplify__.Auth" would be what I'm looking for.
So, all variables should be there, it's just not the same name. In other words, what's running (where __WEBPACK_IMPORTED_MODULE_1_aws_amplify__ is inside) is different from what's shown in the inspector (the original file where "Auth" is inside).
This is still painful but not that miserable. Hope this helps.
bingtimren
on 24 Aug 2018
And this seems to relate to webpack transpiling. I tested with the nuxt starter template. In pages/index.vue, if I put "debugger" under "import AppLogo from '~/components/AppLogo.vue'", open Chrome inspector, upon paused, I cannot find "AppLogo" in the local variable but __WEBPACK_IMPORTED_MODULE_0__components_AppLogo_vue__. Now if I change the line "import AppLogo from '~/components/AppLogo.vue" to "const AppLogo = require('~/components/AppLogo.vue')" and reload page, upon pause, I can find AppLogo in local variables.
bingtimren
on 24 Aug 2018
Ok. For the local variable disappear problem, if I set devtool to 'eval' with the following code in nuxt config.
build: {
extend (config, { isDev, isClient }) {
config.devtool = 'eval'
.....
At break point, I can see the "real" code my browser is running (after compiled), not the code I wrote in the component. The real code would, of course, works exactly the same as the code I wrote (at least, should be), but is different. This should explain the missing local variables.
bingtimren
on 27 Aug 2018
This thread has been automatically locked since there has not been any recent activity after it was closed. Please open a new issue for related bugs.
![lock[bot] picture](https://avatars1.githubusercontent.com/in/6672?v=4&s=40) lock[bot]
on 1 Nov 2018
lock[bot]
on 1 Nov 2018
Related issues
 danieloprado
·
3Comments
danieloprado
·
3Comments
 bimohxh
·
3Comments
bimohxh
·
3Comments
 shyamchandranmec
·
3Comments
shyamchandranmec
·
3Comments
 pehbehbeh
·
3Comments
pehbehbeh
·
3Comments
 msudgh
·
3Comments
msudgh
·
3Comments
Most helpful comment
Also same question for this debug feature , all the variables are
undefined,Why close this topic here?