Hi,
in the last days I started to have issues with my notebooks not showing some plots - I get outputs like [<matplotlib.lines.Line2D at 0x16b6dc2e8>] (similarly to #1620 )
In particular, I have a plot disappearing when I add labels such as plt.xlabel - without that it's shown regularly
I always run %matplotlib inline at the beginning of my notebooks
Any idea of what is happening?
Thanks for your support.
ps: on safari 11.0.3 and notebook 5.4.1
 ggrrll
All 36 comments
ok, it seems that this problem disappears when I comment (do not run)
from IPython.core.interactiveshell import InteractiveShell
InteractiveShell.ast_node_interactivity = "all"
( which I actually really like, as I don't have to print(my_out) at every line ...anyways )
... any idea if there is a conflict there and how to avoid it?
Thanks
ggrrll
on 10 Apr 2018
Hi. I like to set it "all". Finally, I found that you can put a semicolon after "plt.show()"......... That's great.
 junhaowww
on 25 Apr 2018
junhaowww
on 25 Apr 2018
ok,
plt.show(); seem to solve the issue (for now) – thanks @junhaowww !
ggrrll
on 25 Apr 2018
well,
apparently plt.show(); doesn't seem to work always...no idea what's going on...
ggrrll
on 27 Apr 2018
I see. You can add ; to the last line of codes. For example:
- normal case
a = 1
b = 1
# do plotting
plt.show();
- special case
a = 1
b = 1
# do plotting
plt.show()
# if plt.show() is not on the last line
a = 2;       # like this
as soon as I add other plotting commands such as plt.xlabel(my_label) no plot is shown with both
plt.show() or plt.show();
(I also tried to put plt.xlabel(my_label); which does not work either ...)
... there must be some sort of conflict with those commands and the interactiveshell...
ggrrll
on 1 May 2018
ok, it seems to be unrelated to those shell settings. It's probably related to the matplotlib backend settings
I usually use:
%matplotlib inline
sns.set_context('notebook')
%config InlineBackend.figure_format = 'retina'
in a simple example I am working for instance,
plt.hist(my_panads_series) did not work, even with those settings disabled, while my_panads_series.hist() did ... again, no idea ...
ps: I am on mac os 10.13.4, matplotlib 2.2.2, notebook 5.4.1
ggrrll
on 3 May 2018
Unfortunately, I think this is the downside of trying to make plot displaying 'just work' - when it doesn't work, it can be pretty mystifying to figure out what's going wrong. I don't have any great ideas at the moment, sorry. :-(
 takluyver
on 3 May 2018
takluyver
on 3 May 2018
@takluyver thanks anyway :) – I will update it in case I figure out something more
ggrrll
on 4 May 2018
I cannot plot with axes as well. axes.plot() return a list with a Lines object... No idea what is going on...
 nazariyv
on 15 Aug 2018
nazariyv
on 15 Aug 2018
ImportError Traceback (most recent call last)
----> 1 get_ipython().magic('matplotlib inline')
/home/shree/anaconda3/envs/tensorflow/lib/python3.4/site-packages/IPython/core/interactiveshell.py in magic(self, arg_s)
2156 magic_name, _, magic_arg_s = arg_s.partition(' ')
2157 magic_name = magic_name.lstrip(prefilter.ESC_MAGIC)
-> 2158 return self.run_line_magic(magic_name, magic_arg_s)
2159
2160 #-------------------------------------------------------------------------
/home/shree/anaconda3/envs/tensorflow/lib/python3.4/site-packages/IPython/core/interactiveshell.py in run_line_magic(self, magic_name, line)
2077 kwargs['local_ns'] = sys._getframe(stack_depth).f_locals
2078 with self.builtin_trap:
-> 2079 result = fn(args,*kwargs)
2080 return result
2081
/home/shree/anaconda3/envs/tensorflow/lib/python3.4/site-packages/IPython/core/magic.py in
186 # but it's overkill for just that one bit of state.
187 def magic_deco(arg):
--> 188 call = lambda f, a, *k: f(a, *k)
189
190 if callable(arg):
/home/shree/anaconda3/envs/tensorflow/lib/python3.4/site-packages/IPython/core/magics/pylab.py in matplotlib(self, line)
98 print("Available matplotlib backends: %s" % backends_list)
99 else:
--> 100 gui, backend = self.shell.enable_matplotlib(args.gui)
101 self._show_matplotlib_backend(args.gui, backend)
102
/home/shree/anaconda3/envs/tensorflow/lib/python3.4/site-packages/IPython/core/interactiveshell.py in enable_matplotlib(self, gui)
2933 """
2934 from IPython.core import pylabtools as pt
-> 2935 gui, backend = pt.find_gui_and_backend(gui, self.pylab_gui_select)
2936
2937 if gui != 'inline':
/home/shree/anaconda3/envs/tensorflow/lib/python3.4/site-packages/IPython/core/pylabtools.py in find_gui_and_backend(gui, gui_select)
257 """
258
--> 259 import matplotlib
260
261 if gui and gui != 'auto':
ImportError: No module named 'matplotlib'
why its showing No module named 'matplotlib' for %matplotlib inline ?
 shivrajganacharya
on 18 Aug 2018
shivrajganacharya
on 18 Aug 2018
Splitting matplotlib statements into multiple Jupyter input cells may cause nothing to appear. Check if all your statements are in the same cell.
 manujchandra
on 27 Aug 2018
manujchandra
on 27 Aug 2018
multiple
Yes! Put all in one cell and the pic came out!
 shanshiner
on 29 Nov 2018
shanshiner
on 29 Nov 2018
hi,@ggrrll, have you solved this problem yet ?
I met this problem recently when using the plt.hist() for the histgram, and the dataset read from mysql. Hoping for your reply. :)
 lionlhy
on 28 Apr 2019
lionlhy
on 28 Apr 2019
The problem was solved after few weeks since then (no idea how), but I still left it open in case other people had similar issue ... -- we can close I guess
ggrrll
on 29 Apr 2019
+1
This all worked fine just this morning and then suddenly getting an issue while working on the EDX DAT 228 course for Azure ML.

 alanflanders
on 24 May 2019
alanflanders
on 24 May 2019
I still does this problem , charts appear but values does not.
empty charts simply
 ugurkanates
on 22 Aug 2019
ugurkanates
on 22 Aug 2019
I'm having a similar problem. When I do fig = plt.figure(), a blank figure pops up, and then I try to add things to it, and nothing happens when I do a plt.show() at the end.
 deichdeich
on 9 Sep 2019
deichdeich
on 9 Sep 2019
Hey I'm experiencing this issue still. This issue appears not to be resolved. I'm using the latest version of python and when I try to get plots it either doesn't show or gives a textual description of the plot!d

 profPlum
on 23 Sep 2019
profPlum
on 23 Sep 2019
Your plot has been export successfully but without showing in jupyter. %matplotlib inline , insecting this will make it .
lionlhy
on 24 Sep 2019
Man, this issue is not resolved... I'm facing this nonsense today!!! November 27th, 2019!! I have no idea why the plots won't show! I'm using matplotlib in a colab notebook. :/
 rafaelgdp
on 28 Nov 2019
rafaelgdp
on 28 Nov 2019
I take it back. I just tried @lionlhy suggestion with the "%matplotlib inline" thing and it miraculously worked! Thanks! :P
rafaelgdp
on 28 Nov 2019
if you are using %matplotlib notebook
do use-
%matplotlib inline
 chourasiaankur1
on 20 Dec 2019
chourasiaankur1
on 20 Dec 2019
In jupyter notebook it works, in jupiter lab it does not... why???
 formazione
on 29 Dec 2019
formazione
on 29 Dec 2019
An issue with plt.bar() is that if there are too many bars, they are not visible. Try increasing the figure size:
plt.figure(figsize=(20,17))
or reduce x,y to see if they start appearing
or try seaborn.barplot() instead
 danielmlow
on 23 Jan 2020
danielmlow
on 23 Jan 2020
I take it back. I just tried @lionlhy suggestion with the "%matplotlib inline" thing and it miraculously worked! Thanks! :P
Where you have used "%matplotlib inline"? Writing just above the command line of google colab where i run the file "!python run_file.py" is not worked for me. What may be the solution for google colab?
 CBD88
on 29 Jan 2020
CBD88
on 29 Jan 2020
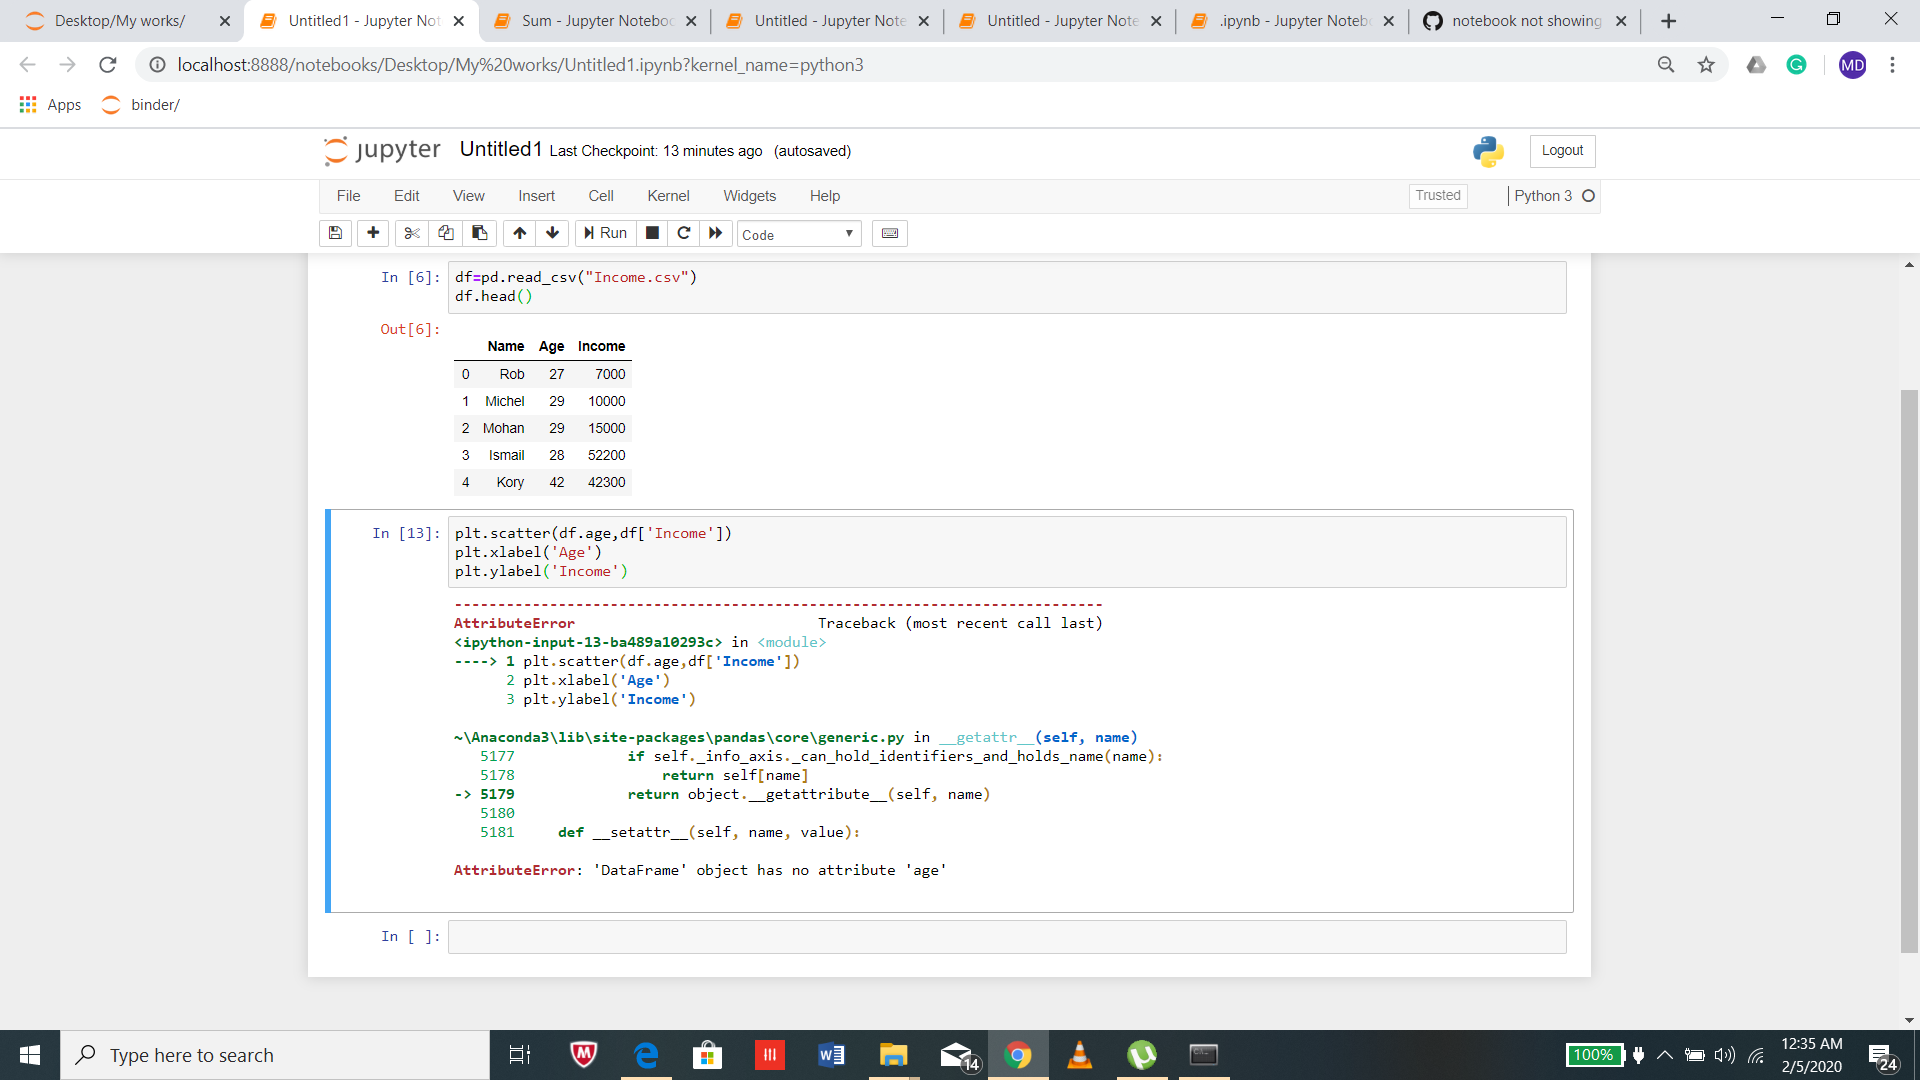
My plt.xlabels and plt.ylabels is not working .may i know ??why
 raihan010204
on 4 Feb 2020
raihan010204
on 4 Feb 2020
Try putting all plotting commands in one cell, with the last command in the cell being:
plt.show()
Sometimes this is not necessary --- the plot will show regardless, but it seems to fix the problem for me.
 fsc137
on 20 Feb 2020
fsc137
on 20 Feb 2020
I'm having the same issue... when I make a change of the parameters the plots wont change and when I rerun or reload... i lose all the plots on Jupyter!

 ihamieh
on 27 Mar 2020
ihamieh
on 27 Mar 2020
I'm having the same issue... when I make a change of the parameters the plots wont change and when I rerun or reload... i lose all the plots on Jupyter!
what version of python are you using?
formazione
on 28 Mar 2020
I'm having the same issue... when I make a change of the parameters the plots wont change and when I rerun or reload... i lose all the plots on Jupyter!
what version of python are you using?
I have Python 2 & 3 installed on my computer. It's showing Python 2 on the top right corner!
ihamieh
on 30 Mar 2020
this link is useful, It worked for me
https://github.com/matplotlib/ipympl
 Lotfey
on 30 Apr 2020
Lotfey
on 30 Apr 2020
I take it back. I just tried @lionlhy suggestion with the "%matplotlib inline" thing and it miraculously worked! Thanks! :P
Where you have used "%matplotlib inline"? Writing just above the command line of google colab where i run the file "!python run_file.py" is not worked for me. What may be the solution for google colab?
I'm having the same issue,how did you solve it,looking forward to your reply
 Klaviersonate
on 19 Aug 2020
Klaviersonate
on 19 Aug 2020
I got this issue in my environment. When I combine code in all cells into one. It works! But I believe that this issue is not yet solved.
 gengishkhan
on 19 Sep 2020
gengishkhan
on 19 Sep 2020
I have this issue. Using the semicolon after plot "fixes" it, but seems like a bug if that's the workaround. I'm running jupyterlab.
 lminer
on 30 Oct 2020
lminer
on 30 Oct 2020
Mr. Lotfey is right. The link helped ( https://github.com/matplotlib/ipympl )
An addon for Jupyther must be installed.
 nesergen
on 28 Dec 2020
nesergen
on 28 Dec 2020
Related issues
 qnicole-zakka
·
3Comments
qnicole-zakka
·
3Comments
 toasteez
·
3Comments
toasteez
·
3Comments
 uolter
·
3Comments
uolter
·
3Comments
 pylang
·
3Comments
pylang
·
3Comments
 ehossain1982
·
3Comments
ehossain1982
·
3Comments
Most helpful comment
Hi. I like to set it "all". Finally, I found that you can put a semicolon after "plt.show()"......... That's great.