Nomad: Allocation left in pending state after node lost
See comment trail starting with https://github.com/hashicorp/nomad/issues/3932#issuecomment-398786137
 preetapan
All 13 comments
is this a bug in 0.8.4 too? and if so, will it be fixed in 0.8.x hot-fix release?
 jippi
on 21 Jun 2018
jippi
on 21 Jun 2018
@jippi still trying to reproduce this, so not confirmed that its a bug yet.
preetapan
on 21 Jun 2018
@preetapan everything got garbage collected. I will have to update this ticket if it happens again.
 camerondavison
on 21 Jun 2018
camerondavison
on 21 Jun 2018
@preetapan I've been chasing issues like this as well for several months now. cc @jippi
On 11/18, about 30% of my cluster nodes of a certain type failed and had to be terminated.
Based on previous occurrences, I predicted that it would happen again sometime in the next 30 days. The cluster was left largely alone after 11/18 serving production traffic steady-state with few deployments and we did not touch any of the nodes.
Today, I had the same kind and magnitude of event (~30% of the cluster) affected within 5 minutes.
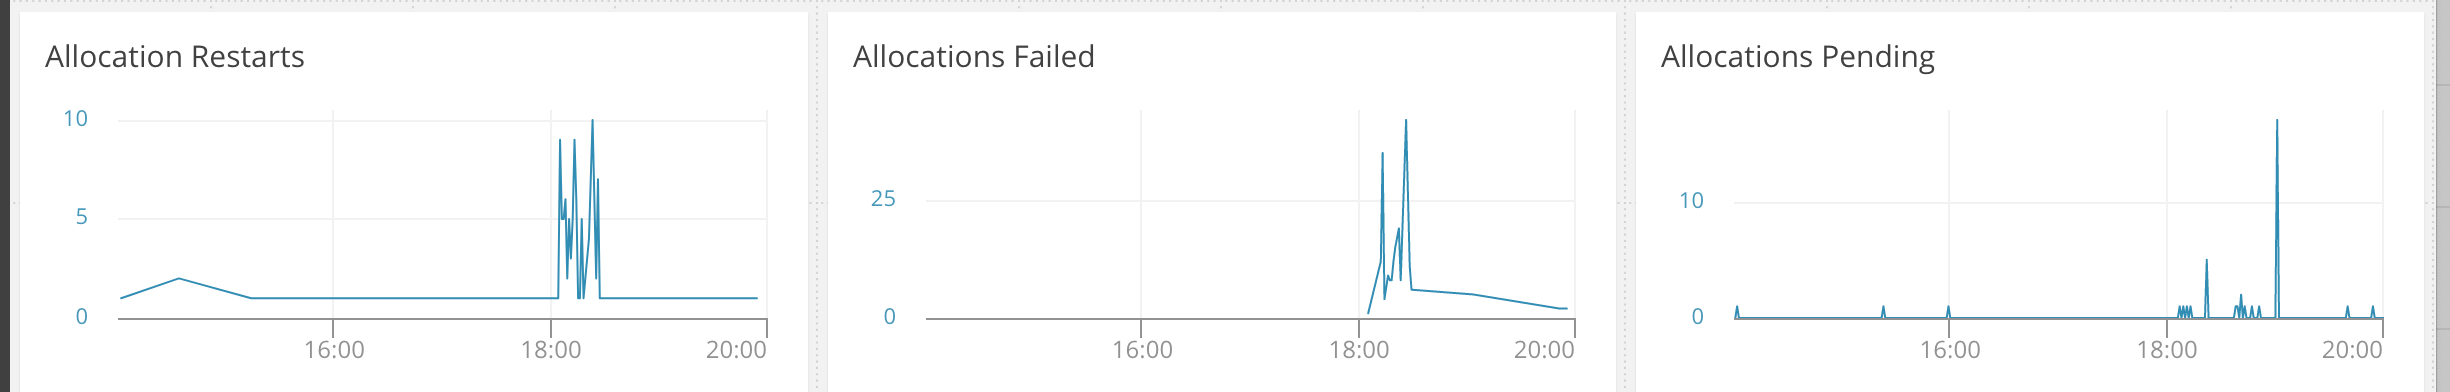
One thing that I've noticed is that the nodes appear to miss heartbeats and the cascade starts from there:
Node Events
Time                  Subsystem  Message
2018-12-10T17:57:00Z  Drain      Node drain complete
2018-12-10T17:51:59Z  Drain      Node drain strategy set
2018-12-06T19:22:05Z  Cluster    Node reregistered by heartbeat
2018-12-06T19:21:24Z  Cluster    Node heartbeat missed
2018-12-06T19:20:55Z  Cluster    Node reregistered by heartbeat
2018-12-06T19:16:18Z  Cluster    Node heartbeat missed
2018-12-06T09:20:30Z  Cluster    Node re-registered
2018-12-06T09:02:04Z  Cluster    Node heartbeat missed
2018-12-06T09:01:40Z  Cluster    Node reregistered by heartbeat
2018-12-06T09:01:25Z  Cluster    Node heartbeat missed
I have also noticed that only 1 class of nodes experience this issue. I have 3 classes. This one runs 80% of the workloads and includes service jobs and a bunch of periodic and batch. The other 2 classes run exclusively service or system jobs.
At one point, I had a theory that a particular resource-heavy java application was causing these issues. At the time, it had always run on the node class that was experiencing these issues. I moved it to its own node class many weeks ago and that new class has not experienced these issues.
I have seen little useful information in the system logs for the nodes that experience this behavior. At times, I have found the nomad process dead on the machines, but none today for instance. I have also noticed that the machines get flagged as failed in consul at times. A restart of one or both of those processes would allow the node to resume work in some but not all cases.
It would be extremely useful to be able to search for allocations and optionally filter by status on GET /v1/allocations. I can see telemetry that show quantities of lost or starting jobs and know to start looking for issues, but it is only by trial and error that I can figure out which allocations are affected.
Once I find a few allocations as pending, I've learned to start looking at the status of the node serving those allocations. What I find there is most or all of the jobs on the node are status pending or lost.
In a few cases, I see some allocations (4 in one instance) on the node that are still running and apparently healthy despite the 50+ other allocations marked as pending. In a recent case of this, I drained the node and the 4 allocations that were running also kept running and I presume that nomad was unable to shut them down.
 stevenscg
on 10 Dec 2018
stevenscg
on 10 Dec 2018
In case it helps, this is the timeline of today's event:
stevenscg
on 10 Dec 2018
Hey there
Since this issue hasn't had any activity in a while - we're going to automatically close it in 30 days. If you're still seeing this issue with the latest version of Nomad, please respond here and we'll keep this open and take another look at this.
Thanks!
![stale[bot] picture](https://avatars3.githubusercontent.com/in/1724?v=4&s=40) stale[bot]
on 10 May 2019
stale[bot]
on 10 May 2019
Bump
 mlehner616
on 10 May 2019
mlehner616
on 10 May 2019
I hope that 0.9.X fixes some of this for me. Waiting on 0.9.2 to come out.
stevenscg
on 10 May 2019
EDIT: Added more logs.
Just happened to me with 0.9.0.
$ nomad status my-job-job/dispatch-1559266524-1d126a53
ID            = my-job-job/dispatch-1559266524-1d126a53
Name          = my-job-job/dispatch-1559266524-1d126a53
Submit Date   = 2019-05-30T20:35:24-05:00
Type          = batch
Priority      = 50
Datacenters   = my-dc
Status        = pending
Periodic      = false
Parameterized = false

Summary
Task Group                       Queued  Starting  Running  Failed  Complete  Lost
my-job-group                     1       0         0        0       0         1

Placement Failure
Task Group "my-job-group":
* Resources exhausted on 64 nodes
* Class "worker" exhausted on 64 nodes
* Dimension "cpu" exhausted on 64 nodes

Allocations
ID        Node ID   Task Group                       Version  Desired  Status  Created    Modified
c38d46d4  42646d40  my-job-group                     0        stop     lost    1h54m ago  1h53m ago
$ nomad alloc-status c38d46d4
ID                  = c38d46d4
Eval ID             = 2af2a9e7
Name                = my-job-job/dispatch-1559266524-1d126a53.my-job-group[0]
Node ID             = 42646d40
Job ID              = my-job-job/dispatch-1559266524-1d126a53
Job Version         = 0
Client Status       = lost
Client Description  = <none>
Desired Status      = stop
Desired Description = alloc is lost since its node is down
Created             = 2h21m ago
Modified            = 2h20m ago

Couldn't retrieve stats: Unexpected response code: 404 (No path to node)

Task "my-job-task" is "running"
Task Resources
CPU        Memory   Disk     IOPS  Addresses
69400 MHz  195 GiB  512 MiB  0

Task Events:
Started At     = 2019-05-31T02:32:40Z
Finished At    = N/A
Total Restarts = 1
Last Restart   = 2019-05-31T02:32:22Z

Recent Events:
Time                       Type        Description
2019-05-30T21:32:40-05:00  Started     Task started by client
2019-05-30T21:32:22-05:00  Restarting  Task restarting in 16.617697365s
2019-05-30T21:32:22-05:00  Terminated  Exit Code: 1, Exit Message: "Docker container exited with non-zero exit code: 1"
2019-05-30T21:32:16-05:00  Started     Task started by client
2019-05-30T21:32:13-05:00  Task Setup  Building Task Directory
2019-05-30T21:32:13-05:00  Received    Task received by client
$ nomad node-status 42646d40
error fetching node stats: Unexpected response code: 404 (No path to node)

ID            = 42646d40
Name          = gcp-n1-highmem-32-d074f4a9d68a48d3bdd90bc932db9731-001
Class         = worker
DC            = my-dc
Drain         = false
Eligibility   = eligible
Status        = down
Driver Status = docker,exec,raw_exec,rkt

Node Events
Time                  Subsystem  Message
2019-05-31T02:33:18Z  Cluster    Node heartbeat missed
2019-05-31T00:37:32Z  Cluster    Node registered
error fetching node stats: actual resource usage not present

Allocated Resources
CPU          Memory       Disk         IOPS
0/70400 MHz  0 B/204 GiB  0 B/461 GiB  0/0

Allocation Resource Utilization
CPU          Memory
0/70400 MHz  0 B/204 GiB


Allocations
ID        Node ID   Task Group             Version  Desired  Status    Created    Modified
c38d46d4  42646d40  my-job-group           0        stop     lost      2h25m ago  2h24m ago
33ed0b8d  42646d40  my-job-group           0        run      complete  2h34m ago  2h25m ago
bdcb08b8  42646d40  my-job-group           0        run      complete  3h1m ago   2h34m ago
87b838ec  42646d40  my-job-group           0        run      complete  3h22m ago  3h1m ago
76f626ba  42646d40  my-job-group           0        run      complete  4h20m ago  4h8m ago
 jimmywan
on 31 May 2019
jimmywan
on 31 May 2019
Just happened again after a node was terminated due to EC2 maintenance. nomad system gc didn't fix it.
Only way to resolve it was to manually deregister every single service. :(
jimmywan
on 10 Sep 2019
I have the same issue (0.10.0)
 elifish4
on 3 Oct 2019
elifish4
on 3 Oct 2019
I have around 550 dead nodes and the whole cluster is not responsive anymore. Nothing gets scheduled and there's thousands of pending allocations.
I'm not sure what the reason is but please give us options to clean up the state. Probably nomad doesn't know what to do with all the dead nodes. I've invoked system gc through API but nothing happened.
EDIT: after some time the dead nodes disappeard and immediately the scheduling resumed.
 Fuco1
on 10 Nov 2019
Fuco1
on 10 Nov 2019
same issue (0.9.5)
EDIT:
running nomad alloc restart [alloc-id] failed with error:
"Failed to restart allocation: Unexpected response code: 404 (No path to node)"
running nomad alloc stop [alloc-id] on the offending allocation succeeded.
a new allocation was scheduled in its stead.
 yanilov
on 14 Jun 2020
yanilov
on 14 Jun 2020
Related issues
 joliver
·
3Comments
joliver
·
3Comments
 ashald
·
3Comments
ashald
·
3Comments
 mlafeldt
·
3Comments
mlafeldt
·
3Comments
 Smuerdt
·
3Comments
Smuerdt
·
3Comments
 hamann
·
3Comments
hamann
·
3Comments
Most helpful comment
Bump