Nomad: High docker cpu usage with Nomad on an idle node
TL/DR Streaming stats from docker containers to nomad-executor seems to cause high system cpu usage by docker, probably due to lock contention. The more docker containers on the node are running, the more noticable this effect is.
Nomad v0.7.0
We are investigating an issue where Nomad is causing strange cpu load.
We observe it both on our production (amazon ec2 ubuntu 14.04) nodes and our development node with different Nomad and docker versions.
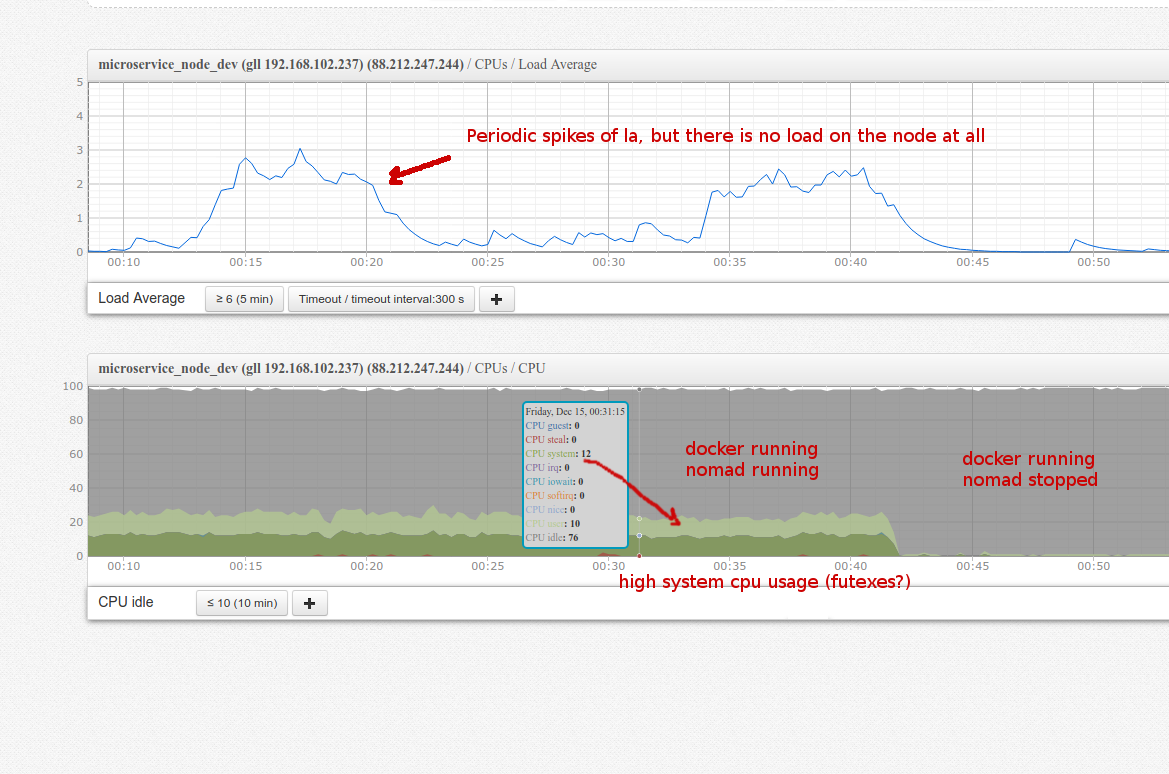
We see significant system/user cpu usage and strange periodic load average spikes even on development node which has no load at all.
In the graph below you can see cpu usage of an idle node running Nomad with ~40 idle docker containers with no load.
~12% of user cpu and 12% of system cpu is used.
top shows that these 12% cpu are used by docker-containerd, so it is natural to blame docker.
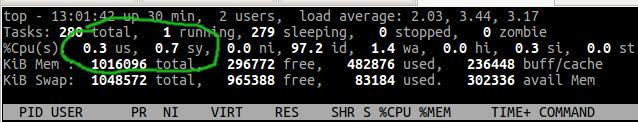
But when we stop Nomad while keeping containers running, the abnormal load disappears.
Also, there is a significant amount of system cpu usage and high la spikes. So i presume this has something to do with linux futexes, as there is no io/networking load at all.
Can this be a bug in a way Nomad interacts with docker containers?
Can we somehow disable this interaction to debug the problem?
During la spikes straceing nomad-executors shows a lot of futex calls:
.... same calls
futex(0x206da10, FUTEX_WAIT, 0, NULL)   = 0
futex(0x206da10, FUTEX_WAIT, 0, NULL)   = 0
futex(0x206da10, FUTEX_WAIT, 0, NULL)   = 0
futex(0x206da10, FUTEX_WAIT, 0, NULL)   = 0
pselect6(0, NULL, NULL, NULL, {0, 3000}, NULL) = 0 (Timeout)
futex(0x206da10, FUTEX_WAIT, 0, NULL)   = 0
futex(0x206da10, FUTEX_WAIT, 0, NULL)   = 0
futex(0x206da10, FUTEX_WAIT, 0, NULL)   = 0
futex(0x206da10, FUTEX_WAIT, 0, NULL)   = 0
futex(0x206da10, FUTEX_WAIT, 0, NULL)   = 0
futex(0x206da10, FUTEX_WAIT, 0, NULL)   = 0
futex(0x206da10, FUTEX_WAIT, 0, NULL)   = -1 EAGAIN (Resource temporarily unavailable)
futex(0x206da10, FUTEX_WAIT, 0, NULL)   = 0
futex(0x206da10, FUTEX_WAIT, 0, NULL)   = 0
futex(0x206da10, FUTEX_WAIT, 0, NULL)   = -1 EAGAIN (Resource temporarily unavailable)
futex(0x206da10, FUTEX_WAIT, 0, NULL)   = 0
futex(0x206da10, FUTEX_WAIT, 0, NULL)   = -1 EAGAIN (Resource temporarily unavailable)
futex(0x206da10, FUTEX_WAIT, 0, NULL)   = 0
futex(0x206da10, FUTEX_WAIT, 0, NULL)   = -1 EAGAIN (Resource temporarily unavailable)
futex(0x206da10, FUTEX_WAIT, 0, NULL)   = 0
futex(0x206da10, FUTEX_WAIT, 0, NULL)   = -1 EAGAIN (Resource temporarily unavailable)
... same calls
 drscre
All 21 comments
@drscre After starting a container, the only thing Nomad will do is collect stats. I would try increasing this: https://www.nomadproject.io/docs/agent/configuration/telemetry.html#collection_interval
Would love to hear back the results.
 dadgar
on 15 Dec 2017
dadgar
on 15 Dec 2017
Increasing collection interval to 1 hour was the first thing i tried. But it did not help.
telemetry {
    collection_interval = "1h"
}
What does nomad-executor process do? Why does it need all those futex calls?
drscre
on 15 Dec 2017
@drscre When you said you killed Nomad did you kill the executors too?
dadgar
on 15 Dec 2017
Yes i stopped it which just left docker containers running.
Also if i launch docker containers manually (not via Nomad) while Nomad is running, the cpu usage is not affected.
That's why i assume it has something to do with nomad-executor <-> docker interaction
drscre
on 15 Dec 2017
@drscre Are the docker containers logging heavily?
Can you provide a reproduction job?
dadgar
on 15 Dec 2017
No, the system is completely idle, doing nothing. No requests, no load.
drscre
on 15 Dec 2017
@dadgar
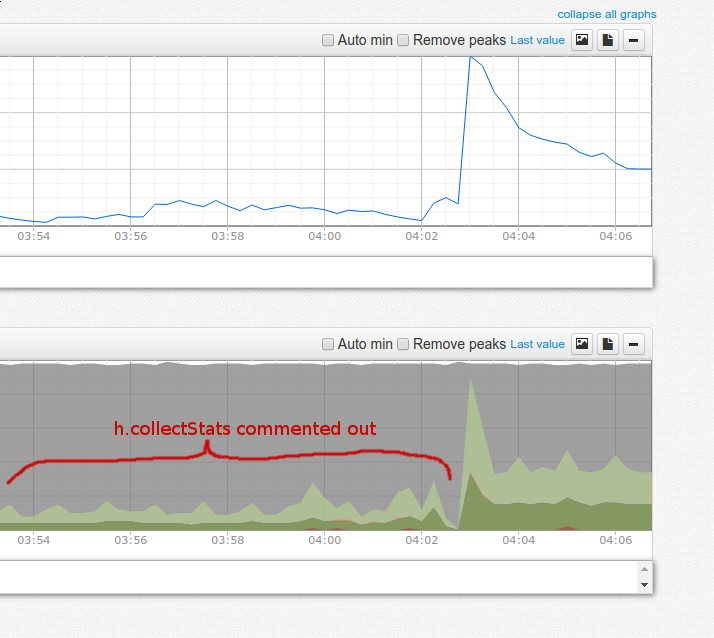
I tried to recompile Nomad without stats collection
I commented out these lines:
https://github.com/hashicorp/nomad/blob/v0.7.1/client/driver/docker.go#L818
https://github.com/hashicorp/nomad/blob/v0.7.1/client/driver/docker.go#L1596
And it looks like it helped , though not entirely:
drscre
on 15 Dec 2017
Also, I don't see StatsCollectionInterval config option being used in DockerHandle::collectStats() function.
It looks more like it opens a long-living connection to docker who constantly streams back resource usage.
drscre
on 15 Dec 2017
@dadgar You can easily reproduce this issue using getting started guide: https://www.nomadproject.io/intro/getting-started/jobs.html
Just launch example redis job with count = 40 (adjusting job requirements so 40 copies fit virtual machine) and observe cpu usage with top:
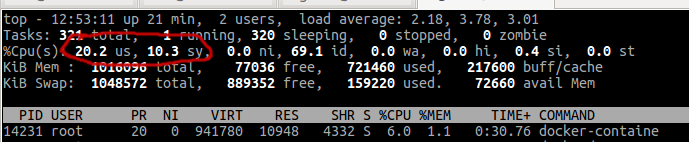
Then kill nomad and executors kill -SIGKILL $(pidof nomad) leaving docker containers running and observe cpu usage again:
Job i used:
example.job.txt
drscre
on 17 Dec 2017
Also, I don't see StatsCollectionInterval config option being used in DockerHandle::collectStats() function.
It looks more like it opens a long-living connection to docker who constantly streams back resource usage.
https://github.com/hashicorp/nomad/blob/v0.7.1/client/client.go#L1940 (0.7.1)
Timer is first set at 0 / now. Then on each iteration, it is set for c.config.StatsCollectionInterval. So it is actually used, albeit for host stats, not container stats (?).
 hsmade
on 13 Mar 2018
hsmade
on 13 Mar 2018
@hsmade Yes, this is not container stats collection.
So far it looks like this is not a Nomad but rather a Docker bug. It occurs when you stream stats from many containers at the same times.
It is strange that nobody at Hashicorp has observed this extra cpu consumption so far, because it noticeable even when with a small amount of containers.
As a workaround, it would be great to have an option to collect container stats periodically instead of keeping long-living streaming connections to docker.
drscre
on 13 Mar 2018
Can you reproduce this with docker stats? Because that does the same thing, it listens for stats on the docker api.
hsmade
on 13 Mar 2018
Also, do you have a vagrant file or details on the VM? And what docker version did you have installed? I'm trying to reproduce your example (as we might see the same in our prod env). I have a debian/stretch with 2G/2 cores, running on a macbook pro, and I don't get the cpu load you get:
top - 14:07:58 up 4 min,  1 user,  load average: 3.19, 1.58, 0.65
Tasks: 319 total,   1 running, 318 sleeping,   0 stopped,   0 zombie
%Cpu(s):  3.2 us,  4.4 sy,  0.0 ni, 92.1 id,  0.0 wa,  0.0 hi,  0.3 si,  0.0 st
@hsmade
Yes, it is reproducible with pure docker stats. Just checked it on my Macbook Pro running Ubuntu.
Launch 100 containers with redis:
#!/bin/bash
for i in `seq 1 100`; do
   docker run -d redis
done
So far there will be no cpu usage, because redis is idle and doing nothing:
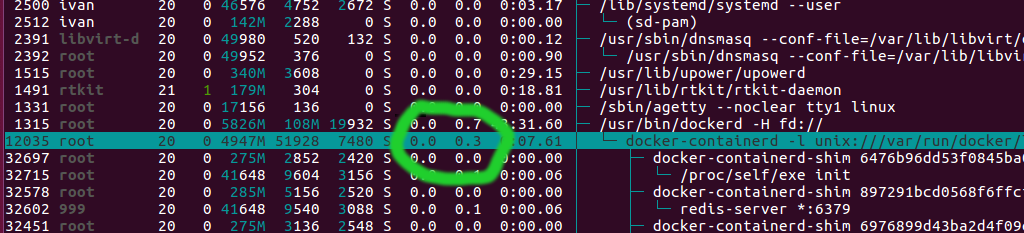
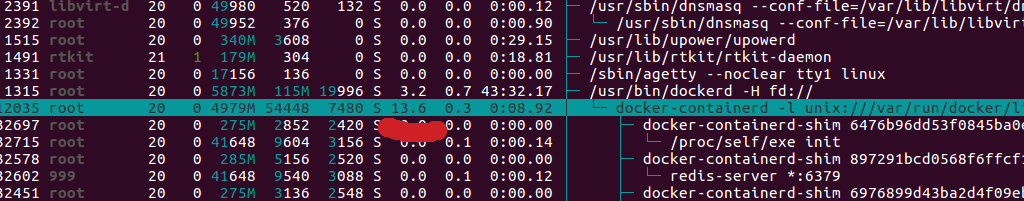
Then launch docker stats for every container:
#!/bin/bash
for id in `docker ps --format "{{.ID}}"`; do
    docker stats $id >/dev/null &
done
Now there will noticable cpu usage by docker-containerd:
I will try to come up with a Vagrantfile. Maybe this has something to do with operating system. All of our production nodes run Ubuntu.
drscre
on 13 Mar 2018
Maybe the problem here is that docker is working too hard to get the stats, and doesn't allow to set the interval on the API. If it would, nomad could implement that and not spend so much time on gathering the stats as well.
hsmade
on 13 Mar 2018
From what i see, docker stats API does not provide any collection interval customization.
It seems that a possible alternative for Nomad could be to query docker for stats periodically in non-streaming mode.
I.e. send GET /v1.21/containers/redis1/stats?stream=0 instead of keeping streaming connection.
drscre
on 13 Mar 2018
FWIW, here's a stack dump of the nomad-executor showing the aforementioned behavior (lots and lots of futex syscalls): https://pastebin.com/QKgW0W9Q
One thing that stood out to me is the fact that the executor runs the Syslog server. So just for the sake of it I then tried switching a single job to use fluentd as a logging driver. So far the executor running that job behaves normally while others (running the default syslog) are performing huge amounts of syscalls.
 ygersie
on 16 Mar 2018
ygersie
on 16 Mar 2018
We're seeing this on nomad v0.8.1currently.
Its gotten to the point where we have needed to arbitrarily increase the resource profile of jobs so that we don't get more than ~10 jobs running (mostly idle java and node API's in containers) per host (average host size is 4xvCPU's@2GHz + 16G RAM) otherwise we see unpredictable and very significant spikea in CPU usage to the extent that containers start to die and restart, triggering something of a death spiral in the cluster.
From what I can find the underlying cause ie almost definitely a containerd problem, but it feels like nomad should be able to mitigate this given the sinificant perfornance overhead it introduces.
FWIW i tried the "change the logging driver to fluentd" thing mentioned by @dropje86 but this didn't significantly improve the CPU situation.
 hvindin
on 7 May 2018
hvindin
on 7 May 2018
@hvindin Are you sure it's not the jobs themselves who are eating CPU? Do you monitor the CPU usage of the jobs?
The case you are describing seems a bit different from what we experience. In our case there are spikes of load average and some extra constant system cpu usage, but nothing that critical.
The reason for this extra system CPU usage is that Nomad is using containerd streaming API to collect resource usage from docker containers. And this containerd resource streaming API method seems to be poorly implemented and eats extra CPU. The more containers are running, the more noticable the extra system CPU usage is.
But in your case with only 10 containers per node running this should hardly be an issue.
drscre
on 7 May 2018
@drscre We're definitely sure that it's not the containers burning CPU, we tried hard limiting down the CPU use of the containers and still got the same results.
The fact that it's exponentially worse, the more containers you put on the box does point to it being a host problem, rather than a container problem.
We reached out to both nomad enterprise support and docker enter enterprise support and hashicorp couldn't really be of much help, because it's largely out of their hands.
Docker, however, pointed us straight at the docker-telemetry plugin and told us to shut it down and uninstall it if we didn't need it (which we don't). After doing that we've seen this problem almost entirely disappear (when I say almost I mean that there are other problems that look similar but I think this root cause is fixed).
We where also seeing a lot of side effects where containers where showing up as "Dead" on our hosts and we couldn't seem to do anything to remove them manually except bounce the server. We found that the solution to that was the stop ntpd on the host, which them released something it was holding to the docker telemetry plugin in each container and that allowed us to clean up all the dead containers.
So to fix this, with the current ee version of docker there's basically two things:
- If you notice massive CPU usage - execute the following
sudo systemctl stop docker-telemetry.service
sudo docker plugin disable docker/telemetry:1.0.0.linux-x86_64-stable
sudo docker plugin rm docker/telemetry:1.0.0.linux-x86_64-stable
- If you have containers hanging around that won't seem to disappear (ie. they appear as dead but you can't delete them) then:
sudo systemctl stop ntpd
sudo docker rm -f <CONTAINER ID>
sudo systemctl start ntpd
Seemed to fix a lot of our issues.
hvindin
on 20 May 2018
This issue will be auto-closed because there hasn't been any activity for a few months. Feel free to open a new one if you still experience this problem :+1:
![stale[bot] picture](https://avatars3.githubusercontent.com/in/1724?v=4&s=40) stale[bot]
on 10 May 2019
stale[bot]
on 10 May 2019
Related issues
 leowmjw
·
3Comments
leowmjw
·
3Comments
 mancusogmu
·
3Comments
mancusogmu
·
3Comments
 dvusboy
·
3Comments
dvusboy
·
3Comments
 hamann
·
3Comments
hamann
·
3Comments
 Smuerdt
·
3Comments
Smuerdt
·
3Comments