Nodejs-storage: createReadStream doesn't release enough memory since version 2.2.0
Environment details
- OS: Google AppEngine (production) / macOS 10.13.6 (development)
- Node.js version: 10.15.3
- npm version: 6.9.0
@google-cloud/storageversion: 2.2.0 and up
Hi guys, I'm running into this issue when using the file.createReadStream method. It seems this problem was introduced in version 2.2.0 and is present in all version since then (including version 2.5.0). I'm using version 2.1.0 to avoid running into this issue.
My specific use case:
- I'm streaming files that are between 100MB and 200MB in size.
- I'm using the node-throttle module.
- I'm piping the stream into the HTTP response of Express.js
bucket
    .file(filename)
    .createReadStream({ start, end })
    .on("error", err => {
        if (err.code === "ESOCKETTIMEDOUT") {
            logger.warn("Error reading file stream", err);
        } else {
            logger.error("Error reading file stream", err);
        }
    })
    .pipe(throttle)
    .pipe(res);
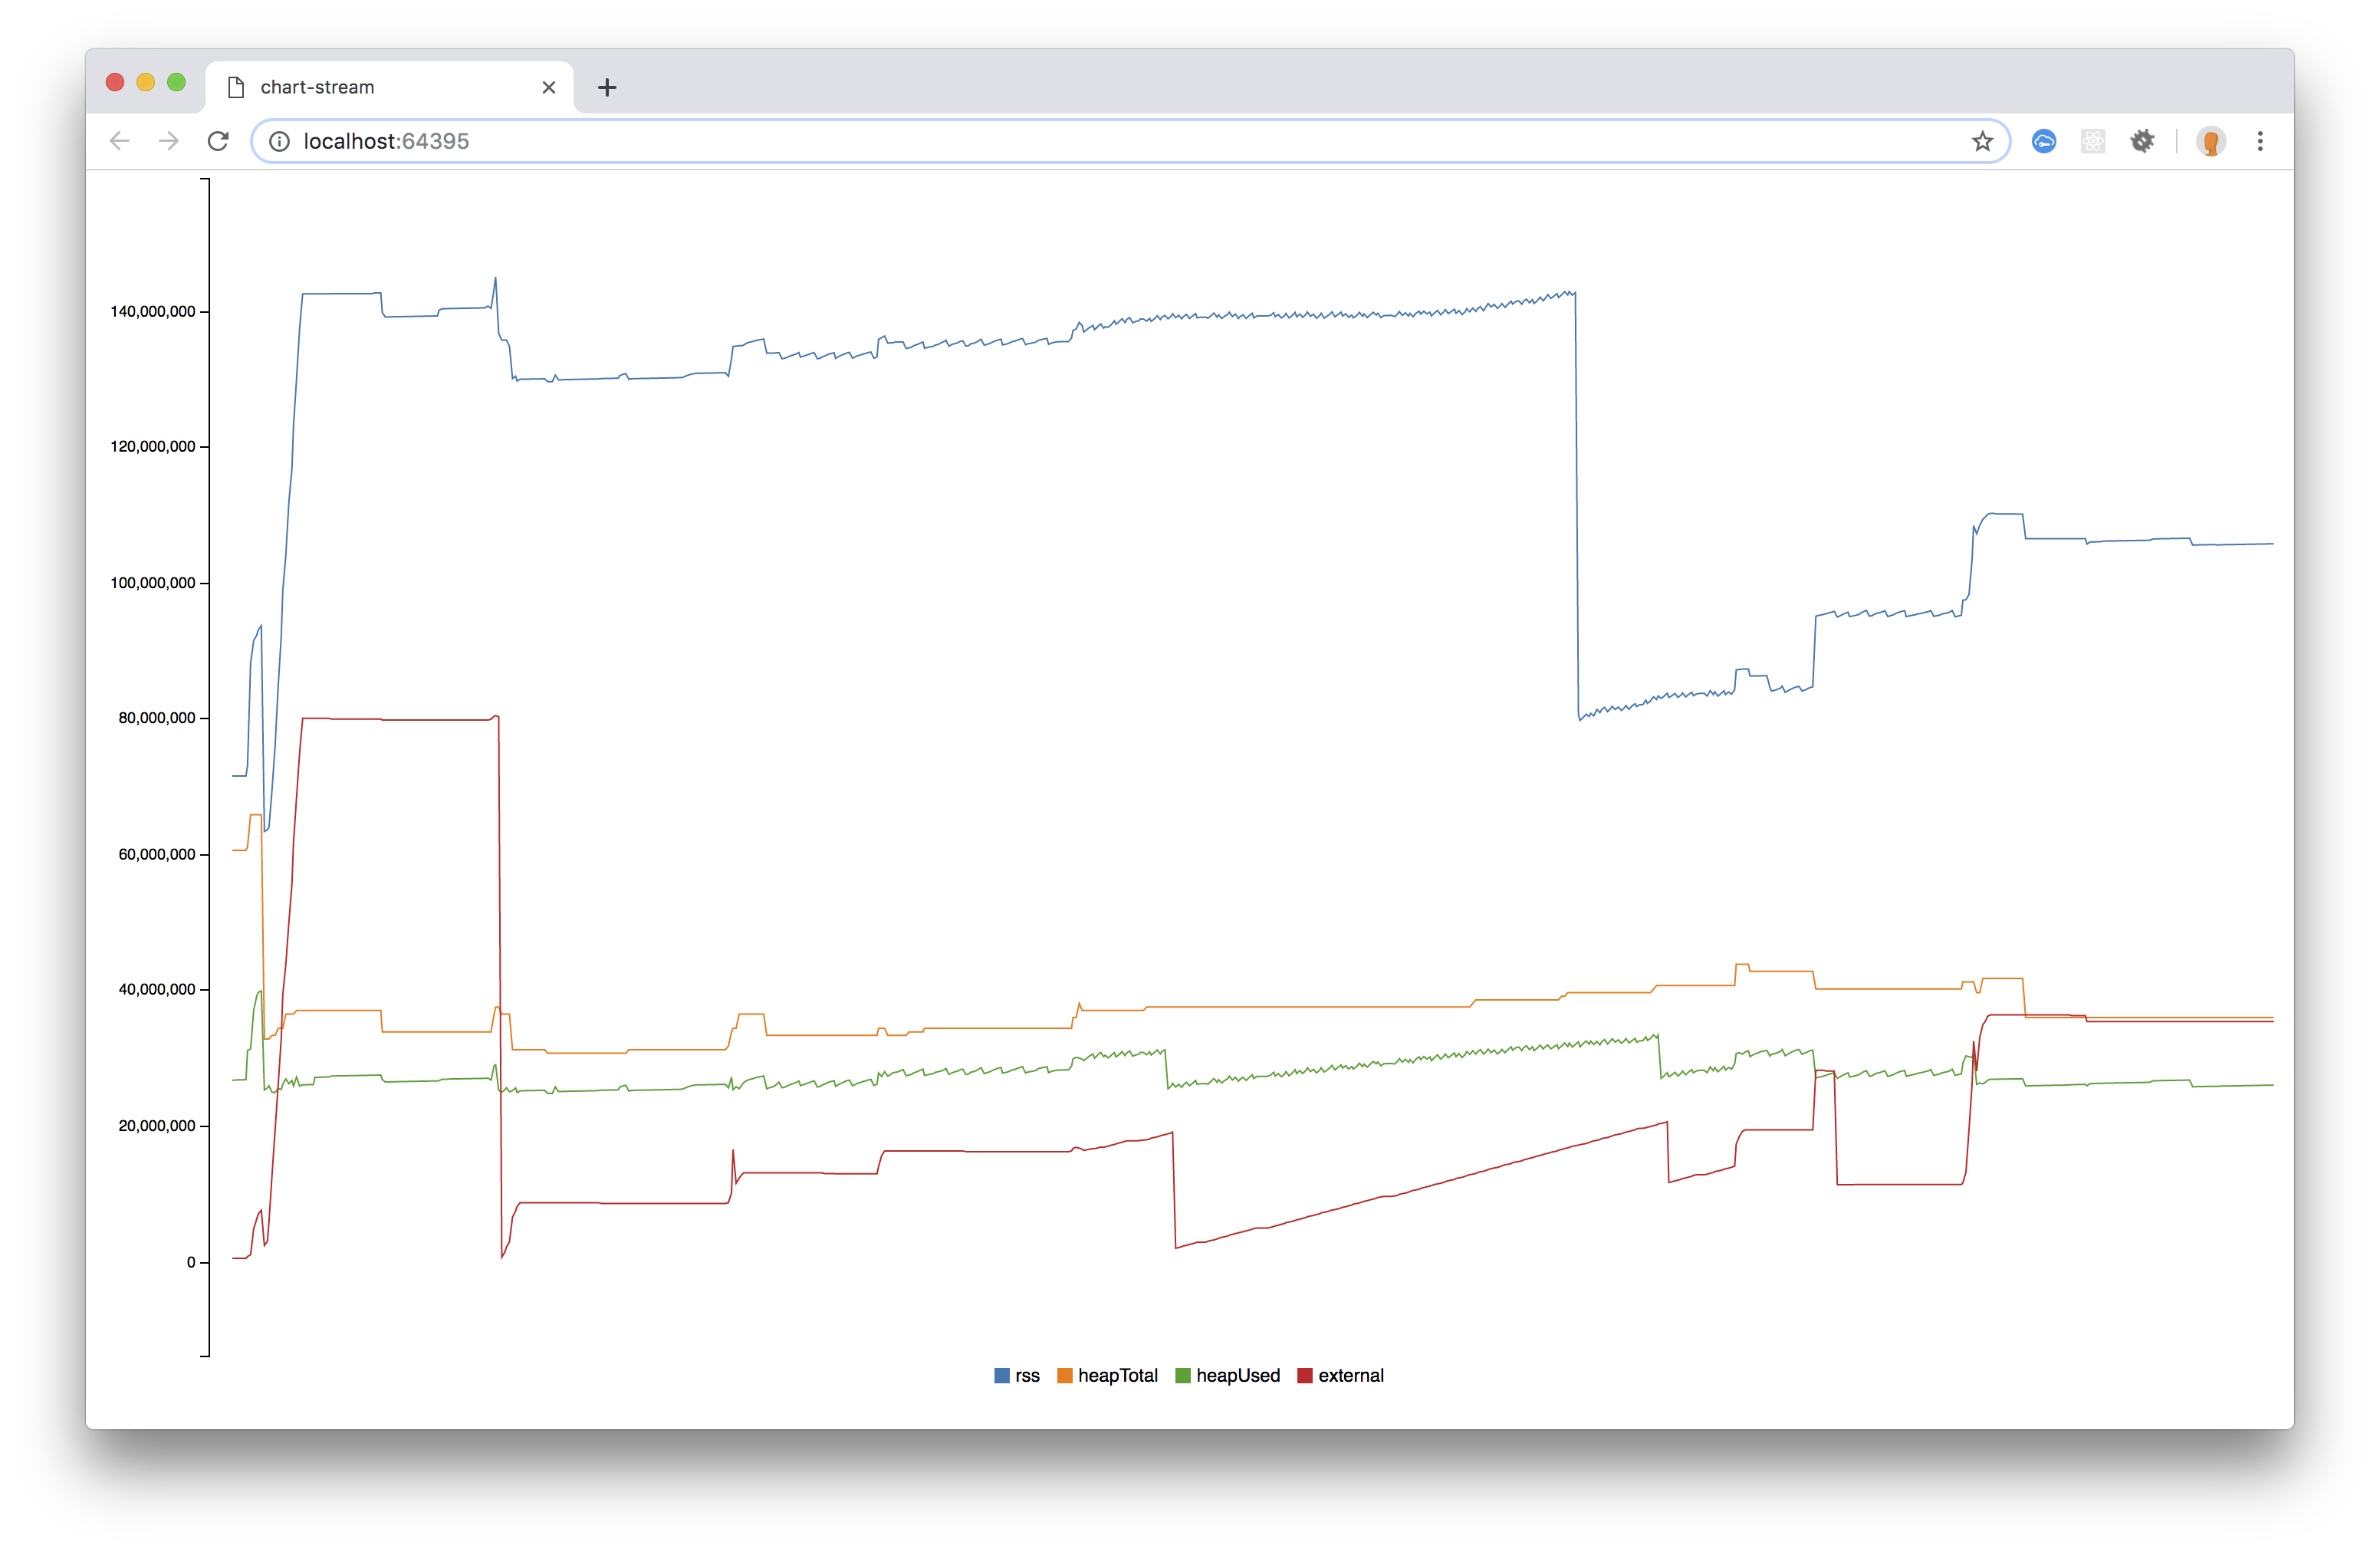
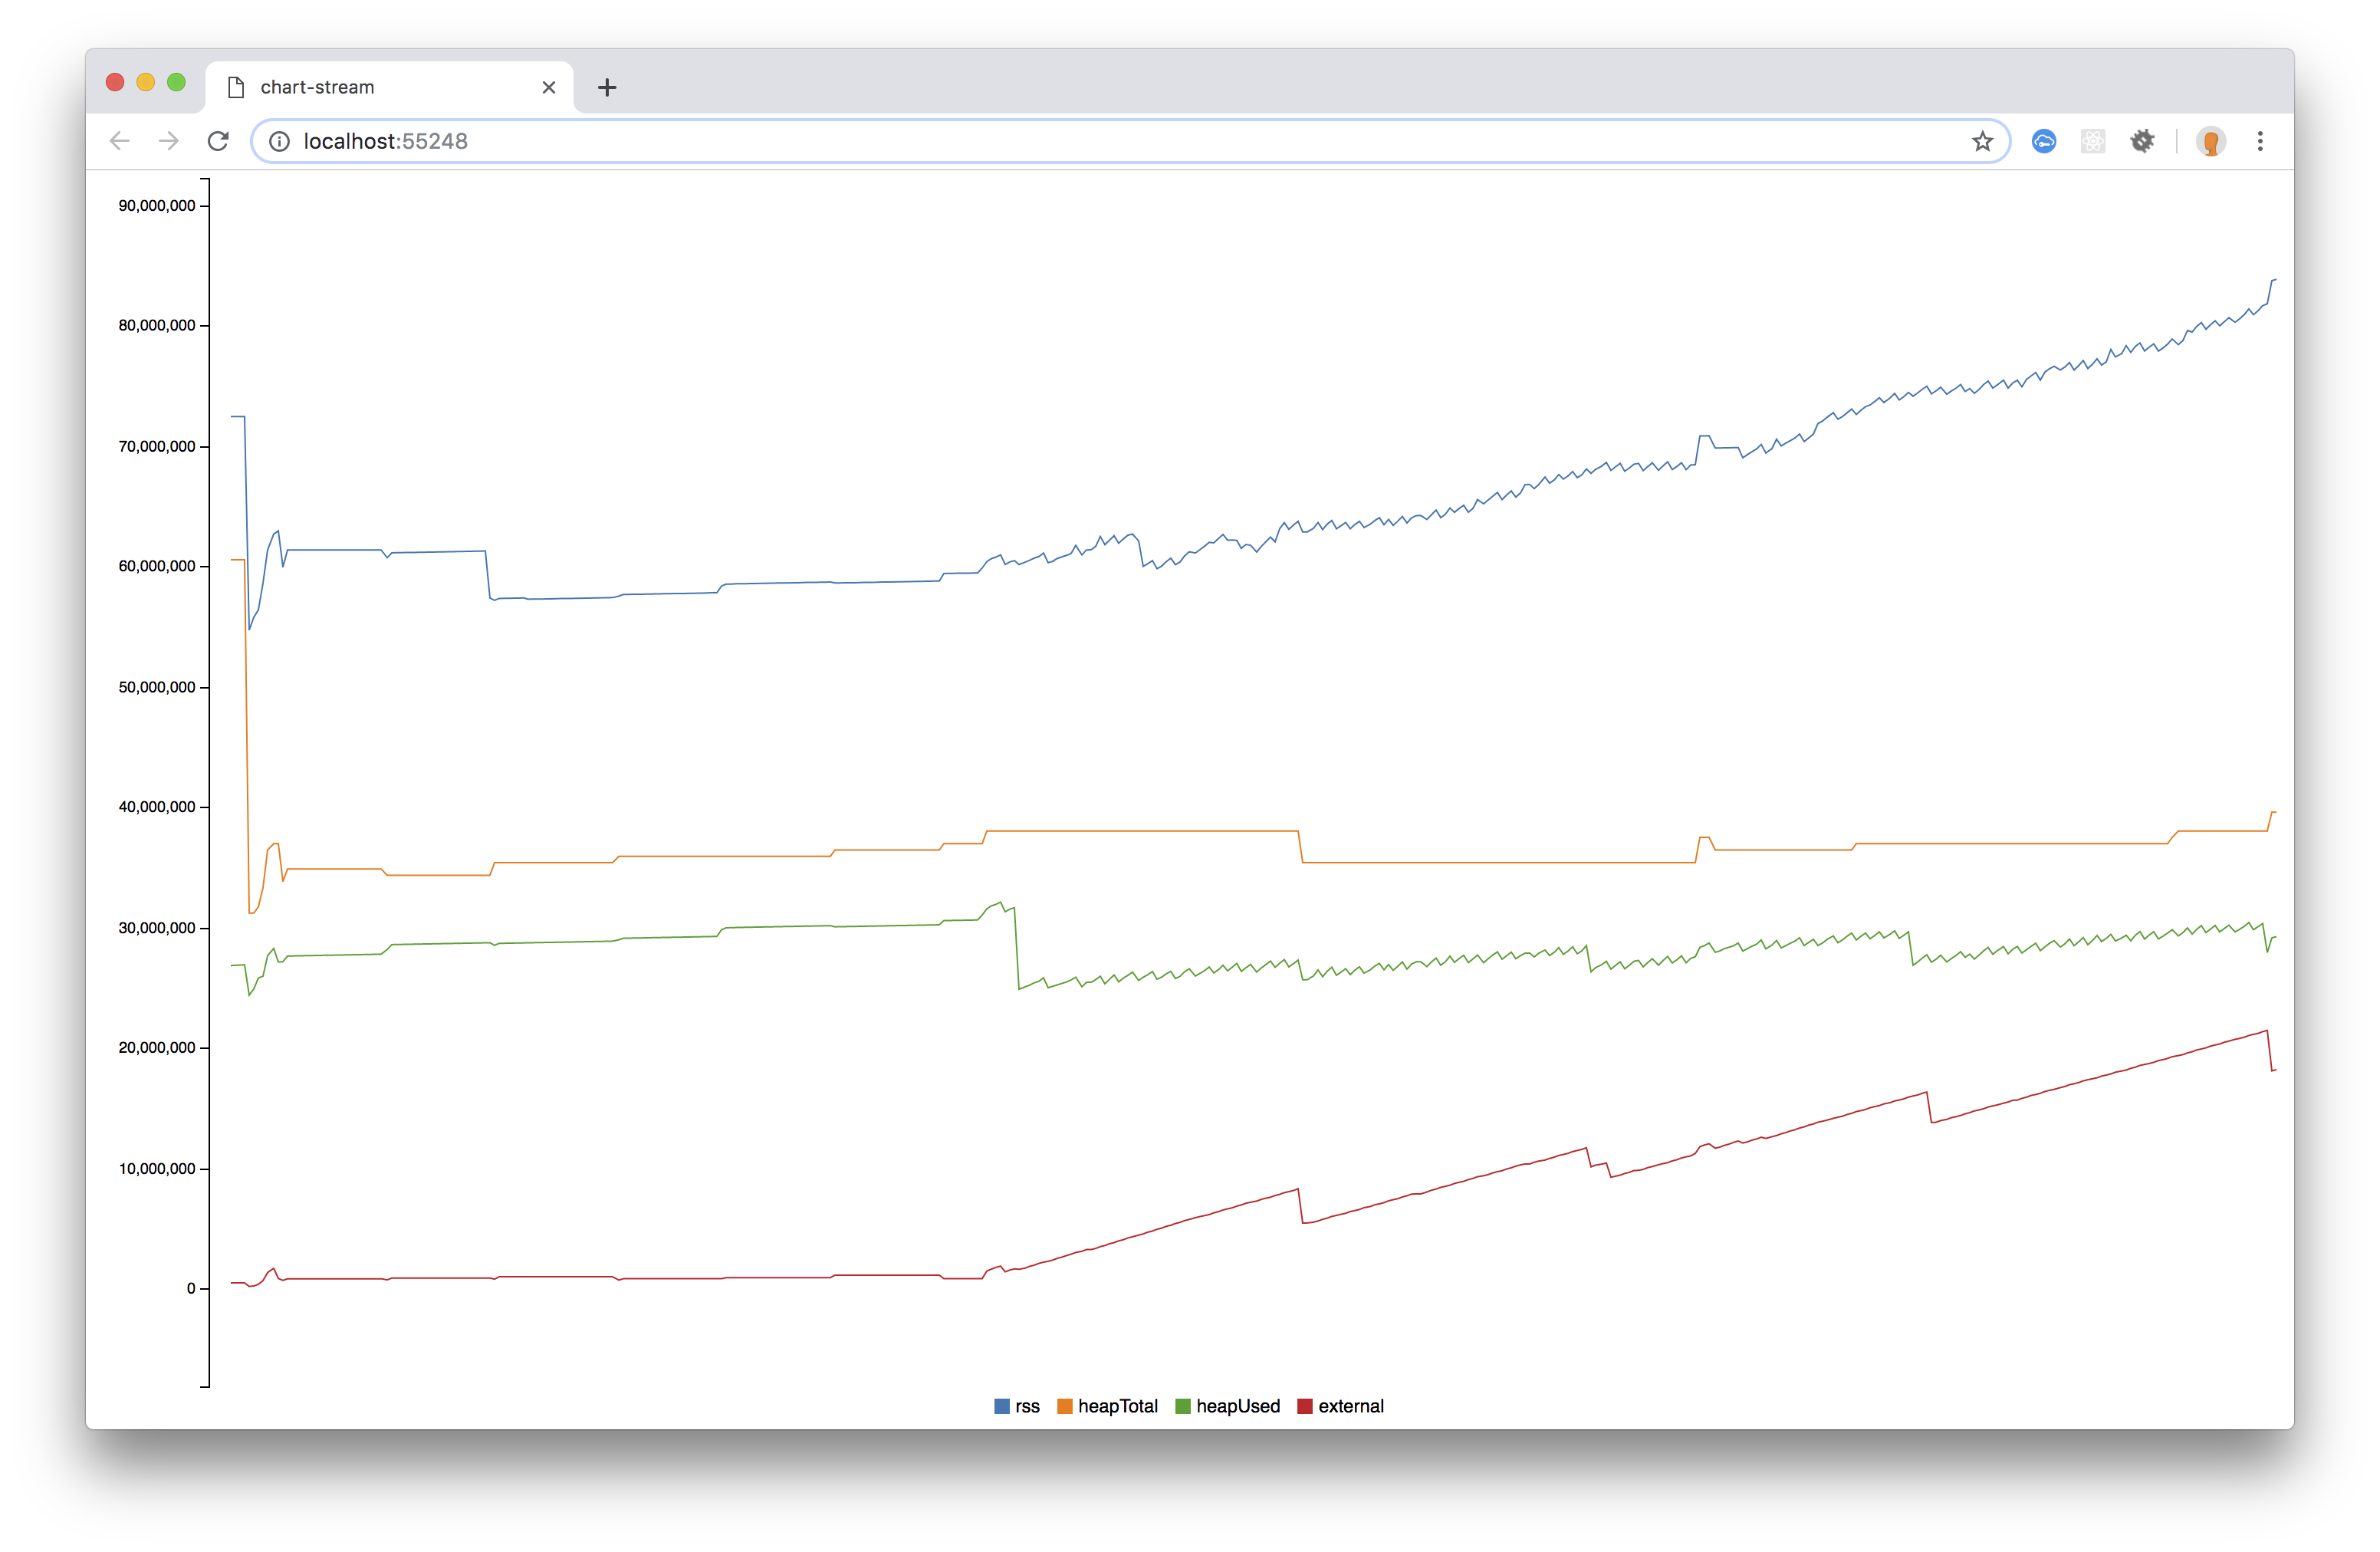
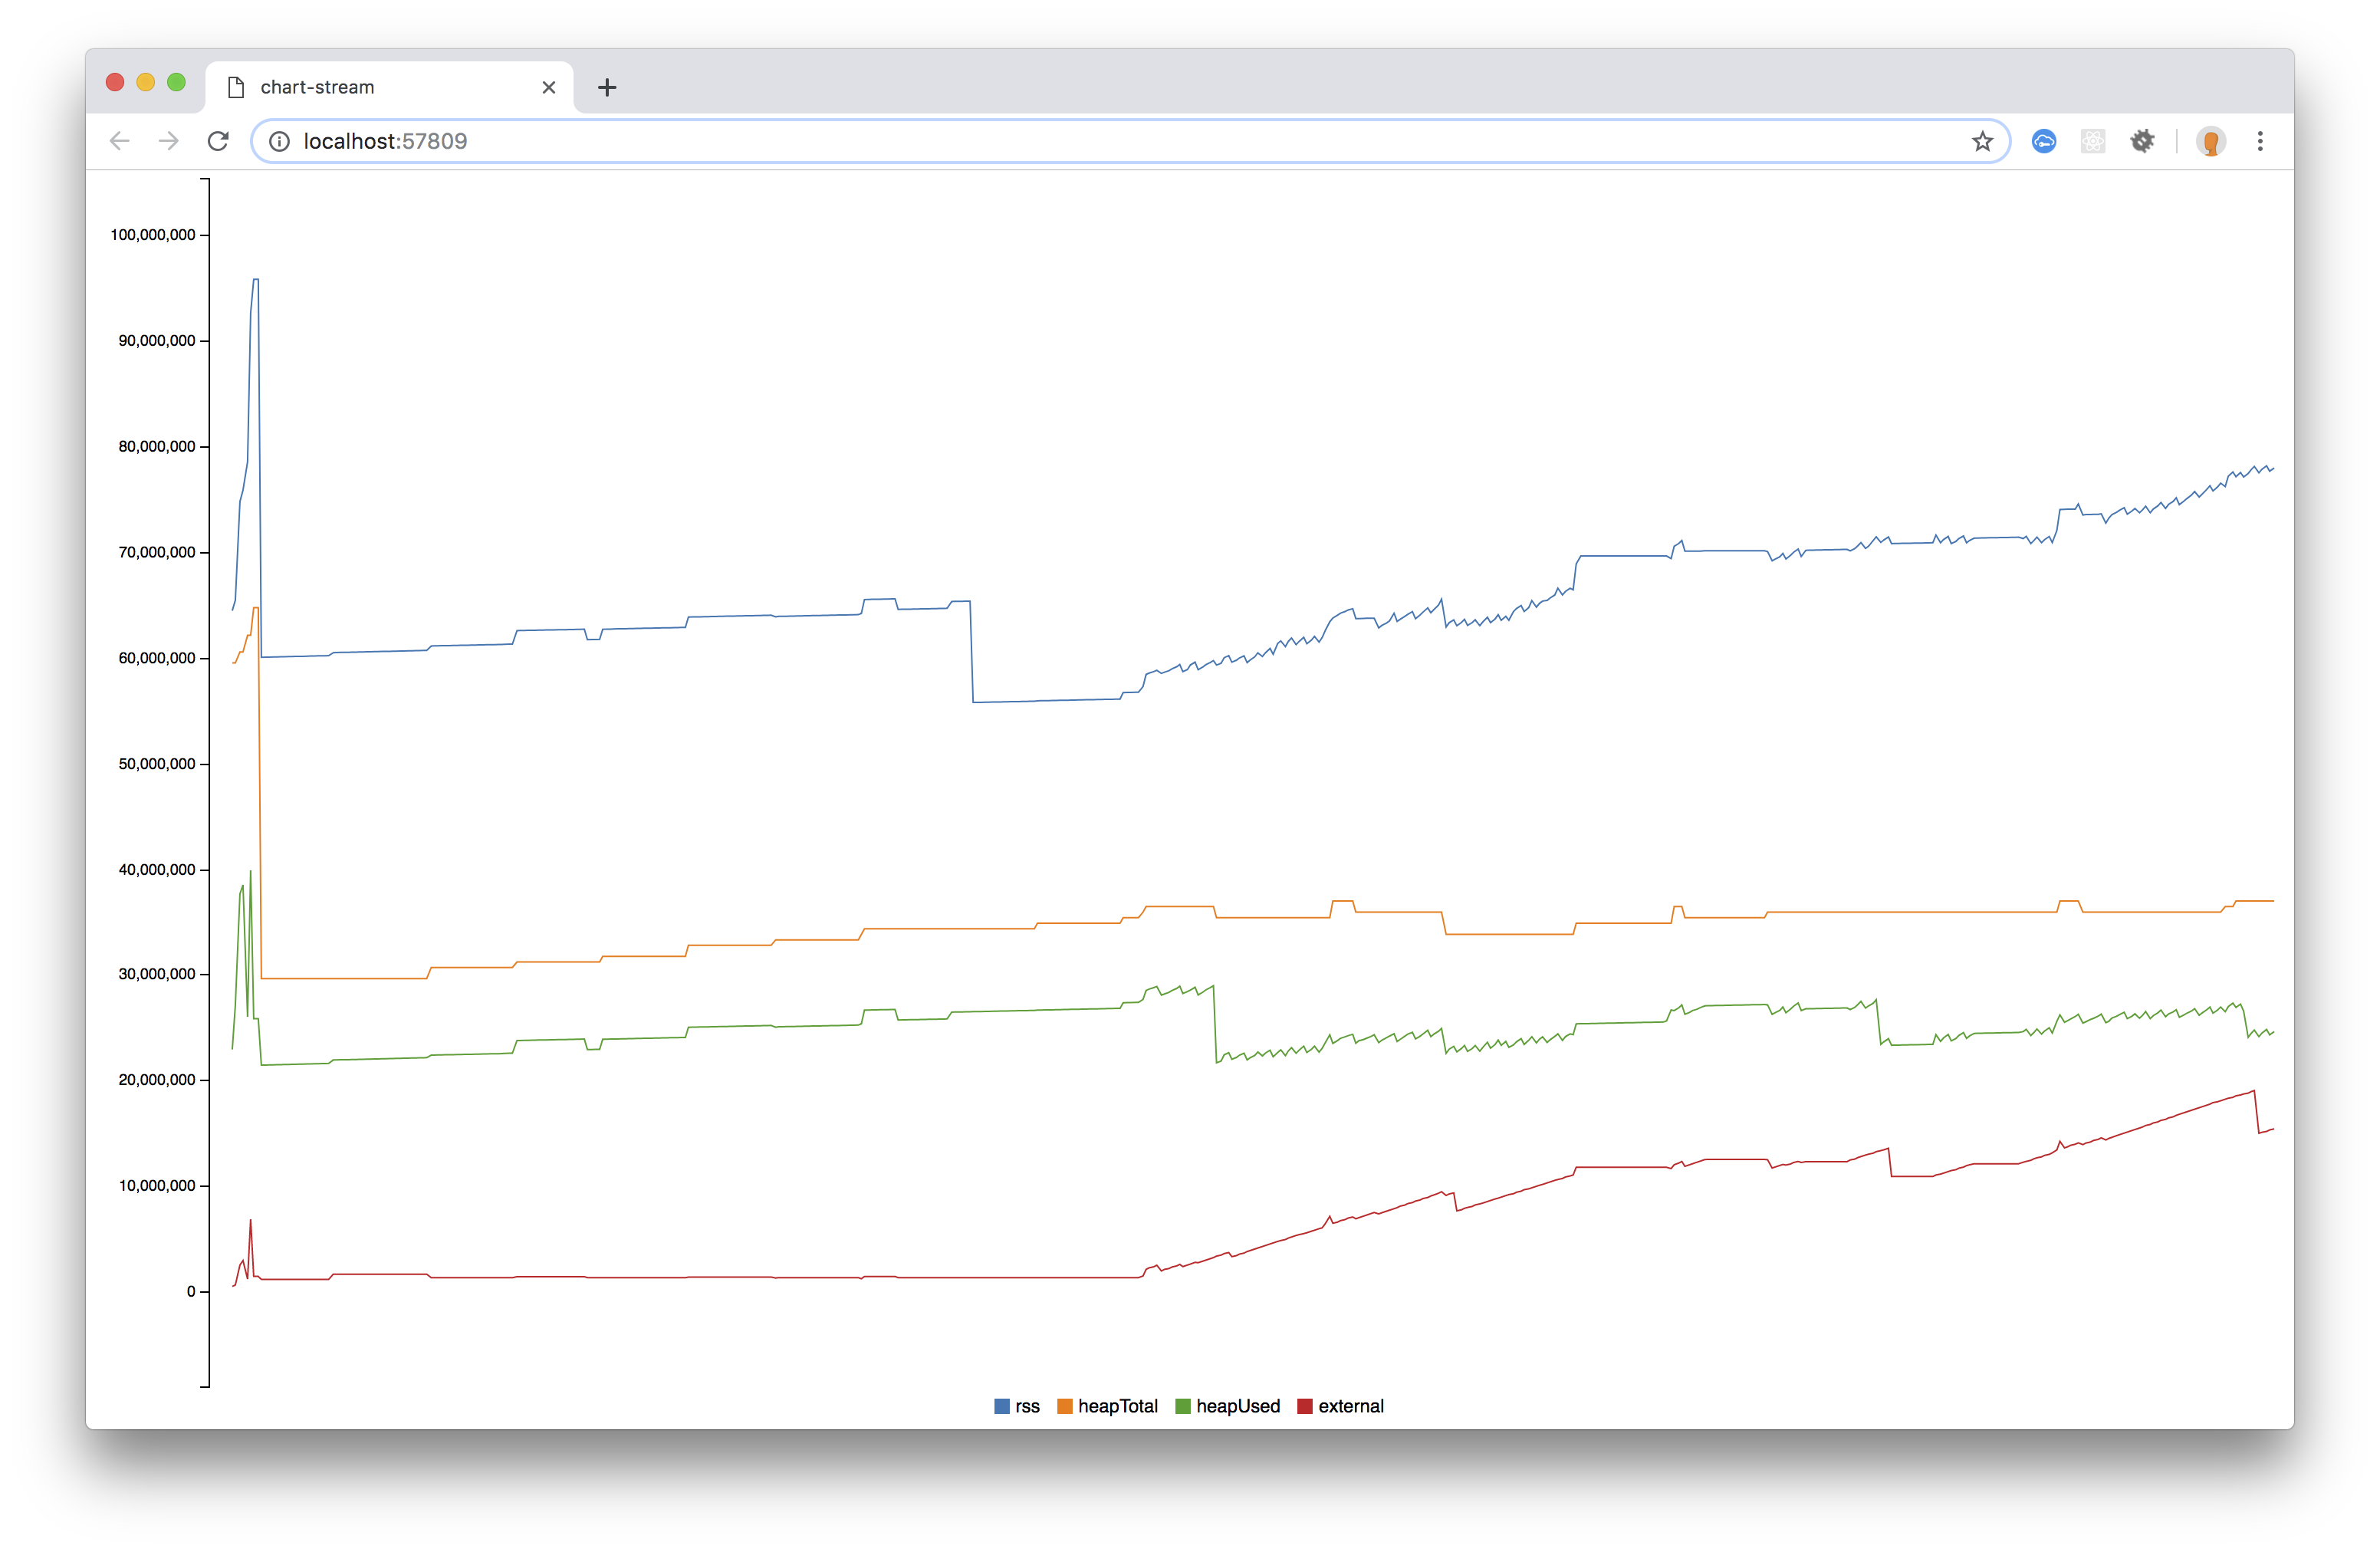
Some measurements I made using the memory-usage module:
v2.1.0:
v2.2.0:
v2.4.0:
v2.5.0:
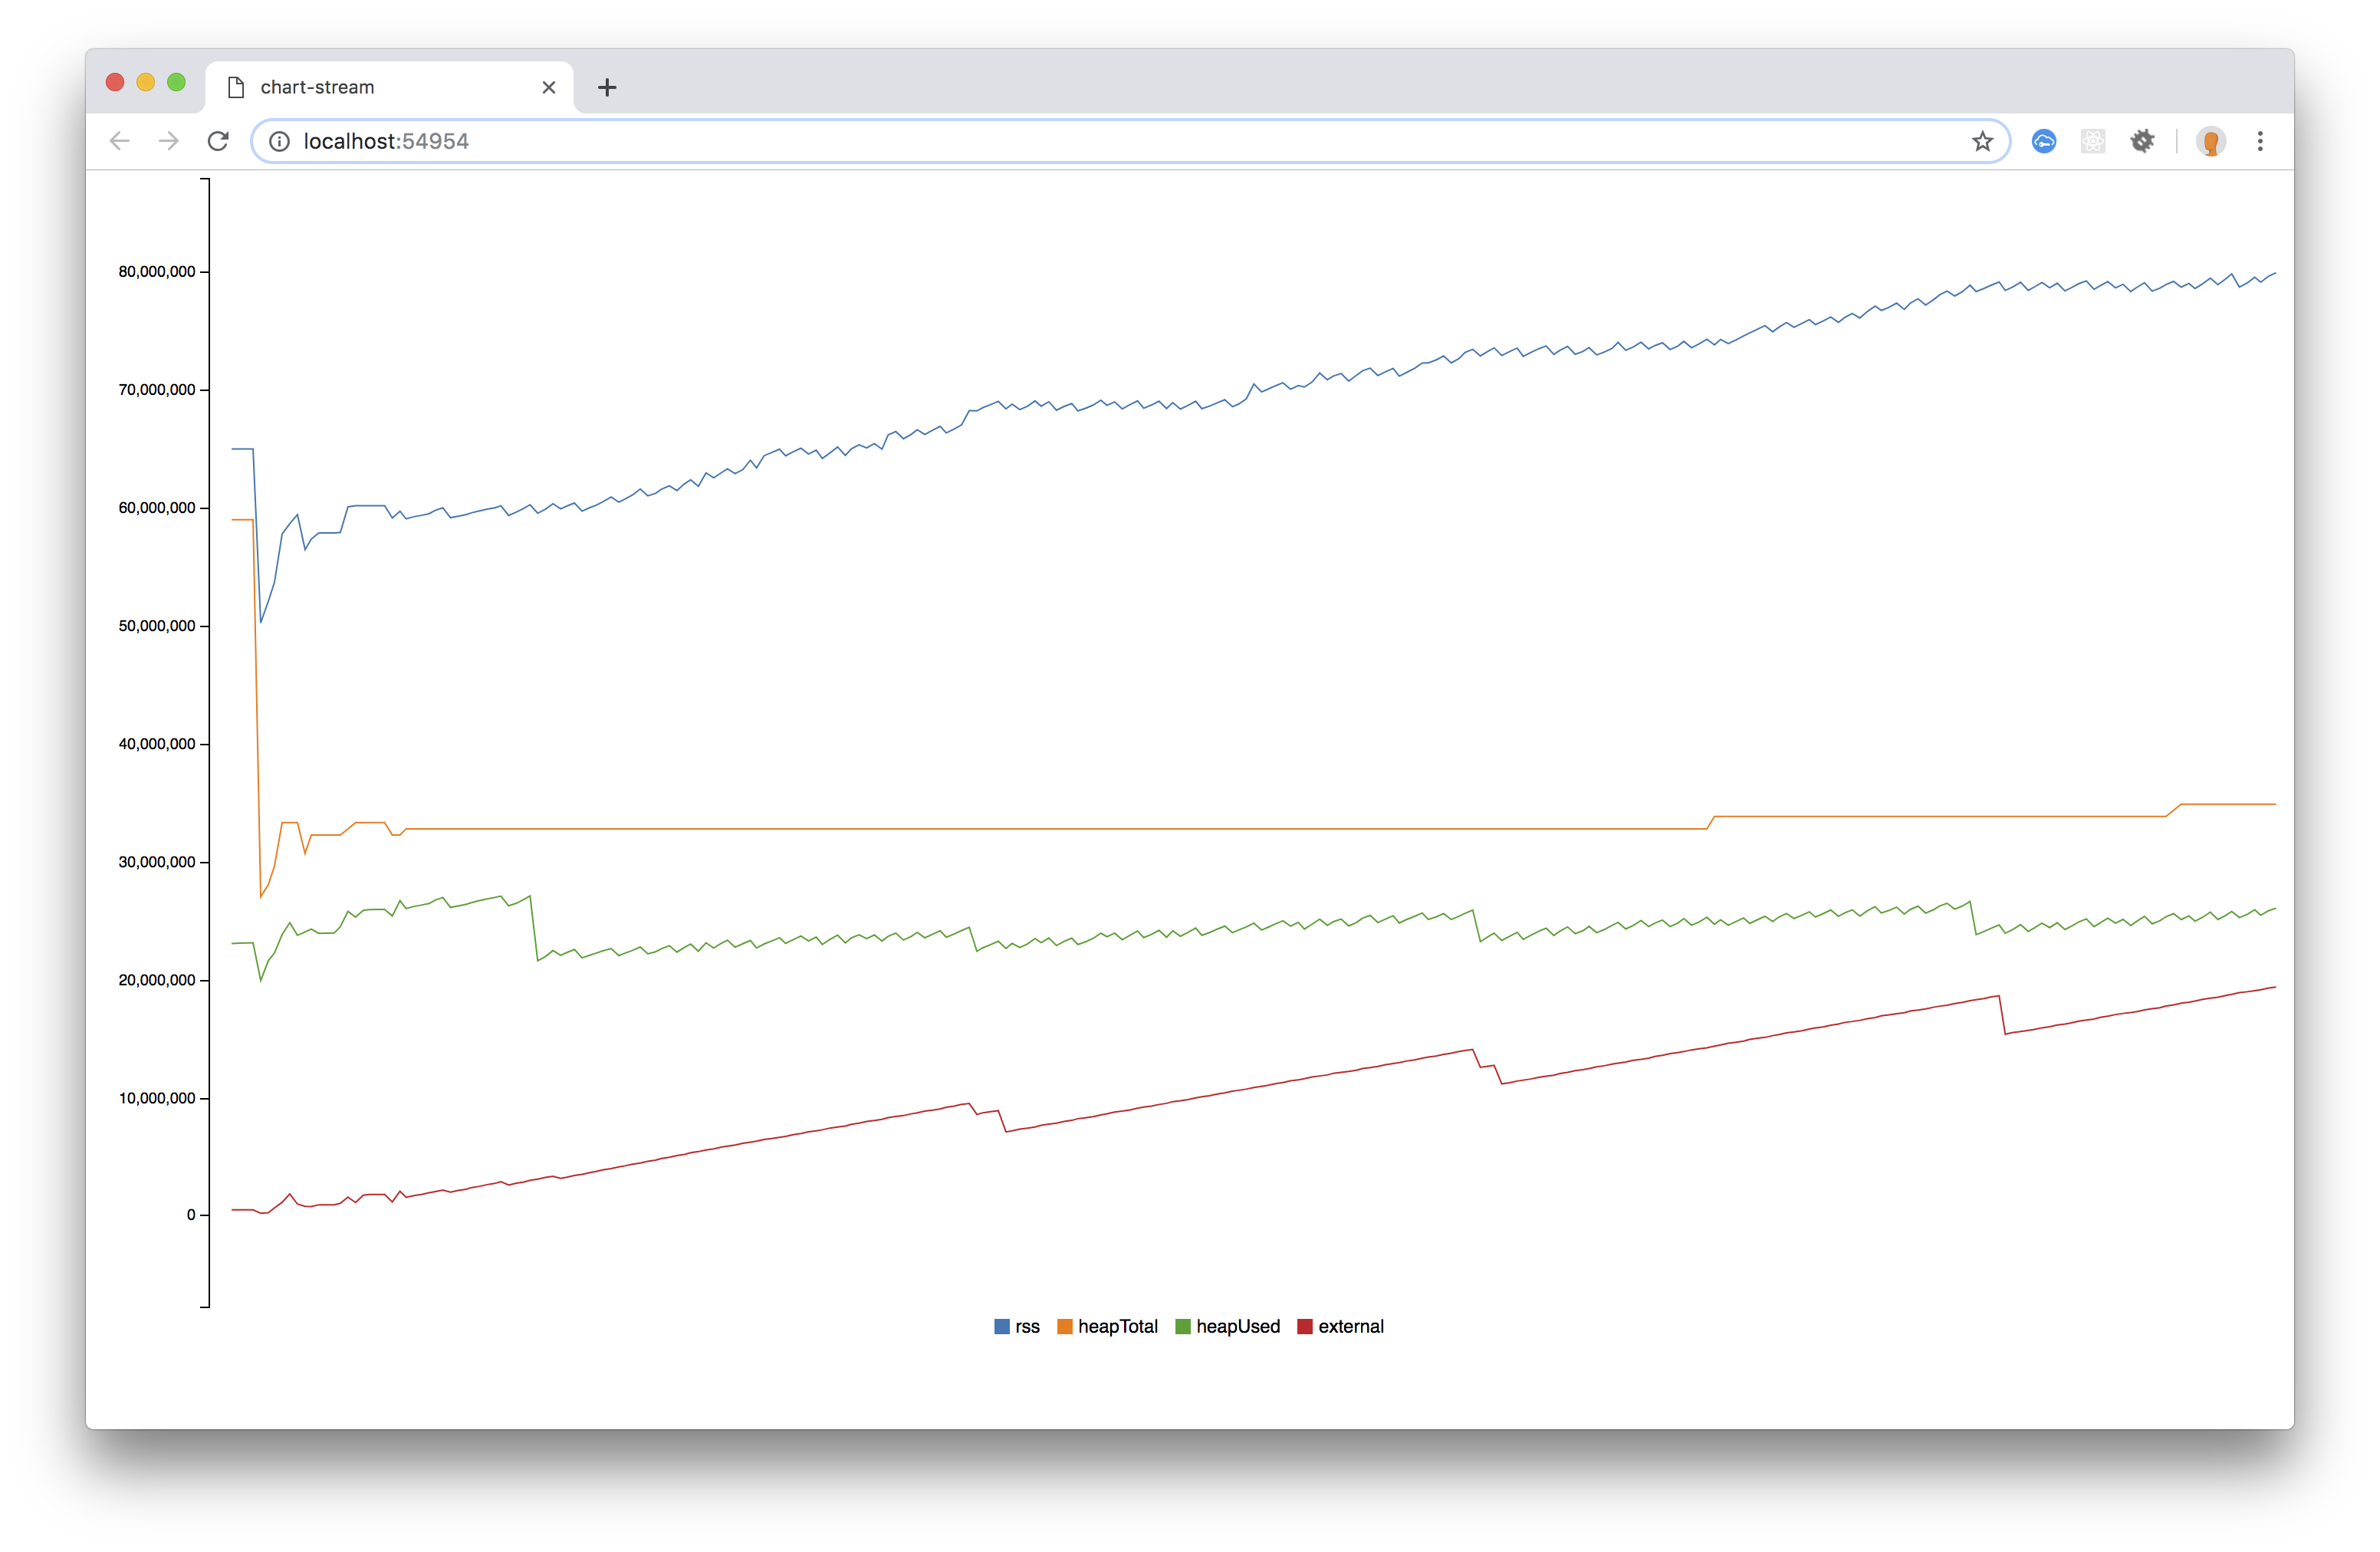
As you can see, the version 2.1.0 graph drops memory usage, while the later versions increase linearly over time and never release the memory back, even after stopping streaming.
 ivancevich
All 34 comments
Thanks for the detailed report! Would you be able to see if your memory usage inflates using only @google-cloud/storage? Additionally:
- What versions of the external modules are you using?
- Are those versions the same when you switch between @google-cloud/storage versions?
 stephenplusplus
on 2 May 2019
stephenplusplus
on 2 May 2019
One additional note that could be related; in 2.2.0, we switched to teeny-request (cc @fhinkel).
stephenplusplus
on 2 May 2019
Hi @stephenplusplus, thanks for your reply.
I'm not sure what you mean by "Would you be able to see if your memory usage inflates using only @google-cloud/storage?". Using it without any other Node packages?
What versions of the external modules are you using?
I'm using the latest versions of all my other dependencies:
- "@bugsnag/js": "^6.2.0"
- "@bugsnag/plugin-express": "^6.2.0"
- "@google-cloud/datastore": "^3.1.2"
- "cors": "^2.8.5"
- "express": "^4.16.4"
- "http-status-codes": "^1.3.2"
- "jsonwebtoken": "^8.5.1"
- "lodash.get": "^4.4.2"
- "lodash.isequal": "^4.5.0"
- "random-bytes-readable-stream": "^2.1.0"
- "redis": "^2.8.0"
- "stream-parser": "^0.3.1"
- "winston": "3.2.1"
Are those versions the same when you switch between @google-cloud/storage versions?
Yes, I kept all the other versions the same while trying different versions of @google-cloud/storage.
ivancevich
on 2 May 2019
Thank you!
Using it without any other Node packages?
Yes, I meant if you're able to simply pipe the GCS read stream to stdout, or a local file-- something that doesn't require external dependencies, as those introduce complexity in the reproduction.
stephenplusplus
on 2 May 2019
Gotcha. I'll run those tests and get back to you.
ivancevich
on 2 May 2019
@stephenplusplus, I've run the tests you asked me to. This is the code I used for testing:
const { Storage } = require("@google-cloud/storage");
const fs = require("fs");
const storage = new Storage({ projectId: "my-project-id" });
const bucket = storage.bucket("my-bucket-name");
const filename = "my-file-name.mp3";
const output = fs.createWriteStream(filename);
bucket
.file(filename)
.createReadStream()
.on("error", err => {
console.error("error", err.toString());
})
.on("end", () => {
console.log("end");
})
.pipe(output);
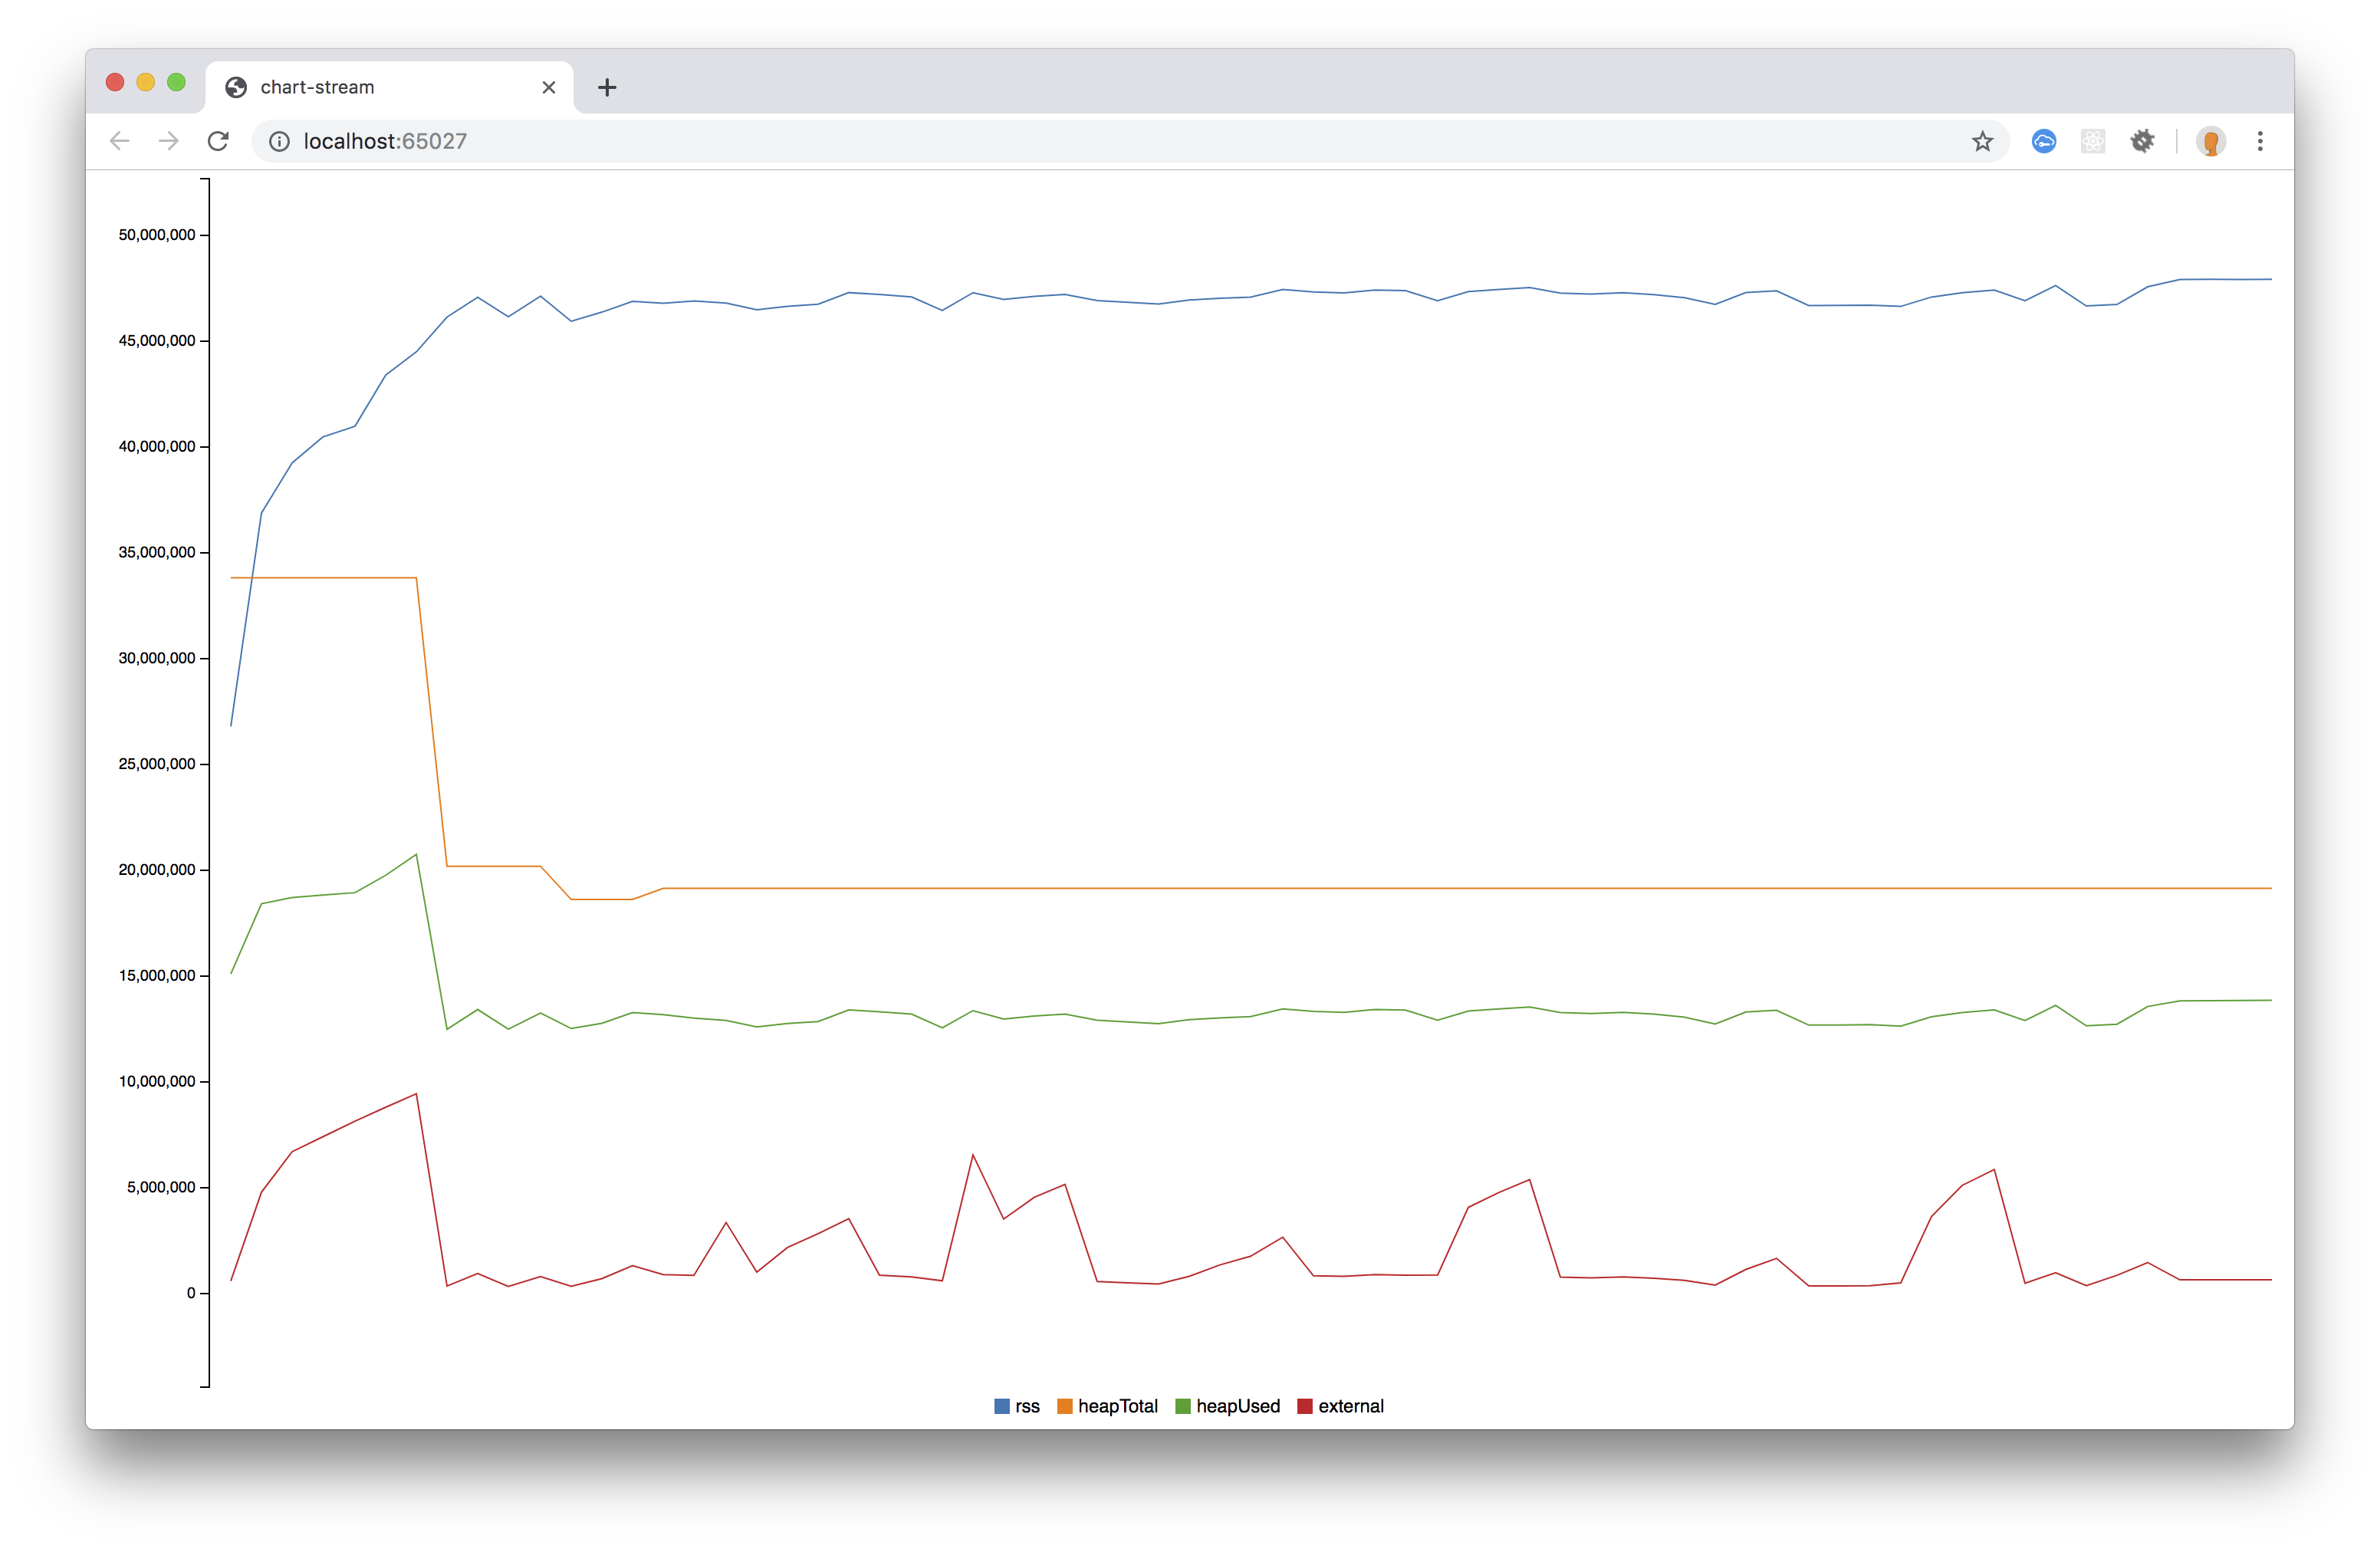
These are the results of my tests:
v2.1.0:
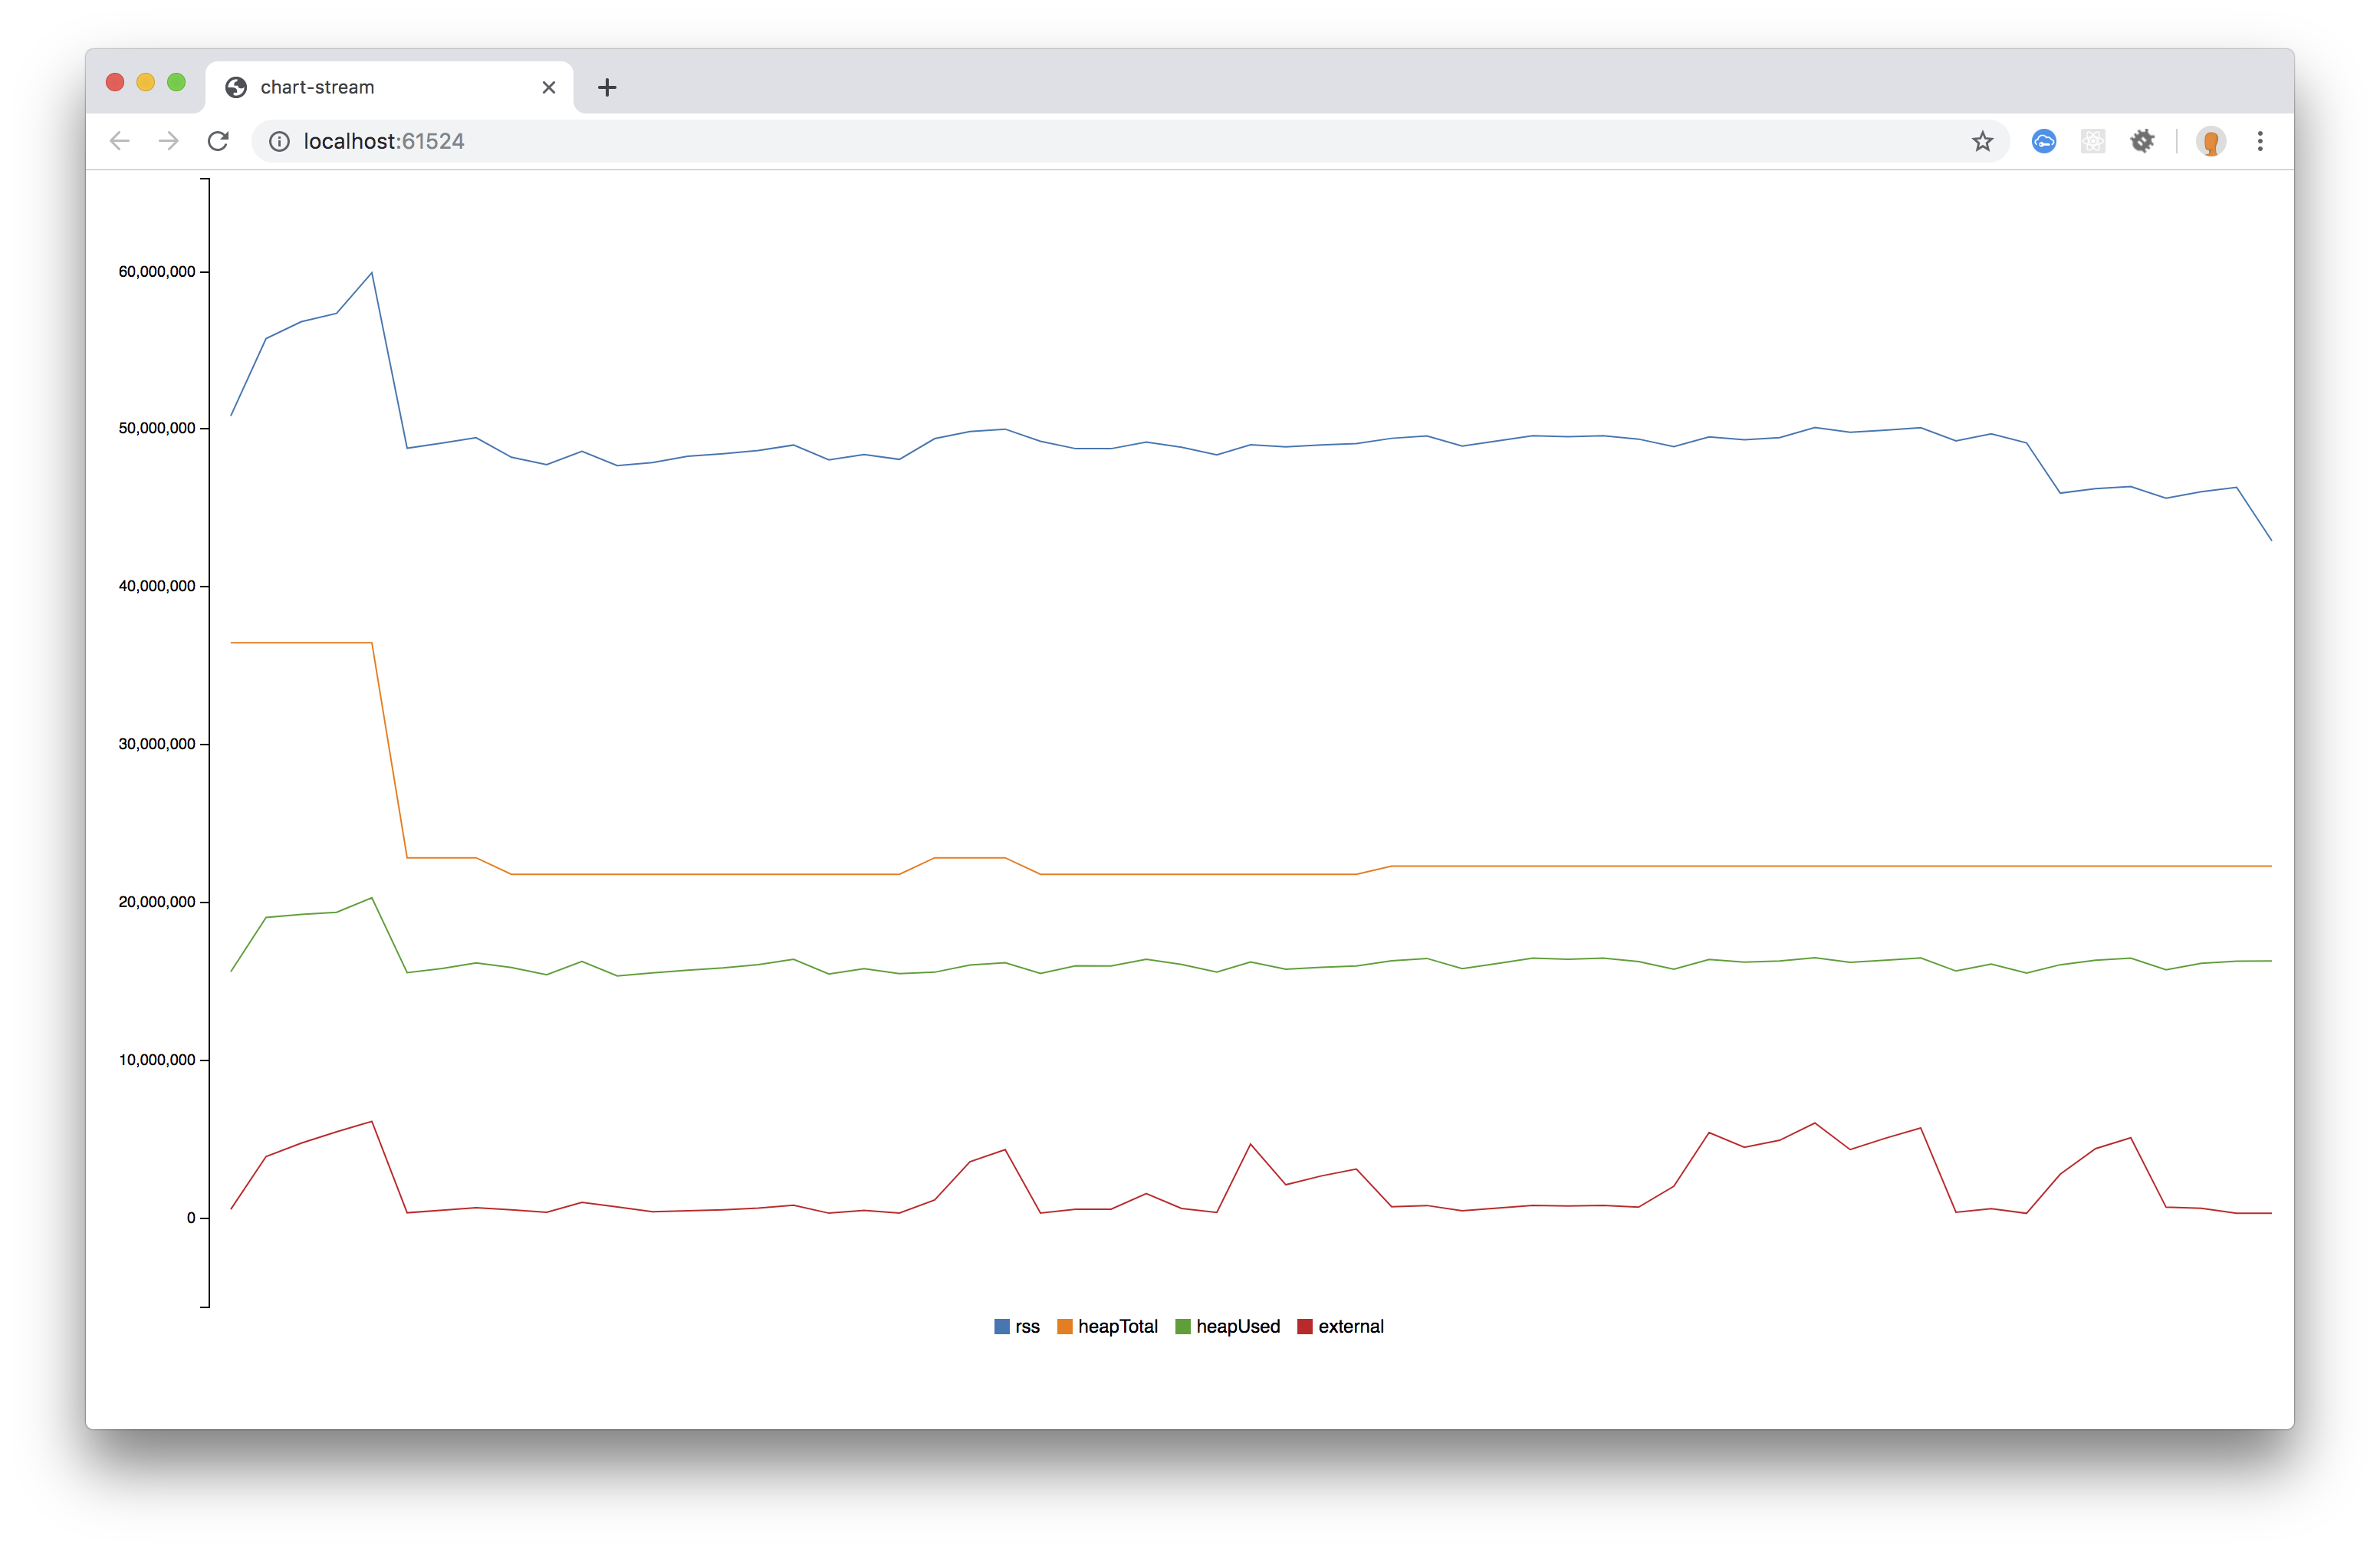
v2.2.0:
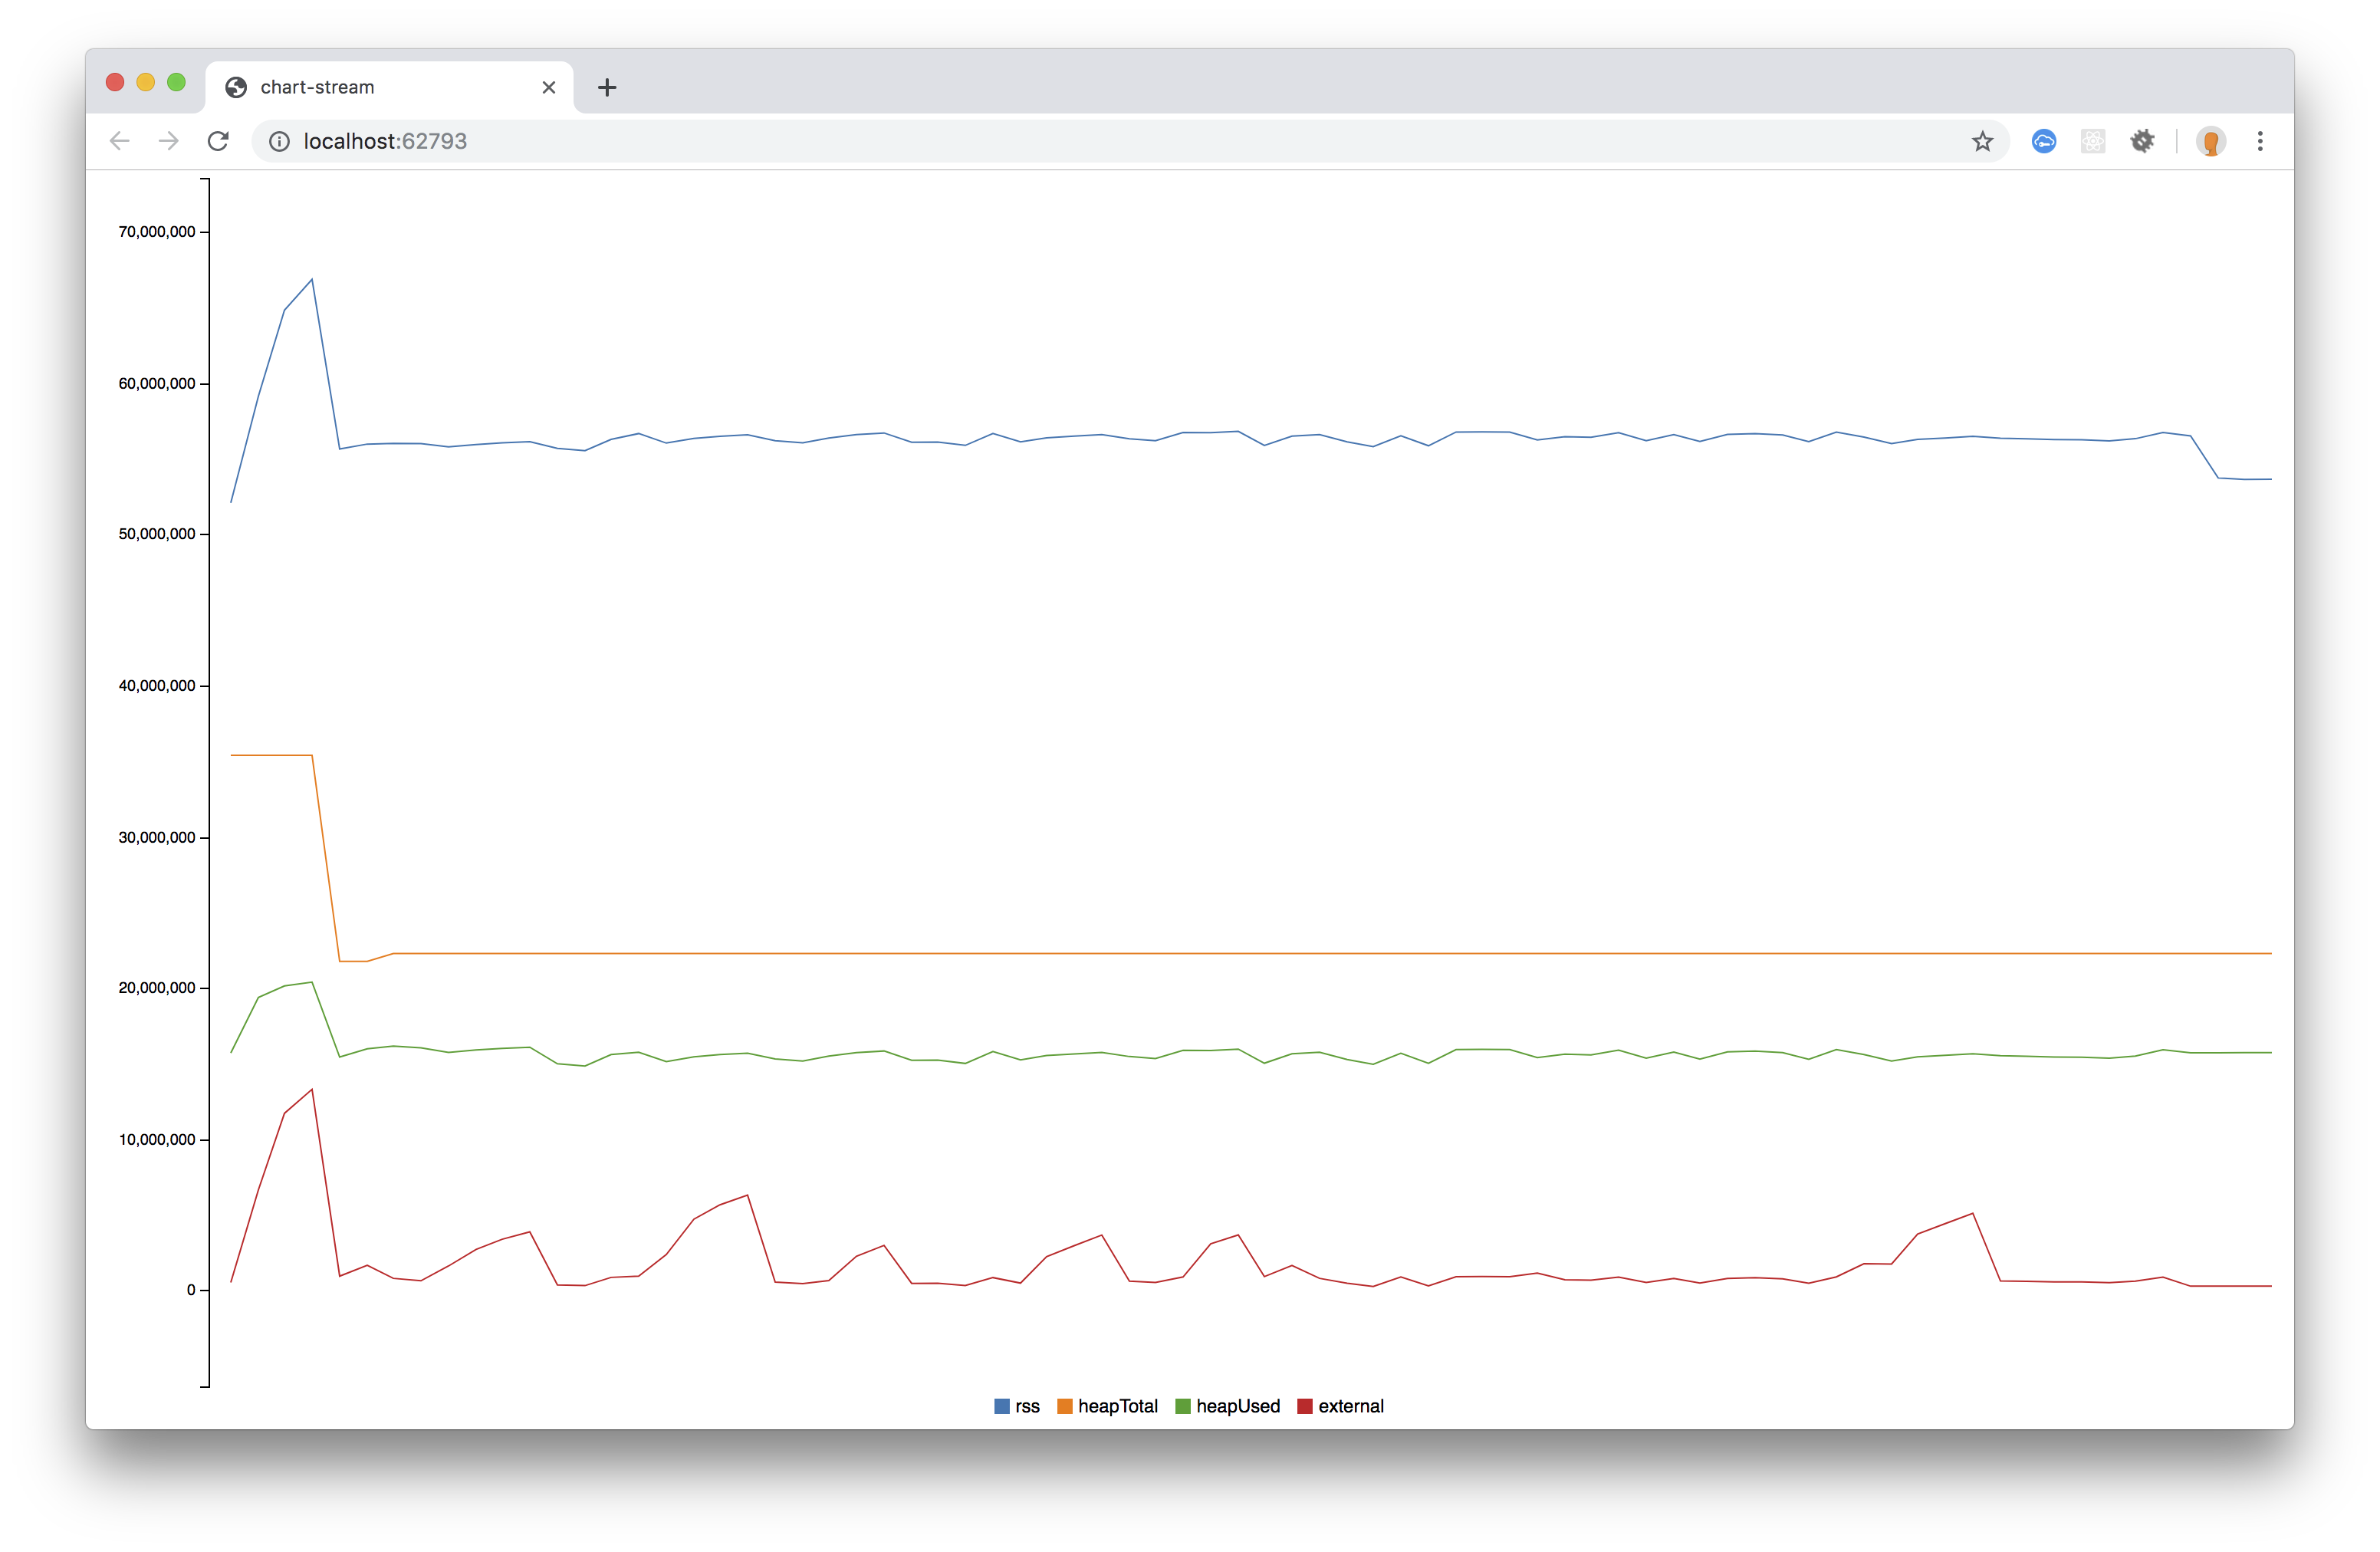
v2.3.4:
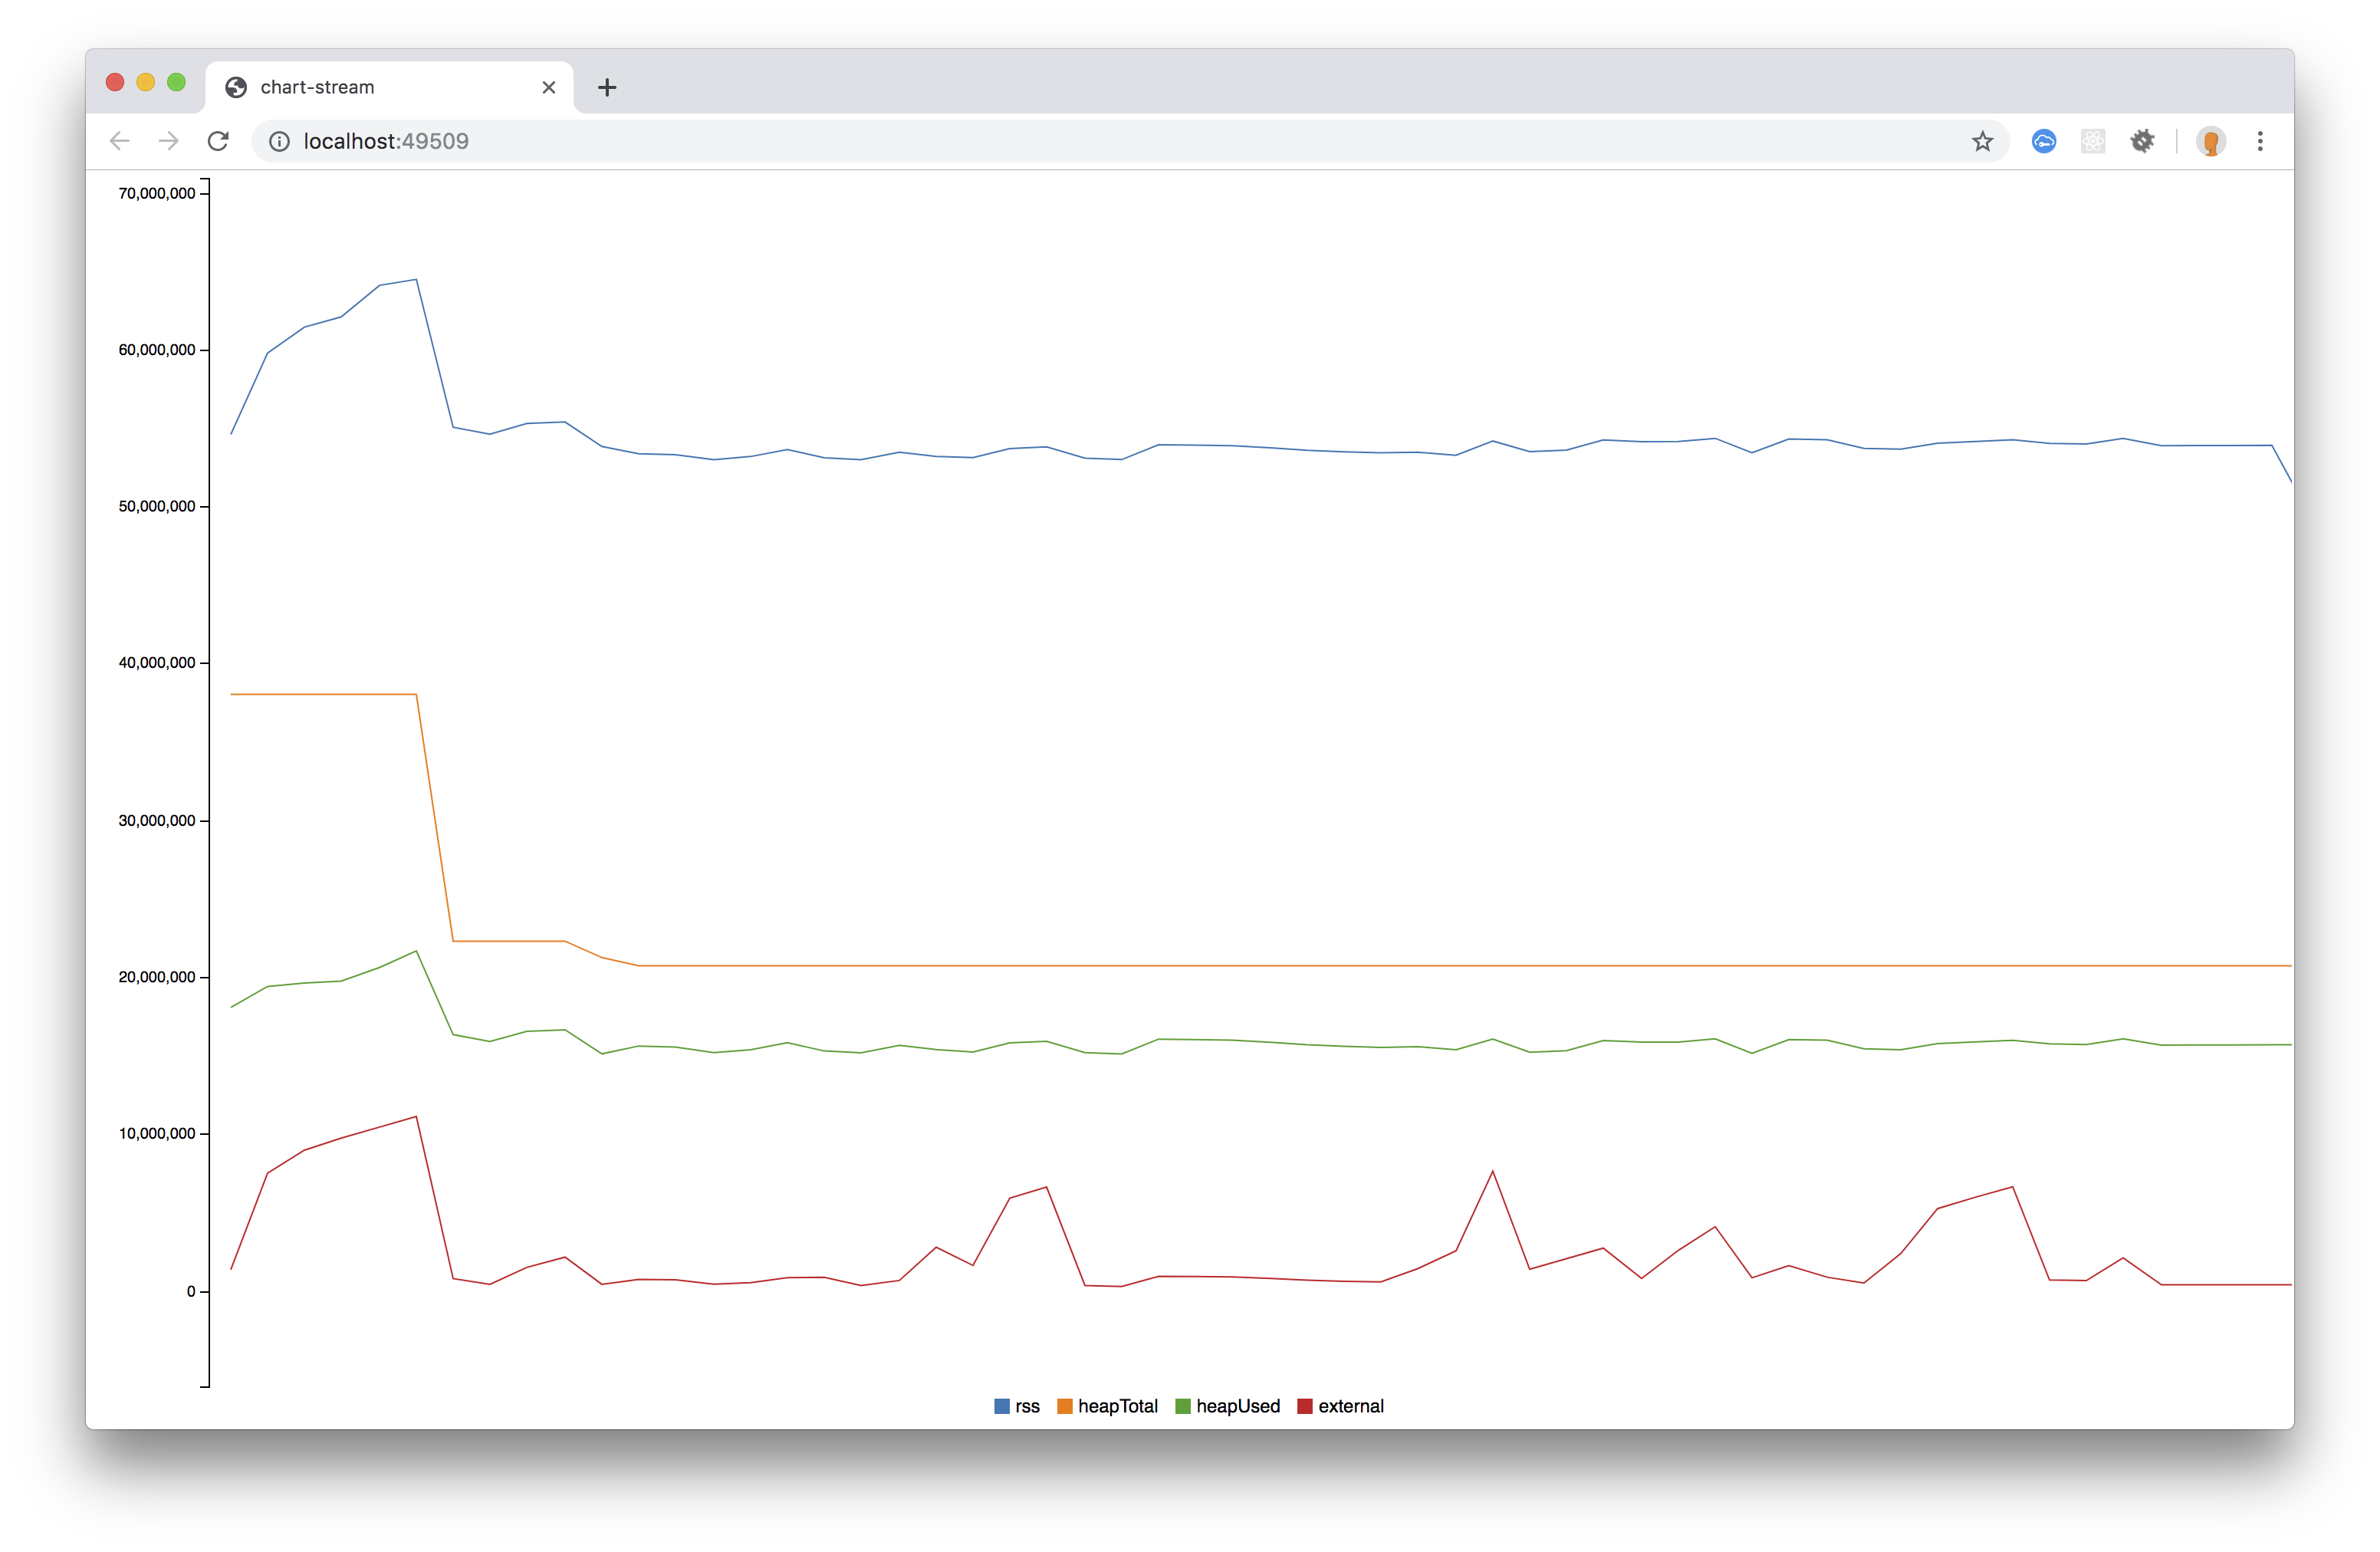
v2.4.3:
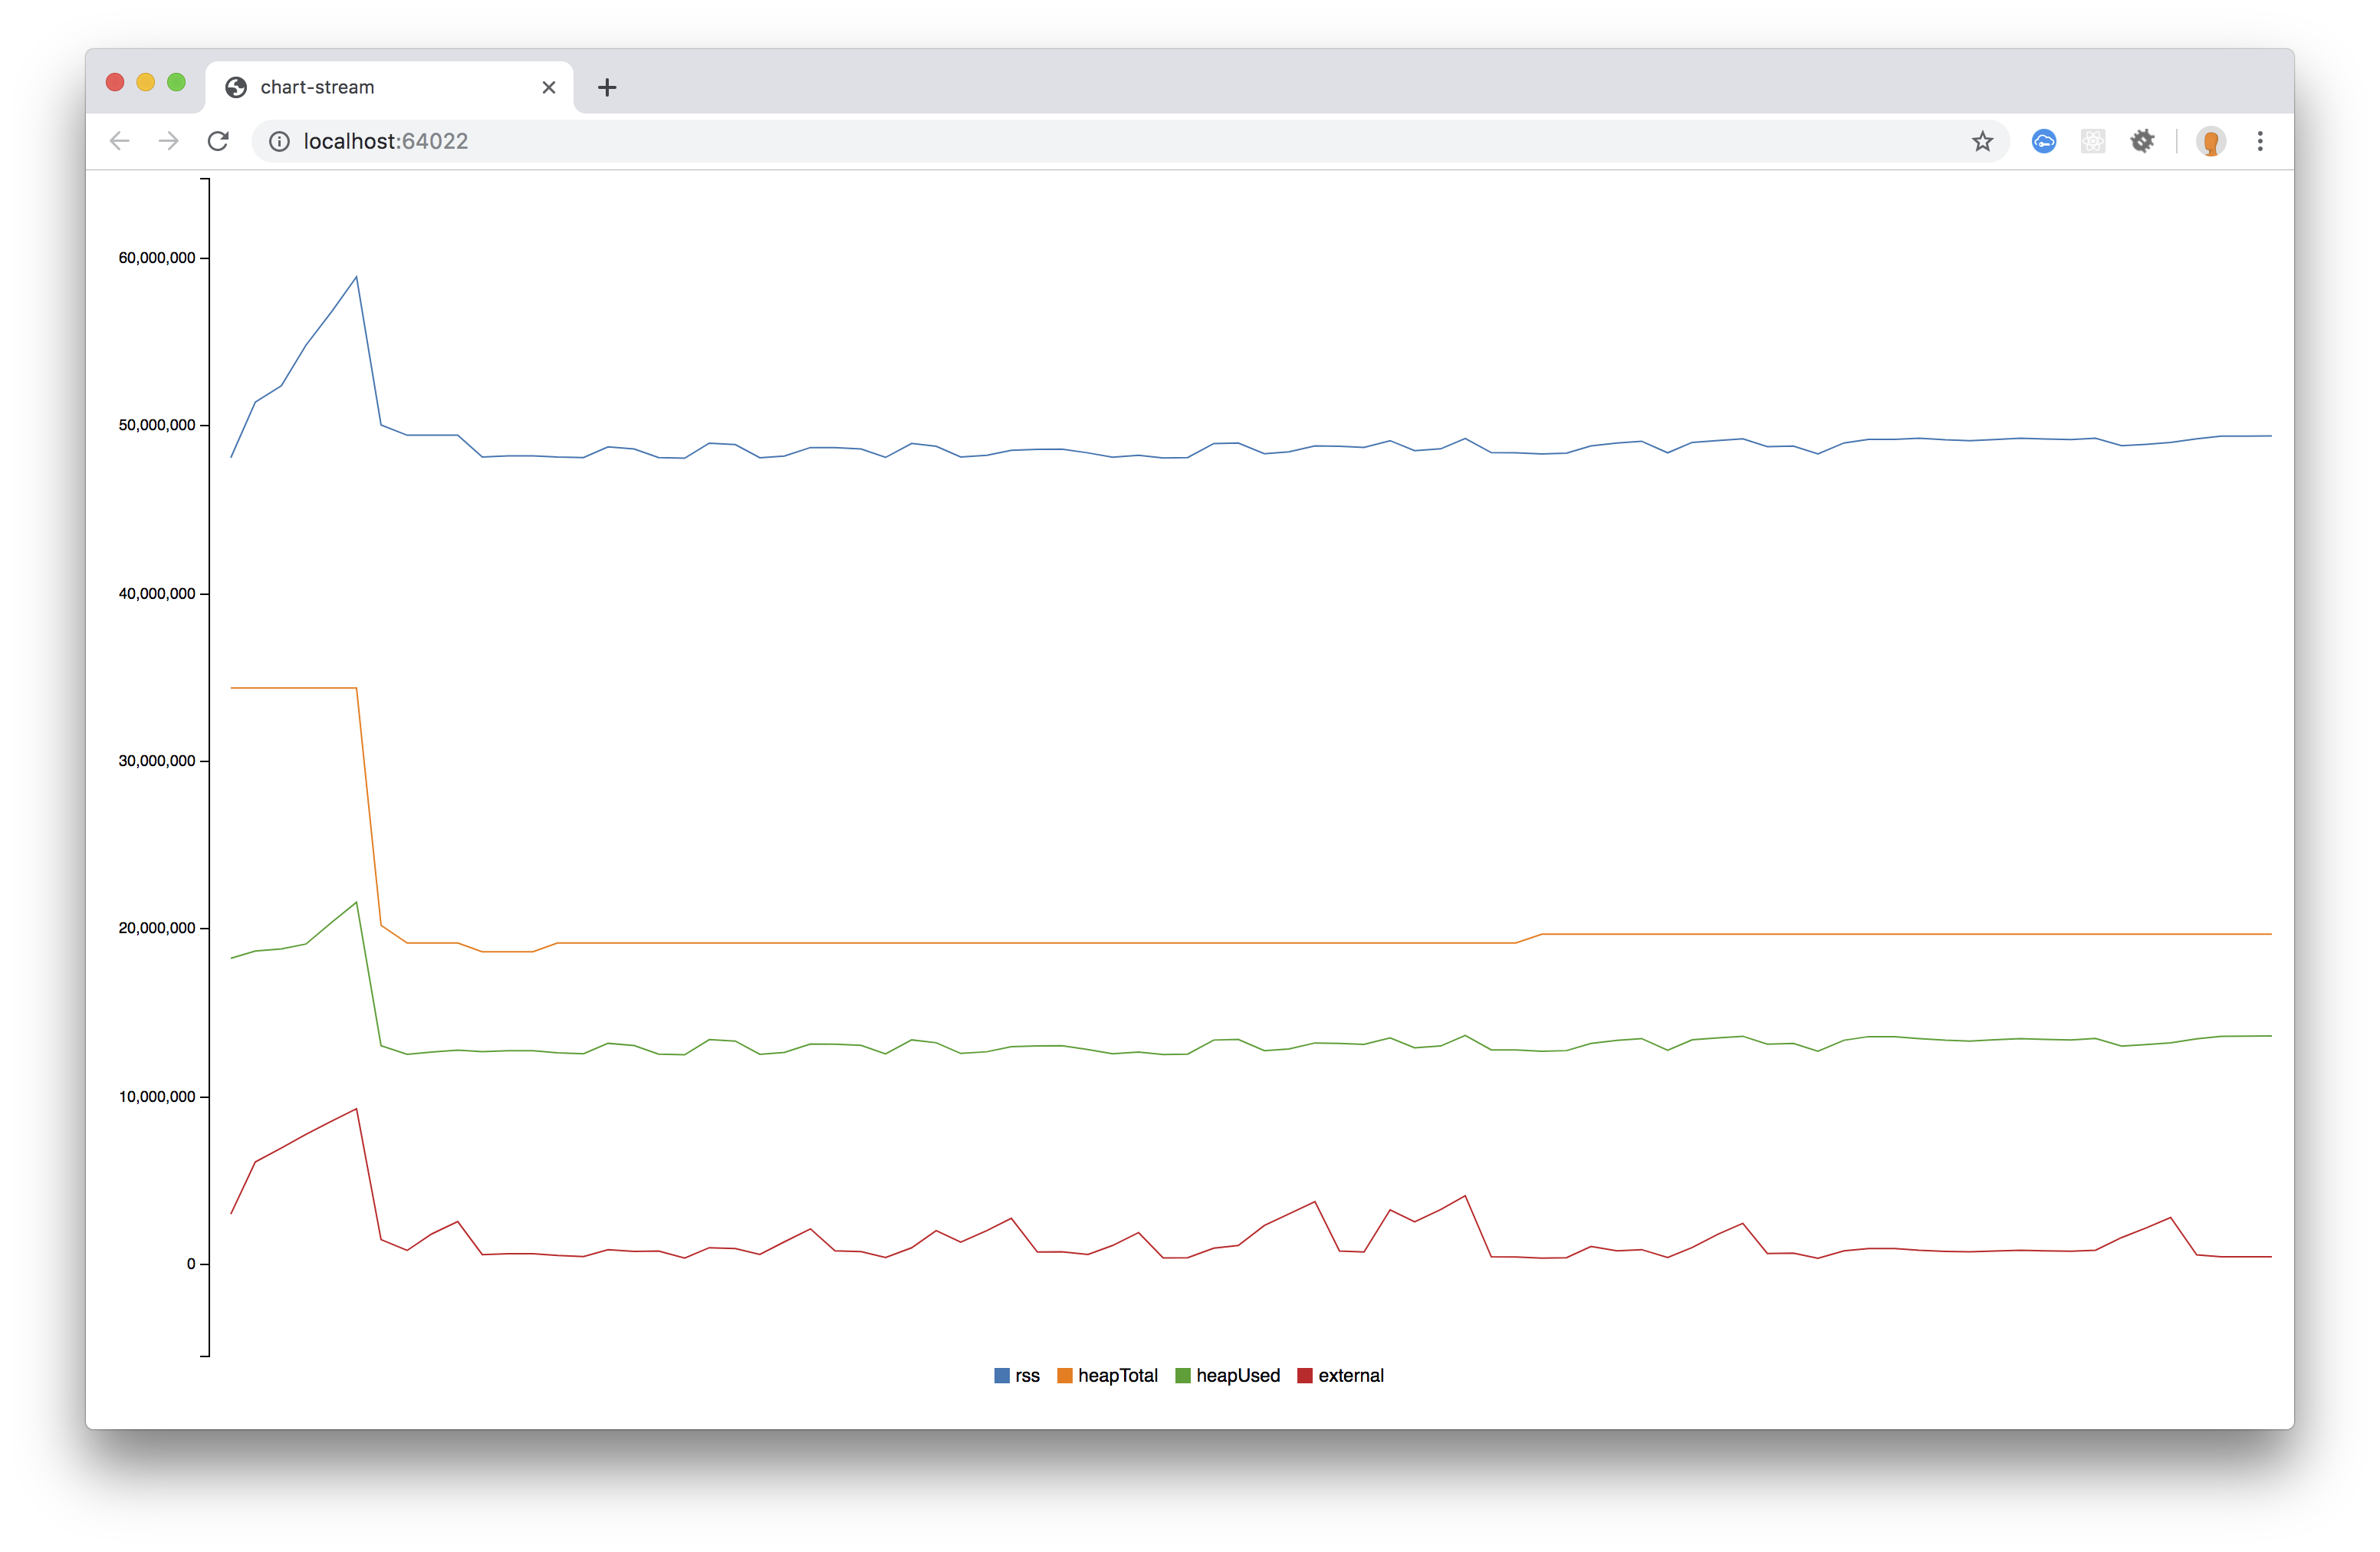
v2.5.0:
ivancevich
on 2 May 2019
Thank you very much for running those. What would you say you found from these tests?
stephenplusplus
on 2 May 2019
@stephenplusplus, as you can see in the graphs, it seems all versions behave more or less the same except from v2.5.0 which doesn't seem to release Resident Set Size (RSS) memory.
FYI, the files streamed both in the tests and in my specific production use case are ~100MB MP3's.
Let me know if I can run any other tests for you.
ivancevich
on 3 May 2019
Thank you for that. That dependency we introduced in 2.5.0 has since been removed (#666), but we haven't cut a new release yet. Would you be able to test against master? npm install googleapis/nodejs-storage
stephenplusplus
on 7 May 2019
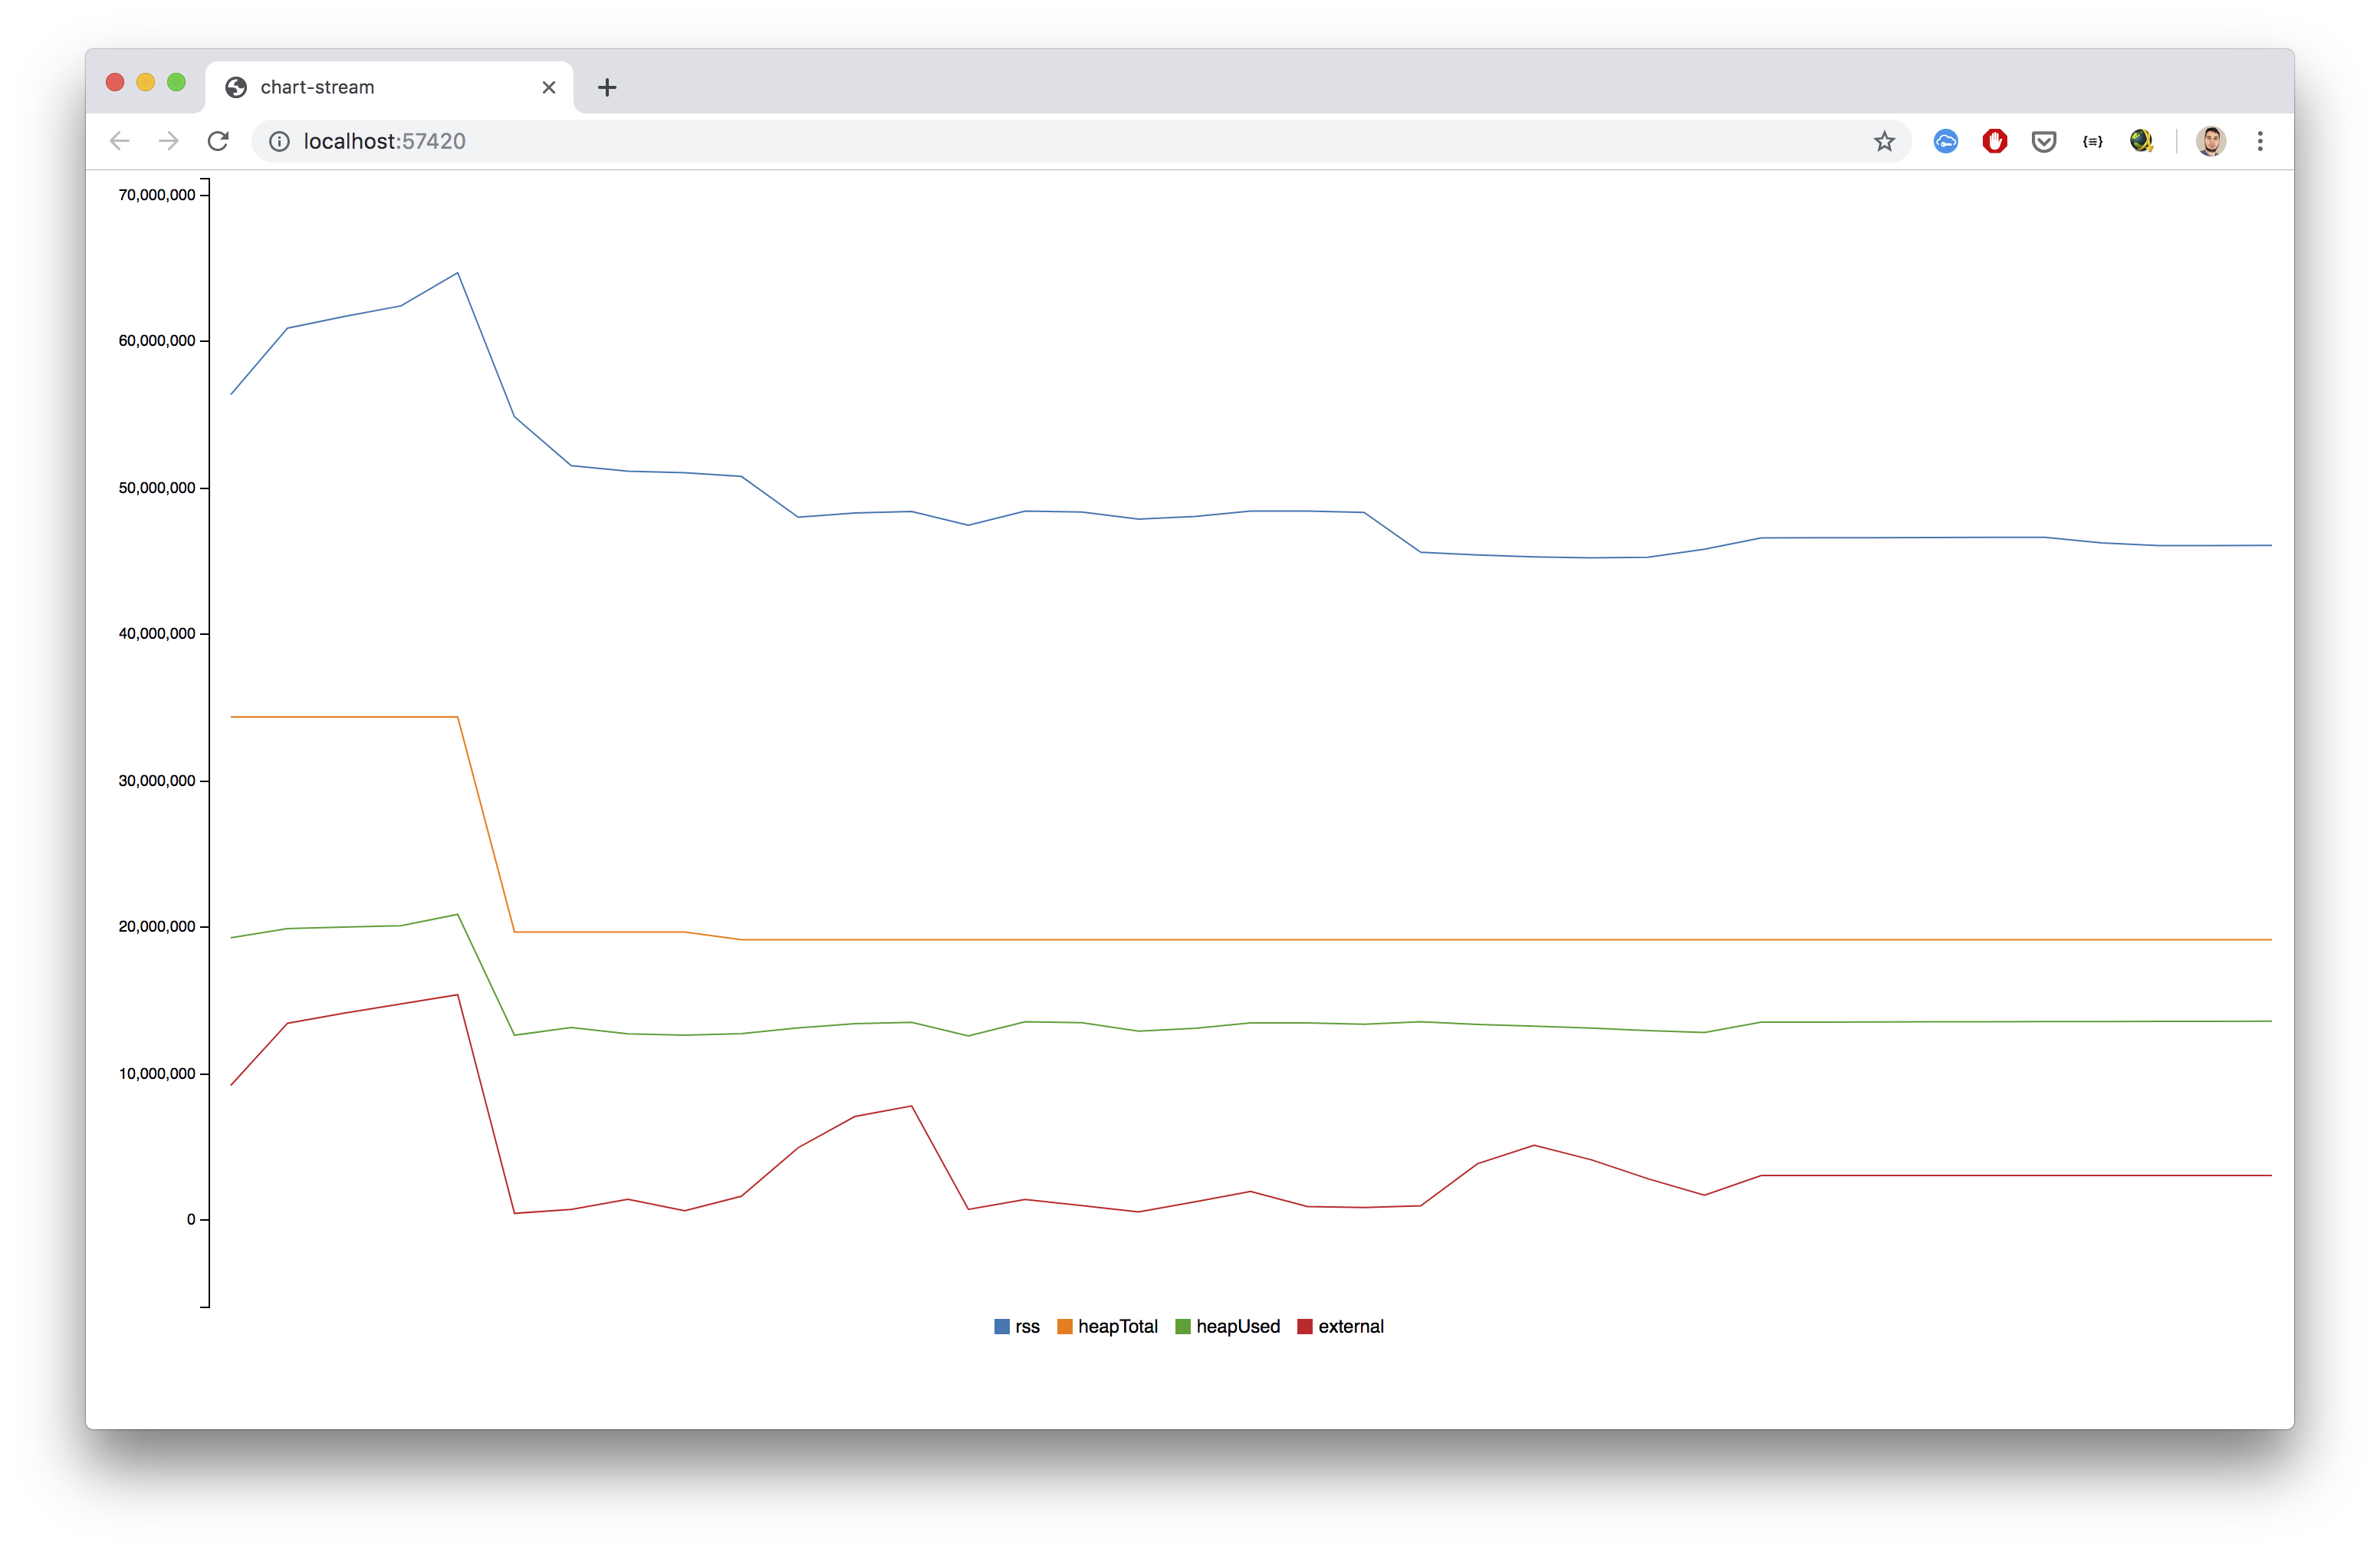
@stephenplusplus, sorry for the delay. Here's the graph running the same test script using master (https://github.com/googleapis/nodejs-storage/commit/42937a81dd599c46ebe1226a9c7eddc861c73d7a):
ivancevich
on 8 May 2019
No worries, thank you for running it. It looks like the problem is resolved using master then, would you agree?
stephenplusplus
on 8 May 2019
It seems that's the case. I'm going to try with my specific use case and see how it goes. Thanks again!
ivancevich
on 8 May 2019
Great, excited to hear how it does. 🤞
stephenplusplus
on 8 May 2019
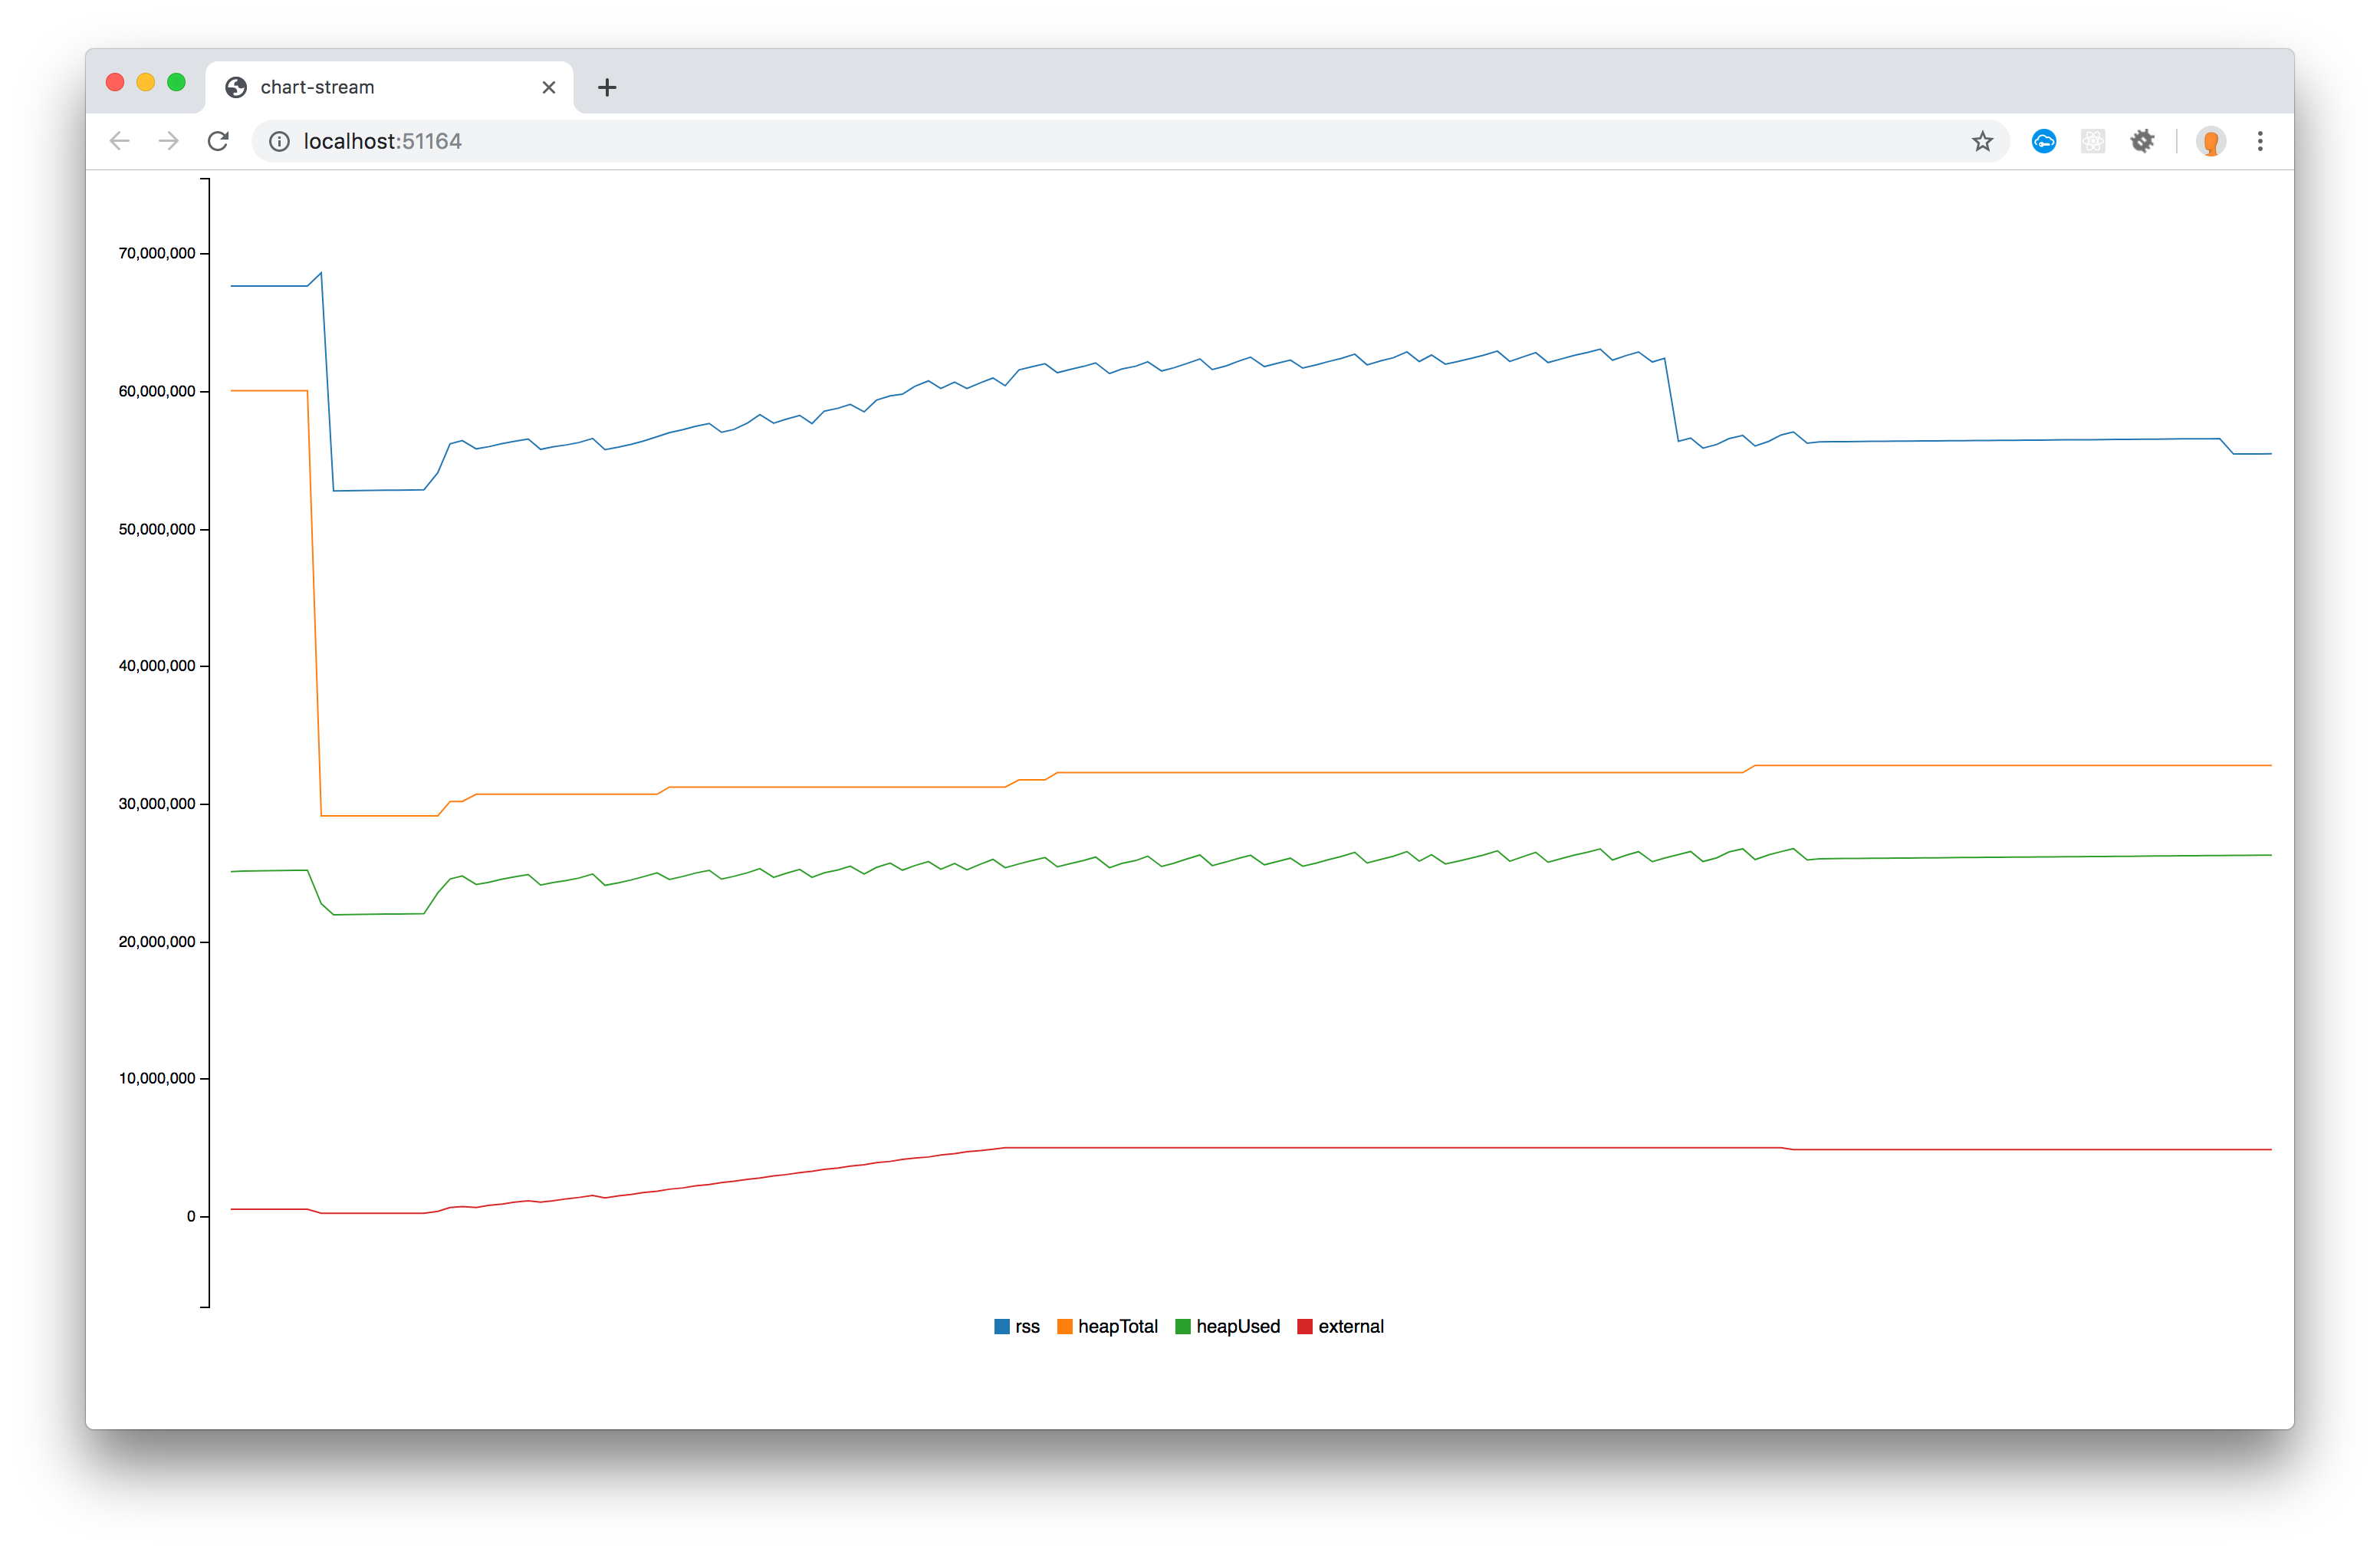
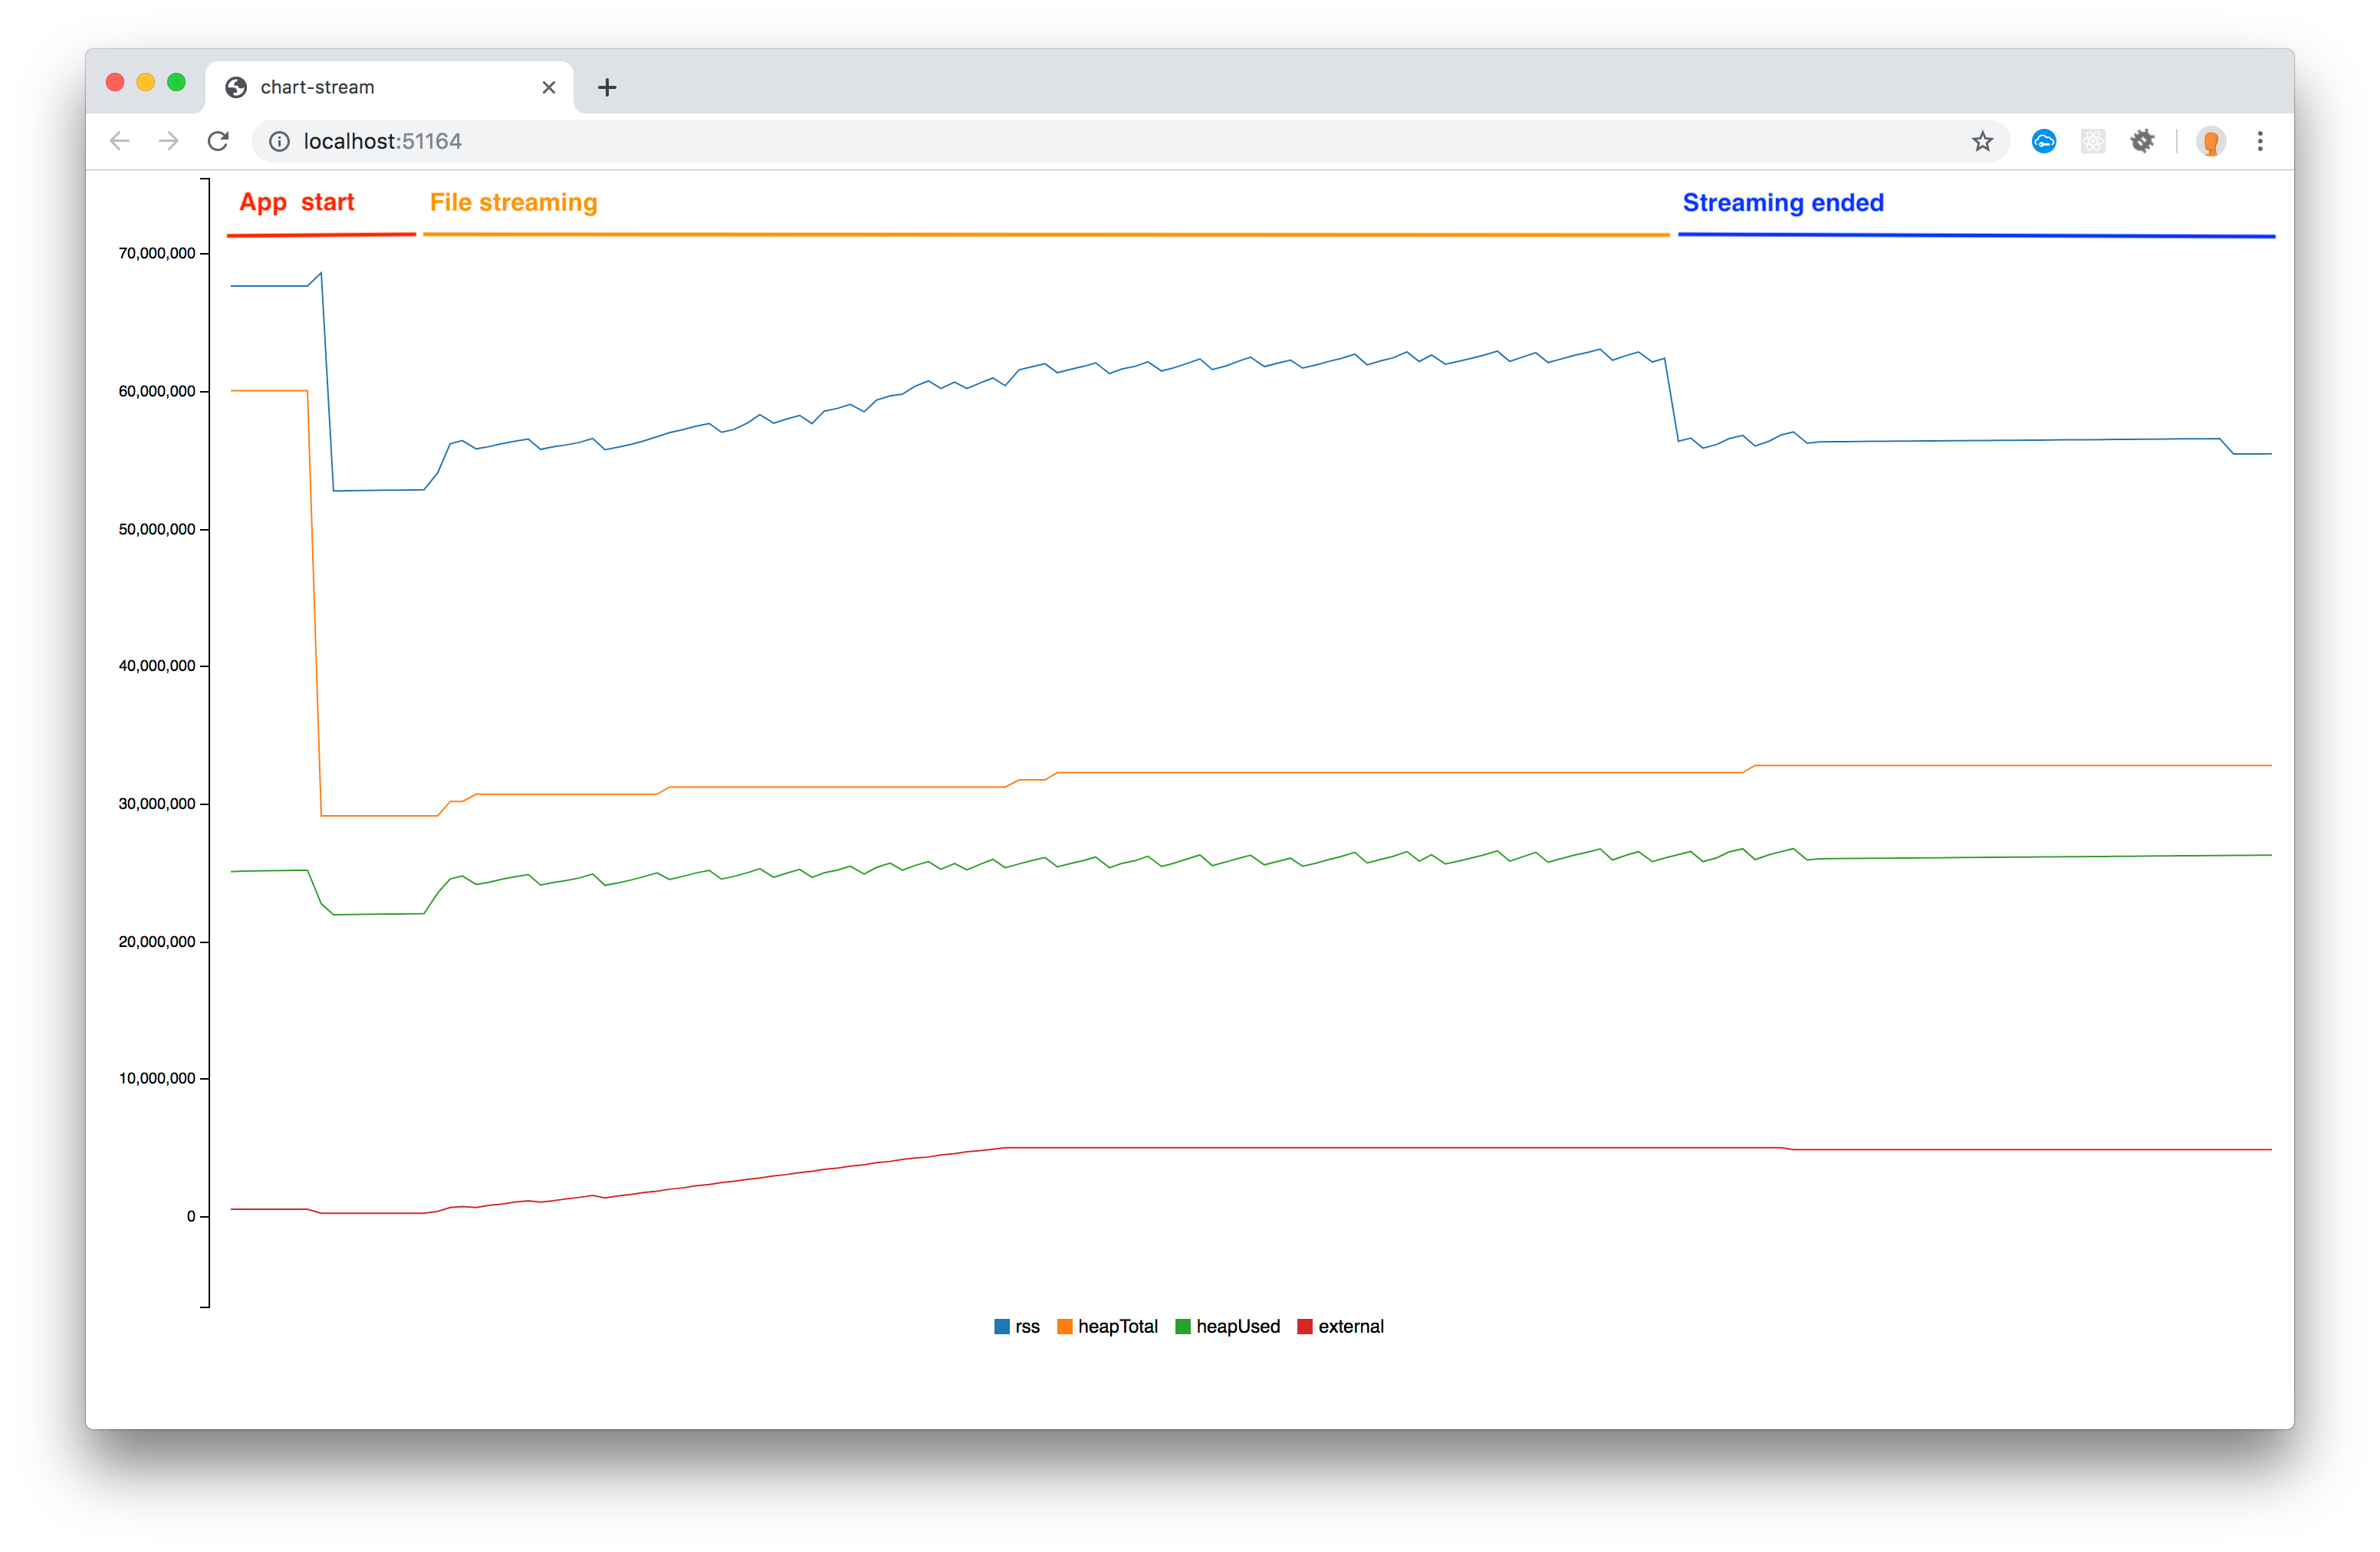
@stephenplusplus, I've tested my use case with master and then I streamed the exact same file using v2.1.0 in order to compare them. Here are the graphs:
master:
v2.1.0:
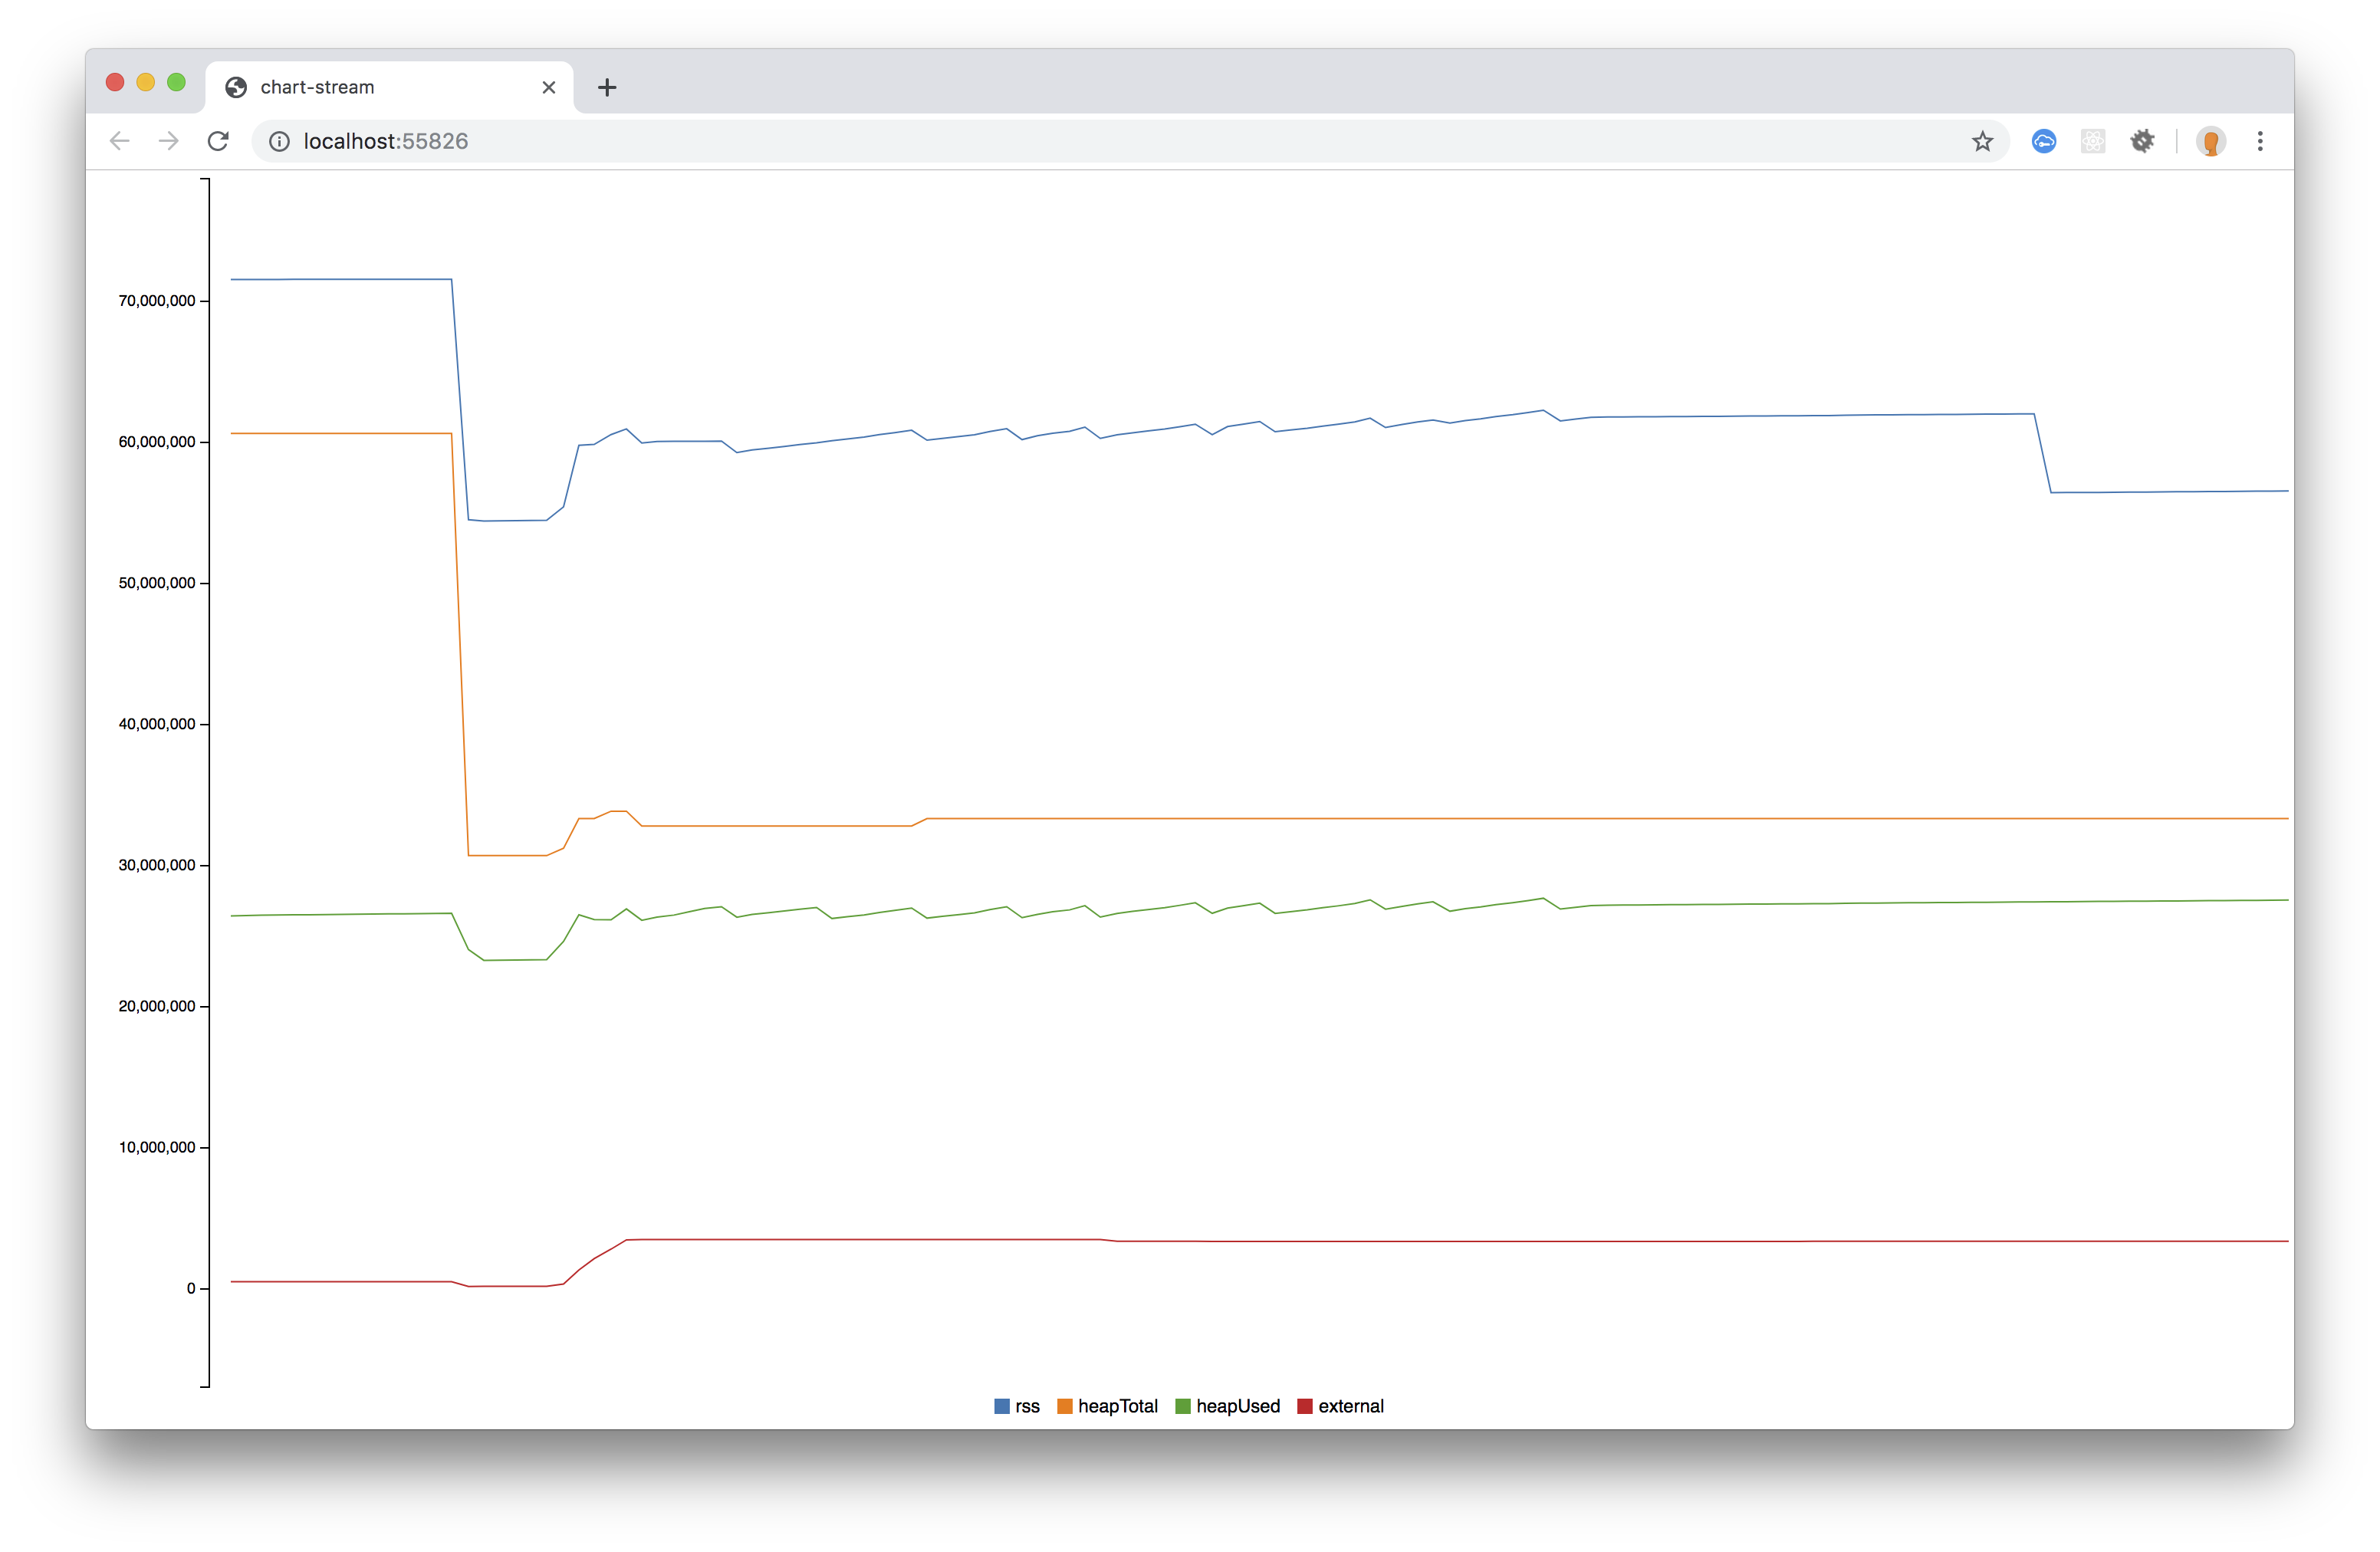
It still seems that master is not managing memory as efficiently as v2.1.0 😞
ivancevich
on 8 May 2019
I could be missing what you're seeing, so absolutely correct me if I'm missing something, but it looks relatively similar. It seems like we're looking at:
2.1.0
Initial: 72
Drop off (after stream is done, presumably?): 54
Exit: 55
master
Initial: 67
Drop off: 53
Exit: 54
The memory climb that starts after the "Drop off" (the bottom of the first slope) seems like it could be from the other dependencies' tasks that fire off. But those are eventually drained as well.
Using the extra dependencies introduce many other factors which could affect the memory usage as well. And in my experience debugging memory usage, there's quite a bit of unexplained anomaly tolerance needed, that will always throw the results out of wack.
If you think more investigation is necessary (no problem), could you try running at least 10 times and seeing how true those runs stay to these graphs?
stephenplusplus
on 8 May 2019
@stephenplusplus, sorry I wasn't clear in my previous message. I've added 3 phases to the graphs:
master:
v2.1.0:
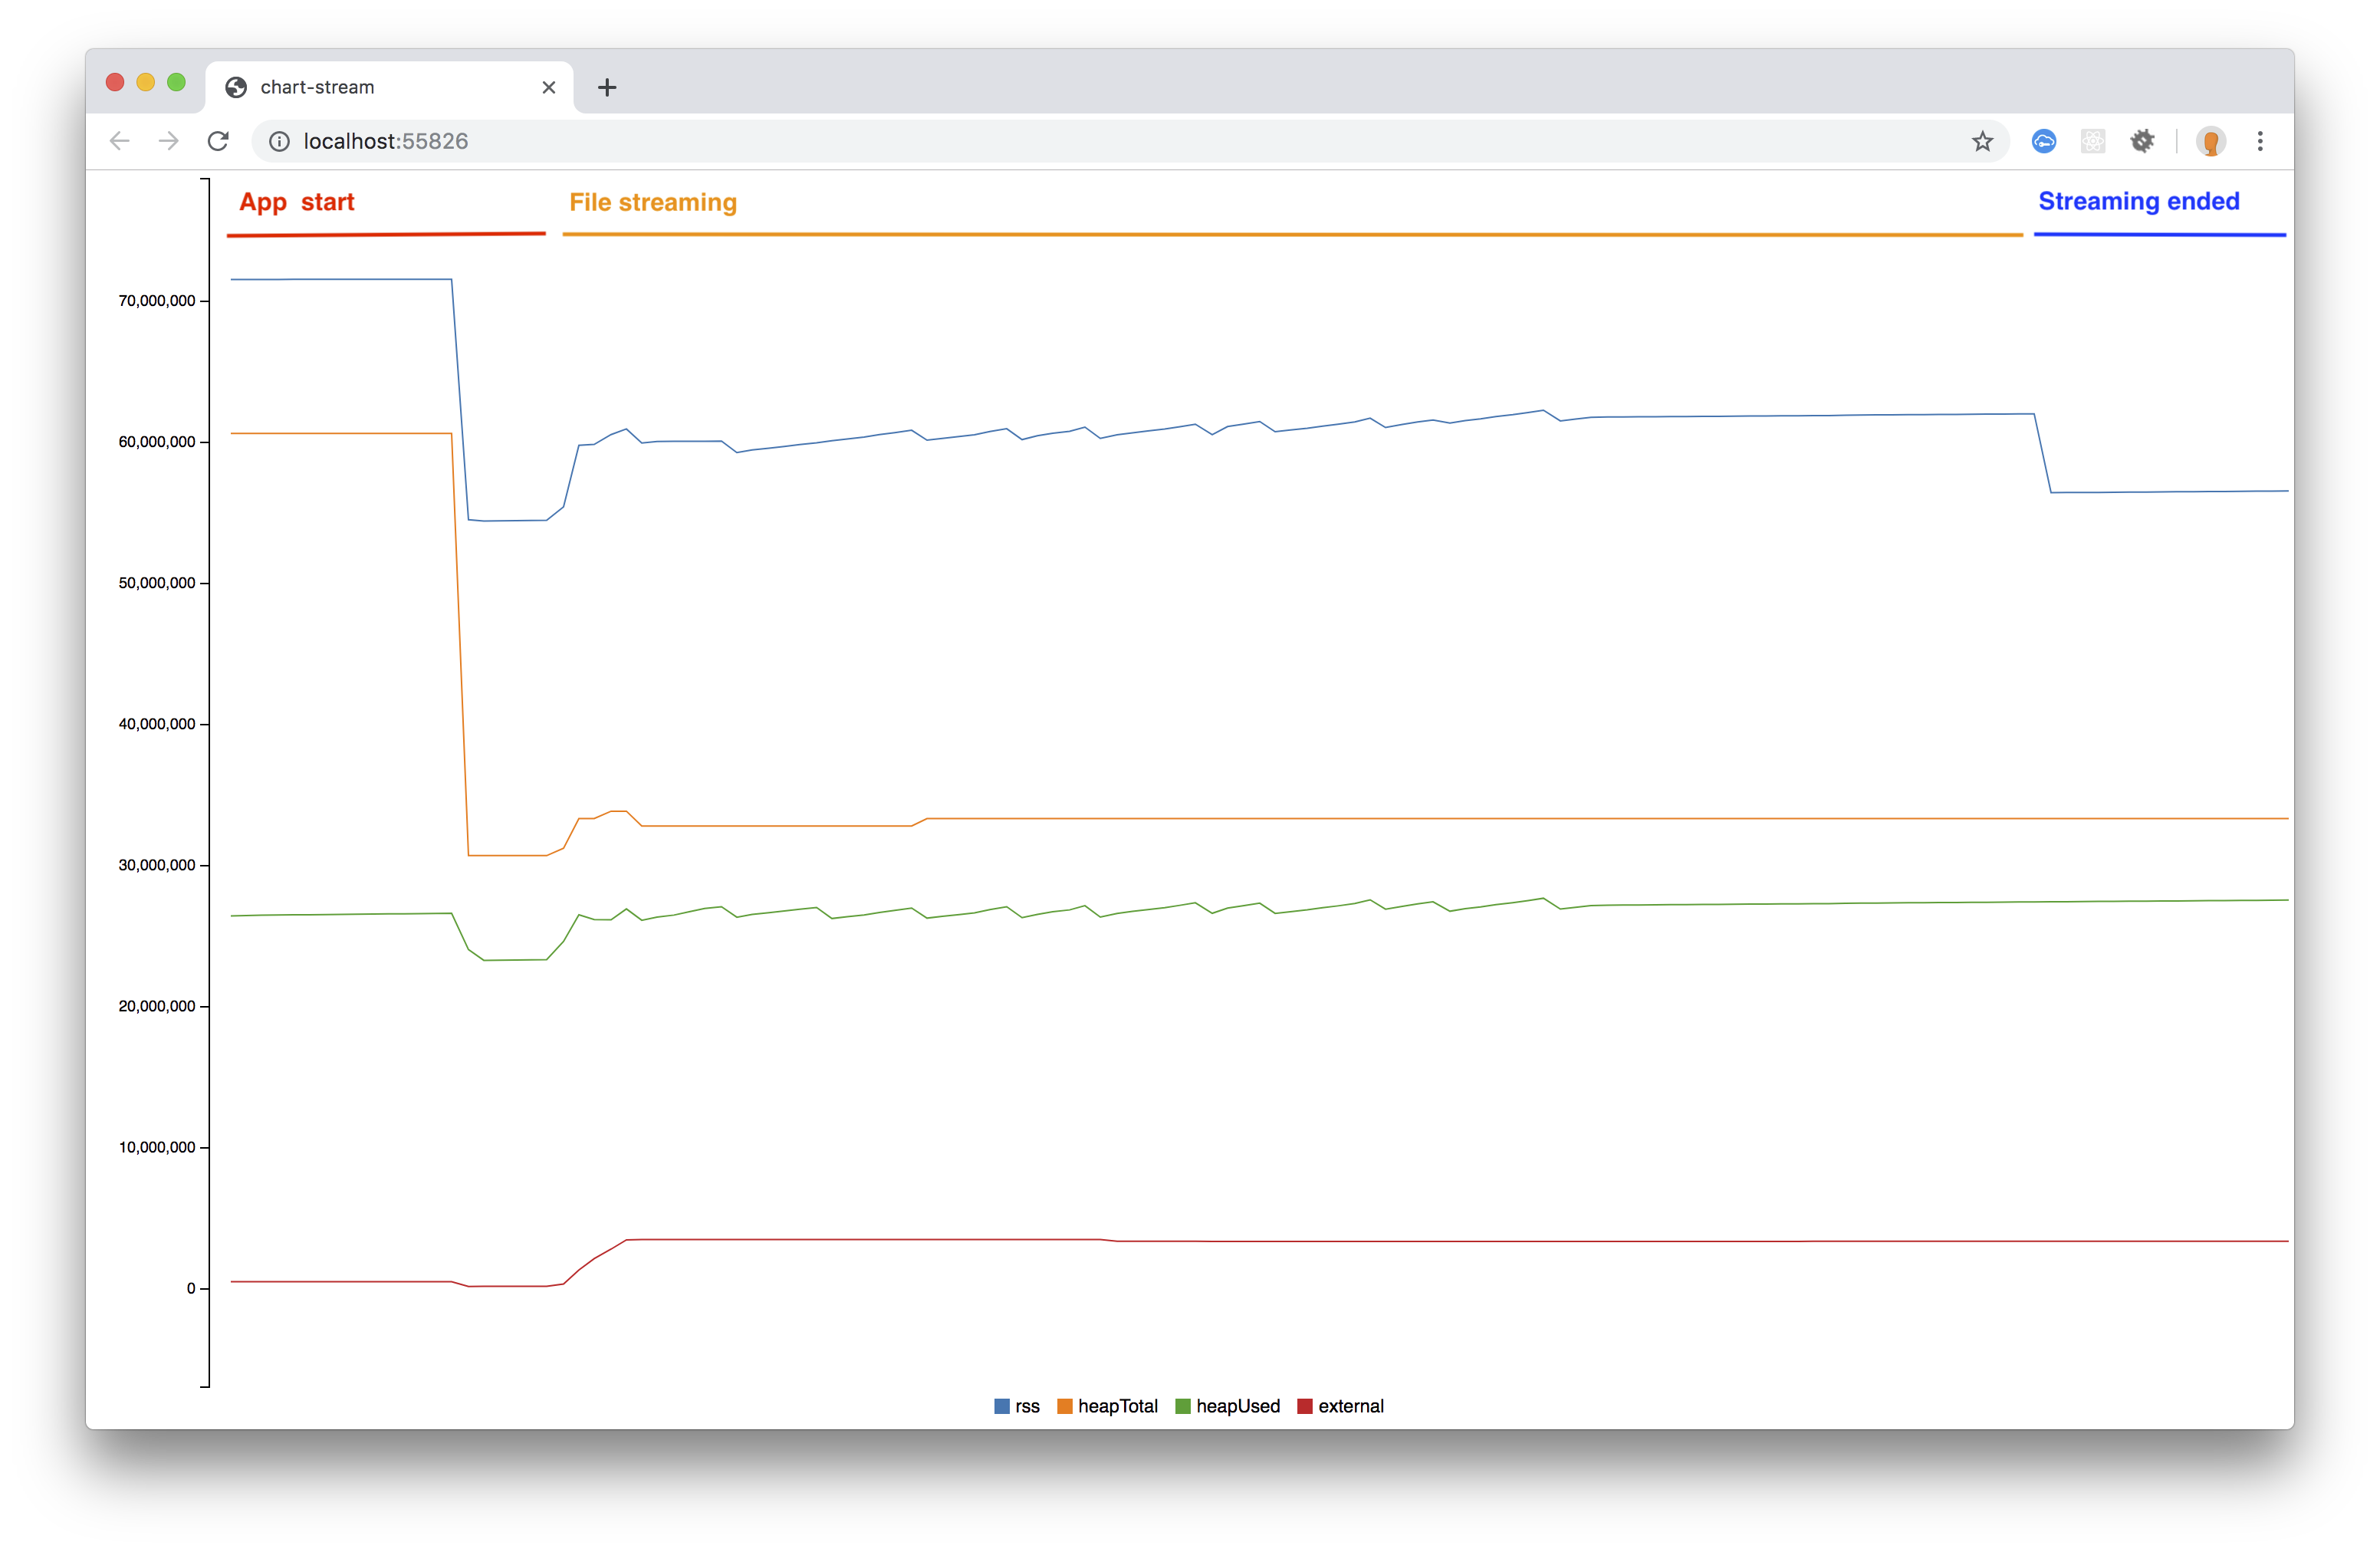
I think memory management is good in the "App start" and "Streaming ended" phases using master. Though, memory management is not that good using master in the "File streaming" phase. Notice how v2.1.0 keep memory usage mostly linear in that phase, while master's memory usage keeps climbing.
ivancevich
on 8 May 2019
Thanks for that info. Since there are other dependencies involved in that scenario, can you share the repro code you're running?
stephenplusplus
on 13 May 2019
@stephenplusplus, I've shared that code in the initial issue description: https://github.com/googleapis/nodejs-storage/issues/685#issue-439278721
I've also listed all the dependencies I'm using in this comment: https://github.com/googleapis/nodejs-storage/issues/685#issuecomment-488741094
Let me know if there's anything else you might need.
ivancevich
on 13 May 2019
Could it be expanded? For example, throttle isn't defined, and the boilerplate necessary to handle and respond to the HTTP request. We should be able to run the same thing, so we can observe (then hopefully correct) the same results.
stephenplusplus
on 13 May 2019
Sure. Here's the complete implementation:
const { Storage } = require("@google-cloud/storage");
const Throttle = require("throttle");
const express = require("express");
const app = express();
const storage = new Storage({ projectId: "{PROJECT_ID}" });
const bucket = storage.bucket("{BUCKET_NAME}");
app.get("/", async (req, res) => {
const { filename } = req.query;
const throttle = new Throttle(24 * 1024);
const file = bucket.file(filename);
const data = await file.getMetadata();
const fileSize = data[0].size;
const start = 0;
const end = fileSize - 1;
res.status(200);
res.set({
"Content-Length": fileSize,
"Content-Range": `${start}-${end}/${fileSize}`,
"Accept-Ranges": "bytes",
Connection: "Keep-Alive",
"Keep-Alive": "timeout=2, max=100",
"Content-Type": "audio/mp3",
"X-Accel-Buffering": "no"
});
file
.createReadStream({ start, end })
.on("error", err => {
console.error("Error reading file stream", err);
})
.pipe(throttle)
.pipe(res);
});
const server = app.listen(process.env.PORT || 3000, () =>
console.info(`Server running on port ${server.address().port}`)
);
You should call it with GET http://localhost:3000/?filename={FILE_NAME}.mp3 (you need to stream an MP3 file - I use 128kbps MP3's)
I hope this helps!
ivancevich
on 13 May 2019
We're also seeing leaking issues, but they seem to be related to network sockets. Could these memory issues be the same underlying issue? We're also using ranges (start, end).
It appears that network sockets are not being closed properly, leading to a growing amount of TCP connections. Netstat reveals that the connections are open against subdomains of 1e100.net:443 - I assume these are google cloud storage hosts.
Of interest is that we're using the end-of-stream module (through pump), and seeing sporadic premature close errors being emitted from this module. The number of tcp sockets that are leaking seems to correlate with the number of premature close errors in the logs.
 rexxars
on 29 Jul 2019
rexxars
on 29 Jul 2019
@stephenplusplus - I've tested v3 and I ran into memory issues as well. I had to roll it back to v2.1. Do you have any news about this?
ivancevich
on 19 Aug 2019
@ivancevich sorry for the delay. I'm running the test again-- could you teach me how you labeled the sections from the graph into App start, File streaming, etc?
stephenplusplus
on 23 Aug 2019
Hi @stephenplusplus - sure:
App start: the Node.js application starts and no HTTP calls have happened (Aka: no streaming from GCS)File streaming: an HTTP call happens triggering the Express endpoint that streams a file from GCS to the HTTP response.Streaming ended: the file has been fully streamed to the HTTP client (web browser).
Makes sense?
ivancevich
on 23 Aug 2019
Thank you. I meant, how did you label the graph, so that my graph is sectioned following the same timing events from the script?
stephenplusplus
on 23 Aug 2019
I labeled it manually using Preview for Mac. AFAIK, there's no way to do it automatically.
ivancevich
on 23 Aug 2019
Woops, my bad. Those margins looked perfect, it fooled me. 🤦
stephenplusplus
on 23 Aug 2019
I did a rewrite of the script to remove Express and the browser integration for the memory UI. I can reproduce what looks like memory retention when using master (internal request library: fetch via teeny-request), and see it disappear when using 2.1.0 (internal request library: request). Setting the range doesn't have an effect.
I tested again with a larger file (100 MB), and memory management is different, however, neither retain beyond +5MB from the starting position.
Theories so far:
- Node stream internals make different memory retention judgements based on demand
- node-throttle is bringing to light that something is wrong with backpressure in some internal stream from the request library
More testing needed.
{
  "name": "gissue-685",
  "version": "1.0.0",
  "description": "",
  "main": "index.js",
  "scripts": {
    "test": "node --expose-gc ."
  },
  "keywords": [],
  "author": "",
  "license": "ISC",
  "dependencies": {
    "@google-cloud/storage": "github:googleapis/nodejs-storage",
    "throttle": "^1.0.3"
  }
}
```js
'use strict'
const fs = require('fs')
const {Storage} = require('@google-cloud/storage')
const Throttle = require('throttle')
const BASE_MEMORY = getMemory()
const storage = new Storage()
const bucket = storage.bucket('gcp-public-data-landsat')
const file = bucket.file('index.csv.gz')
file
.createReadStream({end: 1e+8}) // 100 MB
.pipe(new Throttle(24 * 1024))
.on('data', () => {})
.on('end', () => {
console.log('Ended')
setTimeout(() => {
process.exit()
}, 1000)
})
function getMemory() {
return Math.round(process.memoryUsage().heapUsed / 1000000)
}
function logMemoryUsage() {
console.log('Memory usage:', getMemory() - BASE_MEMORY + ' mb')
}
setInterval(logMemoryUsage, 1000)
```sh
$ npm t
Using Throttle(value: 24 * 1024) there is not much difference in memory footprint. (Version : 3.2.1).
Here I have taken few stats on download start and end.
Values are in MB.
1.
  - On start
    RSS : 43.74609375
    heapTotal : 20.234375
    heapUsed : 12.348419189453125
    external : 0.35553932189941406
  - On END
    RSS : 51.25
    heapTotal : 18.734375
    heapUsed : 11.835227966308594
    external : 1.628340721130371

2.
  - On start
    RSS : 43.76953125
    heapTotal : 20.234375
    heapUsed : 12.348419189453125
    external : 0.35553932189941406
  - On END
    RSS : 52.3203125
    heapTotal : 18.734375
    heapUsed : 11.03411865234375
    external : 0.5034189224243164

3.
  - On start
    RSS : 43.71875
    heapTotal : 20.234375
    heapUsed : 12.348419189453125
    external : 0.35553932189941406
  - On END
    RSS : 51.796875
    heapTotal : 16.734375
    heapUsed : 10.950653076171875
    external : 0.8035192489624023
For version 2.1
1.
 - On start
    RSS : 48.8125
    heapTotal : 31.74609375
    heapUsed : 15.485603332519531
    external : 0.2525978088378906
  - On END
    RSS : 51.609375
    heapTotal : 19.74609375
    heapUsed : 13.874748229980469
    external : 0.5450782775878906

2.
 - On start
    RSS : 49.64453125
    heapTotal : 32.24609375
    heapUsed : 15.503036499023438
    external : 0.2525978088378906
 - On END
    RSS : 50.9296875
    heapTotal : 19.74609375
    heapUsed : 13.257049560546875
    external : 0.10494804382324219

3.
  - On start
    RSS : 49.08203125
    heapTotal : 31.74609375
    heapUsed : 15.485603332519531
    external : 0.2525978088378906
  - On end
    RSS : 51.97265625
    heapTotal : 18.74609375
    heapUsed : 14.026435852050781
    external : 1.3113641738891602
One thing I have found that if there is large Throttle value or without Throttle RSS memory not being released.
 jiren
on 26 Sep 2019
jiren
on 26 Sep 2019
Hi Folks,
we also found a memory issue with the BigQuery client library.
The issue seems to be related to teeny-request, maybe there is some kind of correlation?
https://github.com/googleapis/nodejs-bigquery/issues/547
Best regards
Sascha
 SaschaHeyer
on 30 Sep 2019
SaschaHeyer
on 30 Sep 2019
@callmehiphop could this also be related to connection pooling?
 bcoe
on 30 Sep 2019
bcoe
on 30 Sep 2019
@bcoe it is very likely
 callmehiphop
on 7 Oct 2019
callmehiphop
on 7 Oct 2019
@ivancevich I'll give an update from where I'm standing looking at this issue, and let me know where I might be off. After the testing I've shared, along with @jiren's report, it seems that it's possible to produce situations where memory is retained for a longer period of time, but not indefinitely. The memory never goes beyond a reasonable amount of ~2-5 MB. When memory is gc'd is not something we control, but all signs are pointing to it successfully being called. Given that assurance, I don't feel it's necessary to dig deeper, requiring dissection of Node or Throttle's internals.
stephenplusplus
on 22 Oct 2019
I'm going to close for now. I'm happy to re-open if there's more we should do.
stephenplusplus
on 28 Oct 2019
Related issues
 fspoettel
·
6Comments
fspoettel
·
6Comments
 KKHAN1991
·
3Comments
KKHAN1991
·
3Comments
 hstemplewski
·
4Comments
hstemplewski
·
4Comments
 munkhorgil
·
3Comments
munkhorgil
·
3Comments
 lukesneeringer
·
4Comments
lukesneeringer
·
4Comments
Most helpful comment
I did a rewrite of the script to remove Express and the browser integration for the memory UI. I can reproduce what looks like memory retention when using master (internal request library: fetch via teeny-request), and see it disappear when using 2.1.0 (internal request library: request). Setting the range doesn't have an effect.
I tested again with a larger file (100 MB), and memory management is different, however, neither retain beyond +5MB from the starting position.
Theories so far:
More testing needed.
```js
'use strict'
const fs = require('fs')
const {Storage} = require('@google-cloud/storage')
const Throttle = require('throttle')
const BASE_MEMORY = getMemory()
const storage = new Storage()
const bucket = storage.bucket('gcp-public-data-landsat')
const file = bucket.file('index.csv.gz')
file
.createReadStream({end: 1e+8}) // 100 MB
.pipe(new Throttle(24 * 1024))
.on('data', () => {})
.on('end', () => {
console.log('Ended')
setTimeout(() => {
process.exit()
}, 1000)
})
function getMemory() {
return Math.round(process.memoryUsage().heapUsed / 1000000)
}
function logMemoryUsage() {
console.log('Memory usage:', getMemory() - BASE_MEMORY + ' mb')
}
setInterval(logMemoryUsage, 1000)