Node: Significantly larger event loop latency & event loop usage in Node 10 vs Node 8
- Version: 10.15.1
- Platform: Heroku-18
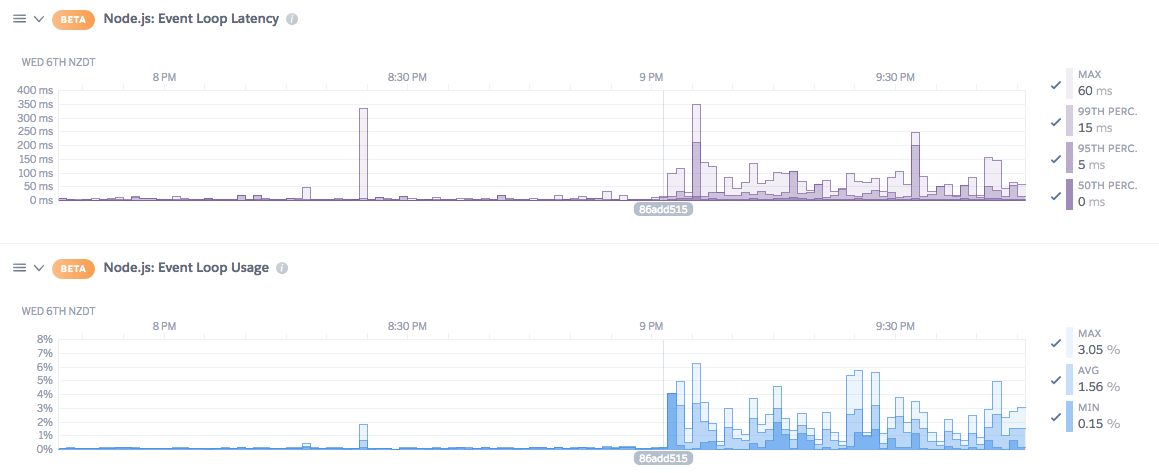
After upgrading our Heroku application from to Node 10 we noticed a significantly increased event loop usage in our app being reported compared to Node 8. You can see the commit which released the new build and then the drastic increase:
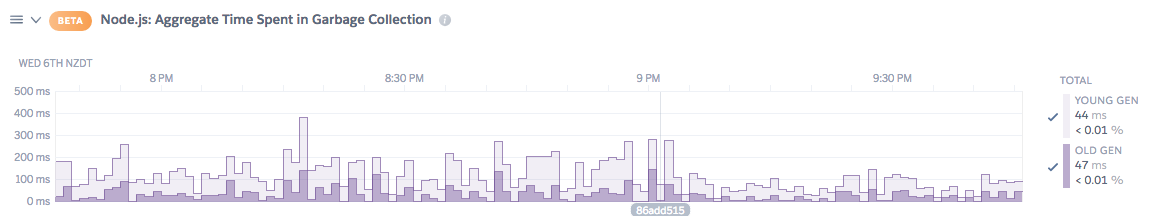
Time spent in garbage collection seems less though:
Memory usage, response time and throughput remained roughly the same.
Is this increased event loop latency something we should be worried about? Why would it increase so drastically? I was under the impression that Node 10 came with performance improvements over Node 8?
What worries me are not so much the absolute amounts, but the fact that the event loop usage increased by roughly 10x.
Any insight would be much appreciated.
 adamreisnz
All 8 comments
How are you measuring "Event Loop latency"? I have not observed that Node 10 uses more. _(I am measuring this using N|Solid, for which I helped write the event loop stats functionality.)_
If anything it looks like you event loop metrics just started functioning correctly. How much traffic is this service getting?
 Fishrock123
on 7 Feb 2019
Fishrock123
on 7 Feb 2019
Hi @Fishrock123, I am not measuring this myself, it's an official Heroku add-on to measure language metrics. See this article for more information:
https://devcenter.heroku.com/articles/language-runtime-metrics-nodejs#event-loop-latency
If you think the event loop stats were measured incorrectly before, it would be good to get some feedback from the Heroku developers on that. At first glance it looked to me like it was measuring it fine, it just looks very low because the chart scale had to be push up to allow for the new, higher values after the deployment with Node 10.
The service at current peak times is getting about 2-3 requests per second:

adamreisnz
on 7 Feb 2019
Source code is there https://github.com/heroku/heroku-nodejs-plugin/blob/master/src/nativeStats.cc#L107
 vmarchaud
on 9 Feb 2019
vmarchaud
on 9 Feb 2019
I'm seeing this too, @adamreisnz have you come up with any insights why this is happening?
Previously I was on node 8.12 and the node event loop usage was around 2% average now suddenly spikes to 70% with 20% average
 pedrocarrico
on 12 Jun 2019
pedrocarrico
on 12 Jun 2019
@pedrocarrico not really no. My guess is that maybe Node 8 was underreporting it, or incorrectly reporting it, and that Node 10 figures are closer to actual values.
In the end our app has been running stable on Node 10, so I am not too concerned yet, but we'll definitely look closer at optimising some of the processes to try and bring those figures down a bit.
Currently we're averaging about 5-6% at peak times, with spikes to 20%, so not as bad as what you're seeing it seems.
adamreisnz
on 13 Jun 2019
just for debugging purpose, does it make sense to push a tuple [handle type, duration] into the array? that way we can isolate it to an extent - whether these are manifestation of some handle types taking longer time, or something else. type detection can be done using uv_guess_handle
 gireeshpunathil
on 6 Jan 2020
gireeshpunathil
on 6 Jan 2020
There's been no further activity on this. Does it need to remain open?
 jasnell
on 19 Jun 2020
jasnell
on 19 Jun 2020
Probably not
adamreisnz
on 20 Jun 2020
Related issues
 filipesilvaa
·
3Comments
filipesilvaa
·
3Comments
 willnwhite
·
3Comments
willnwhite
·
3Comments
 stevenvachon
·
3Comments
stevenvachon
·
3Comments
 loretoparisi
·
3Comments
loretoparisi
·
3Comments
 cong88
·
3Comments
cong88
·
3Comments
Most helpful comment
@pedrocarrico not really no. My guess is that maybe Node 8 was underreporting it, or incorrectly reporting it, and that Node 10 figures are closer to actual values.
In the end our app has been running stable on Node 10, so I am not too concerned yet, but we'll definitely look closer at optimising some of the processes to try and bring those figures down a bit.
Currently we're averaging about 5-6% at peak times, with spikes to 20%, so not as bad as what you're seeing it seems.