# node --version
v10.15.0
# uname -a
Linux 33a6f53b4e97 4.9.125-linuxkit #1 SMP Fri Sep 7 08:20:28 UTC 2018 x86_64 Linux
We updated to Node 10 at the beginning of January and since then there has been a steady growth in memory usage on all of our Node processes. It appears that this is something in Node itself. I'm not sure the below snippet is correctly representing the problem because this also shows similar growth in Node 8 and Node 10 (and we only see the issue in our running system with Node 10). Any recommendations on how to diagnose this problem would be great ( see https://github.com/expressjs/express/issues/3871 ).
Here's the code I used to try and isolate the issue (for Node 8 I used memwatch-next):
'use strict';

const http = require('http');
const memwatch = require('node-memwatch');

let hd = new memwatch.HeapDiff();
let count = 0;
const totals = {};

(() => {
    const server = http.createServer();

    server.on('request', (req, res) => {
        const hd2 = new memwatch.HeapDiff();
        const diff = hd.end();
        hd = hd2;
        count += 1;
        if (count > 10) {
            diff.change.details.forEach(detail => {
                const delta = detail['+'] - detail['-'];
                if (delta !== 0) {
                    if (detail.what in totals) {
                        totals[detail.what] += delta;
                    } else {
                        totals[detail.what] = delta;
                    }
                    if (delta > 0 && totals[detail.what] > 1) {
                        console.log(`${count},${detail.what},${delta},${totals[detail.what]}`);
                    }
                }
            });
        }

        res.end('Memory Test');
    });

    const port = process.env.SERVER_PORT || 3001;
    const listener = server.listen(port);
    console.log(`Memory test listening on port ${port}.`);

    return listener;
})();
 daveisfera
All 12 comments
Have you used node-heapdump or the inspector's heap inspector to compare snapshots? That might give a clue.
I'm a bit distrustful of memwatch because it had huge bugs in the past. Or is that actually memwatch-next?
 bnoordhuis
on 5 Feb 2019
bnoordhuis
on 5 Feb 2019
They're forks of each other with one working with Node 8 and the other for
Node 10.
We've confirmed the memory growth with Chrome Dev Tools and New Relic, so I
was hoping to have something automated to do the monitoring/detection and
that's why I tried memwatch. Are there other options for having it built
into the test?
daveisfera
on 5 Feb 2019
The testing and diff improved based on feedback from the issue that I opened with express and that indicated that the minimal reproducer may not be actually reproducing the issue we're seeing. So I went back to our application and ran the improved diff and it outputs this as the increase in the heap usage:
Array,2,268
Closure,3,294
Object,1,98
String,5,498
system / Context,1,98
What is system / Context? Could it be holding onto the rest of those object? Or could it be a Closure that's holding onto the rest of them?
daveisfera
on 5 Feb 2019
A context contains the closure's free variables. So yes, it's the closure that's holding onto the context.
bnoordhuis
on 6 Feb 2019
I've been able to narrow it down to express-session or our use of it. I'll see if I can make update this reproducer with that.
daveisfera
on 6 Feb 2019
Any chance you're using the the built in memory store? If you set NODE_ENV=production, does it log a warning?
 cjihrig
on 6 Feb 2019
cjihrig
on 6 Feb 2019
I assume that you're referring to the fact that the built in memory store holds onto sessions. We're using redis as a store through connect-redis so it shouldn't be that issue.
daveisfera
on 6 Feb 2019
Another module that is sometimes helpful in figuring out who (rather than what) is leaking is https://www.npmjs.com/package/heap-profile (/shameless plug)
 ofrobots
on 14 Feb 2019
ofrobots
on 14 Feb 2019
(Also changed from require to import syntax using node -r esm. but unsure if this leads to higher ram usage)
 valoricDe
on 18 Sep 2019
valoricDe
on 18 Sep 2019
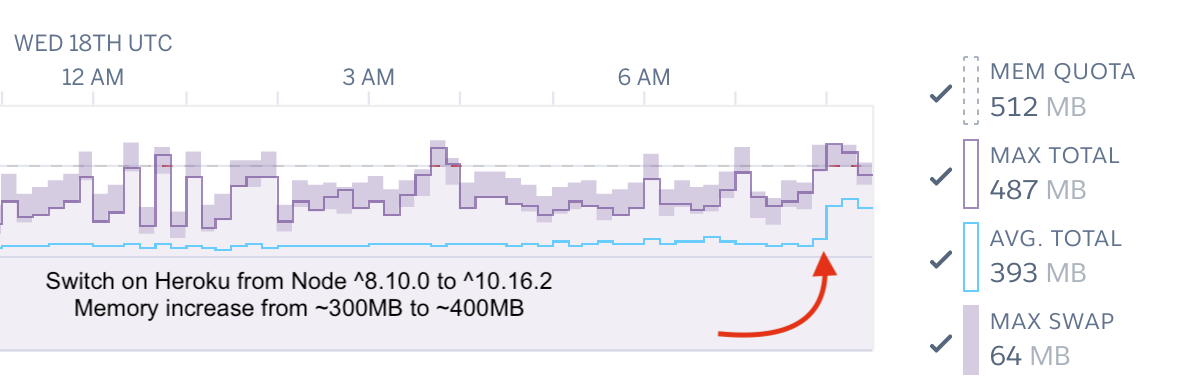
Some update: I changed to node version 12.x and the average memory usage was like:
v8.10.0: ~300MB
v10.16.2: ~420MB
v12.x: ~340MB
(Update: It was highly related to using esm, I use babel now instead)
valoricDe
on 18 Sep 2019
@valoricDe the memory usage being different with different versions of node is expected. Each version will have different optimizations/JIT/caches/etc and that will make the memory usage different. This issue is about growing memory usage over time.
daveisfera
on 18 Sep 2019
Oh, true.
valoricDe
on 19 Sep 2019
Related issues
 willnwhite
·
3Comments
willnwhite
·
3Comments
 vsemozhetbyt
·
3Comments
vsemozhetbyt
·
3Comments
 mcollina
·
3Comments
mcollina
·
3Comments
 sandeepks1
·
3Comments
sandeepks1
·
3Comments
 dfahlander
·
3Comments
dfahlander
·
3Comments
Most helpful comment
@valoricDe the memory usage being different with different versions of node is expected. Each version will have different optimizations/JIT/caches/etc and that will make the memory usage different. This issue is about growing memory usage over time.