Node: Windows CI failures: parallel/test-trace-events-fs-sync
Seeing 3221225477 (access violation) non-stop on win10 + vs2017 on CI in a trace_events test:
00:19:43 not ok 494 parallel/test-trace-events-fs-sync
00:19:43   ---
00:19:43   duration_ms: 0.781
00:19:43   severity: fail
00:19:43   exitcode: 1
00:19:43   stack: |-
00:19:43     c:\workspace\node-test-binary-windows\test\parallel\test-trace-events-fs-sync.js:140
00:19:43         throw new Error(`${tr}:\n${util.inspect(proc)}`);
00:19:43         ^
00:19:43
00:19:43     Error: fs.sync.fchmod:
00:19:43     { status: 3221225477,
00:19:43       signal: null,
00:19:43       output: [ null, '', '' ],
00:19:43       pid: 3272,
00:19:43       stdout: '',
00:19:43       stderr: '' }
00:19:43         at Object.<anonymous> (c:\workspace\node-test-binary-windows\test\parallel\test-trace-events-fs-sync.js:140:11)
00:19:43         at Module._compile (internal/modules/cjs/loader.js:722:30)
00:19:43         at Object.Module._extensions..js (internal/modules/cjs/loader.js:733:10)
00:19:43         at Module.load (internal/modules/cjs/loader.js:621:32)
00:19:43         at tryModuleLoad (internal/modules/cjs/loader.js:564:12)
00:19:43         at Function.Module._load (internal/modules/cjs/loader.js:556:3)
00:19:43         at Function.Module.runMain (internal/modules/cjs/loader.js:775:12)
00:19:43         at executeUserCode (internal/bootstrap/node.js:433:15)
00:19:43         at startExecution (internal/bootstrap/node.js:370:3)
00:19:43   ...
Examples:
https://ci.nodejs.org/job/node-test-binary-windows/23086/COMPILED_BY=vs2017,RUNNER=win10,RUN_SUBSET=0/console
https://ci.nodejs.org/job/node-test-binary-windows/23085/COMPILED_BY=vs2017,RUNNER=win10,RUN_SUBSET=0/
https://ci.nodejs.org/job/node-test-binary-windows/23084/COMPILED_BY=vs2017,RUNNER=win10,RUN_SUBSET=0/
...and many others...started happening in the last 24 hours or so. Not sure if something changed in our code or if something changed on CI or what. First noted (to my knowledge) by @gireeshpunathil in https://github.com/nodejs/node/pull/22712#issuecomment-453897949 and https://github.com/nodejs/node/issues/22865#issuecomment-453914513.
That was rebased onto 7f913293c1ac50b01dfc775fe4861f362bcf624a. So if the problem is in our code (and not something that is only being surfaced now but has been there for a while or else something that is a problem with the CI host and not a problem with the test or code), then it would be either in that commit or one shortly before it.
@nodejs/trace-events
[refack]Added context - the above 3 fails are on 3 different workers. AFAICT all failures are similar and happen while testing fchmod
Test call site: https://github.com/nodejs/node/blob/master/test/parallel/test-trace-events-fs-sync.js#L122
and setup site: https://github.com/nodejs/node/blob/master/test/parallel/test-trace-events-fs-sync.js#L33-L36
where this test case is six deep.
 Trott
Trott
All 46 comments
Is 4da7e6e228766454912a4de5dc6f037da8223e53 a candidate? That would be 6 hours before 7f91329, but as I said in the PR, I was a bit scared of how wide-reaching that change may be…
 addaleax
on 15 Jan 2019
addaleax
on 15 Jan 2019
@addaleax - it is not. I am able to recreate the issue with and without the said commit. My challenge is that I am unable to get userdump in my system (for some unknown reason, it is not producing one)
 gireeshpunathil
on 15 Jan 2019
gireeshpunathil
on 15 Jan 2019
Happy to report that it's now only happening frequently in CI, and not non-stop. 😅
Trott
on 15 Jan 2019
So 3221225477 is 0xC0000005 or STATUS_ACCESS_VIOLATION and it's a PITA to figure out the exact cause of... But since we're seeing on Win10 and WRT to FS access, my first guess is it's related to either the builtin Windows content index service, or the builtin anti-virus.
 refack
on 15 Jan 2019
refack
on 15 Jan 2019
@refack - do you have guidance on how to enable userdump on win 10? I referred and followed several online docs, but none of those actually helped, a dump is never produced on 0xC...5 or I am not seeing it. thanks!
gireeshpunathil
on 15 Jan 2019
semi-bisect: testing commit 92e95f17b64838d4cf77343c1a814d4ebd795217 which is the parent of 4da7e6e228766454912a4de5dc6f037da8223e53
@gireeshpunathil best experience I had was with enabling silent-exit-dumps https://github.com/nodejs/node/pull/13947#issuecomment-312231068
refack
on 15 Jan 2019
Few data points:
- I can repro (~1% of runs) but I can't get a core dump or an event logged.
- Can repro with a limited test replacing https://github.com/nodejs/node/blob/0759cbfc775dc3a621c40e077b13a2f898ef9c04/test/parallel/test-trace-events-fs-sync.js#L121
withfor (const tr in {'fs.sync.readdir':1}) { - I'm thinking the severity peek might have been a transient thing. Did not happen spontaneously for 7 hours - https://ci.nodejs.org/job/node-test-binary-windows/COMPILED_BY=vs2017,RUNNER=win10,RUN_SUBSET=0/buildTimeTrend

refack
on 16 Jan 2019
Some data points from https://github.com/nodejs/reliability/issues/20
| Reason | parallel/test-trace-events-fs-sync |
| - | :- |
| Type | JS_TEST_FAILURE |
| Failed PR | 15 (https://github.com/nodejs/node/pull/25412/, https://github.com/nodejs/node/pull/25447/, https://github.com/nodejs/node/pull/25441/, https://github.com/nodejs/node/pull/25429/, https://github.com/nodejs/node/pull/25443/, https://github.com/nodejs/node/pull/25480/, https://github.com/nodejs/node/pull/22712/, https://github.com/nodejs/node/pull/25415/, https://github.com/nodejs/node/pull/25364/, https://github.com/nodejs/node/pull/25481/, https://github.com/nodejs/node/pull/25084/, https://github.com/nodejs/node/pull/25503/, https://github.com/nodejs/node/pull/25473/, https://github.com/nodejs/node/pull/25455/, https://github.com/nodejs/node/pull/23100/) |
| Appeared | test-azure_msft-win10-x64-3, test-azure_msft-win10-x64-2, test-azure_msft-win10-x64-4 |
| First CI | https://ci.nodejs.org/job/node-test-pull-request/20058/ |
| Last CI | https://ci.nodejs.org/job/node-test-pull-request/20142/ |
not ok 494 parallel/test-trace-events-fs-sync
---
duration_ms: 0.794
severity: fail
exitcode: 1
stack: |-
c:\workspace\node-test-binary-windows\test\parallel\test-trace-events-fs-sync.js:140
throw new Error(`${tr}:\n${util.inspect(proc)}`);
^
Error: fs.sync.fchmod:
{ status: 3221225477,
signal: null,
output: [ null, '', '' ],
pid: 1756,
stdout: '',
stderr: '' }
at Object.<anonymous> (c:\workspace\node-test-binary-windows\test\parallel\test-trace-events-fs-sync.js:140:11)
at Module._compile (internal/modules/cjs/loader.js:722:30)
at Object.Module._extensions..js (internal/modules/cjs/loader.js:733:10)
at Module.load (internal/modules/cjs/loader.js:621:32)
at tryModuleLoad (internal/modules/cjs/loader.js:564:12)
at Function.Module._load (internal/modules/cjs/loader.js:556:3)
at Function.Module.runMain (internal/modules/cjs/loader.js:775:12)
at executeUserCode (internal/bootstr...
 joyeecheung
on 16 Jan 2019
joyeecheung
on 16 Jan 2019
at this point the effort is to get a dump; recreate seem to be easy. this fails only in windows, and we don't have a single dump to see what was the sate of the child process when it caused access violation.
gireeshpunathil
on 16 Jan 2019
I made a minimal code that potentially recreate the same thing, and I got this:
Assertion failed: 0, file d:\gireesh\node\deps\uv\src\win\handle-inl.h, line 160 repeatedly.
However, user dump is not there to figure out the context. Either gflags are not working for me, or it is not configured appropriately.
So, we are on the exit path for sure, but then a bad handle came on our way. Could it be that it is already destroyed?
gireeshpunathil
on 16 Jan 2019
ok, modified the code to honor abort on exceptions, and got these info from the VS debugger (data copied from its UI frames, so not very much readable)
message:
Unhandled exception at 0x00007FF718B87B39 in node.exe: Fatal program exit requested.
call stack:
node.exe!abort() Line 77 C++
node.exe!common_assert_to_stderr<wchar_t>(const wchar_t * const expression, const wchar_t * const file_name, const unsigned int line_number) Line 186 C++
node.exe!_wassert(const wchar_t * expression, const wchar_t * file_name, unsigned int line_number) Line 443 C++
> node.exe!uv_run(uv_loop_s * loop, <unnamed-enum-UV_RUN_DEFAULT> mode) Line 534 C
node.exe!uv__thread_start(void * arg) Line 104 C
node.exe!thread_start<unsigned int (__cdecl*)(void * __ptr64)>(void * const parameter) Line 115 C++
verifier.dll!00007ff93419507d() Unknown
kernel32.dll!00007ff94de88102() Unknown
ntdll.dll!00007ff94f56c5b4() Unknown
loop content around endgame_handles:
- loop 0x000001fa8540d508 {data=0xe0e0e0e0e0e0e0e0 active_handles=1 handle_queue=0x000001fa8540d518 {0x000001fa8540d618, ...} ...} uv_loop_s *
data 0xe0e0e0e0e0e0e0e0 void *
active_handles 1 unsigned int
+ handle_queue 0x000001fa8540d518 {0x000001fa8540d618, 0x000001fa854114b0} void *[2]
+ active_reqs {unused=0x000001fa8540d528 {0xe0e0e0e000000000, 0xe0e0e0e0e0e0e0e0} count=0 } <anonymous-tag>
stop_flag 0 unsigned int
iocp 0x00000000000002f8 void *
time 21888192669 unsigned __int64
+ pending_reqs_tail 0x0000000000000000 {data=??? type=??? reserved=0x0000000000000010 {???, ???, ???, ???, ???, ???} ...} uv_req_s *
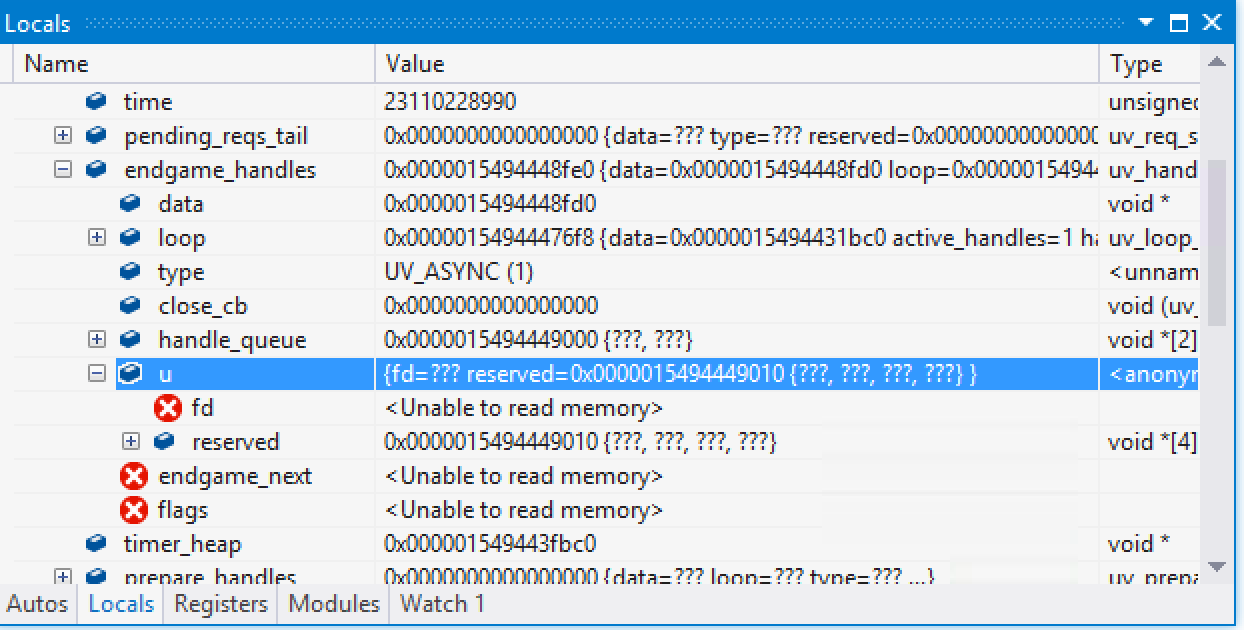
- endgame_handles 0xf0f0f0f0f0f0f0f0 {data=??? loop=??? type=??? ...} uv_handle_s *
data <Unable to read memory>
loop <Unable to read memory>
type <Unable to read memory>
close_cb <Unable to read memory>
+ handle_queue 0xf0f0f0f0f0f0f110 {???, ???} void *[2]
+ u {fd=??? reserved=0xf0f0f0f0f0f0f120 {???, ???, ???, ???} } <anonymous-tag>
endgame_next <Unable to read memory>
flags <Unable to read memory>
timer_heap 0x000001fa8540e1d0 void *
+ prepare_handles 0x0000000000000000 {data=??? loop=??? type=??? ...} uv_prepare_s *
+ check_handles 0x0000000000000000 {data=??? loop=??? type=??? ...} uv_check_s *
+ idle_handles 0x0000000000000000 {data=??? loop=??? type=??? ...} uv_idle_s *
+ next_prepare_handle 0x0000000000000000 {data=??? loop=??? type=??? ...} uv_prepare_s *
+ next_check_handle 0x0000000000000000 {data=??? loop=??? type=??? ...} uv_check_s *
+ next_idle_handle 0x0000000000000000 {data=??? loop=??? type=??? ...} uv_idle_s *
+ poll_peer_sockets 0x000001fa8540d598 {0, 0, 0} unsigned __int64[3]
active_tcp_streams 0 unsigned int
active_udp_streams 0 unsigned int
timer_counter 0 unsigned __int64
+ wq 0x000001fa8540d5c0 {0x000001fa8540d5c0, 0x000001fa8540d5c0} void *[2]
+ wq_mutex {DebugInfo=0x000001fa8540e250 {Type=0 CreatorBackTraceIndex=148 CriticalSection=0x000001fa8540d5d0 {...} ...} ...} _RTL_CRITICAL_SECTION
+ wq_async {data=0xe0e0e0e0e0e0e0e0 loop=0x000001fa8540d508 {data=0xe0e0e0e0e0e0e0e0 active_handles=1 handle_queue=...} ...} uv_async_s
so it is same as Assertion failed: 0, file d:\gireesh\node\deps\uv\src\win\handle-inl.h, line 160 with bad handle(s) appearing for cleanup.
gireeshpunathil
on 16 Jan 2019
looking through the threads, 2 of them are relevant while others inert, just blocked on conditions.
failing thread (0x3d7c, some helper thread?)
node!abort+0x35
node!common_assert_to_stderr<wchar_t>+0xc8
node!_wassert+0x72
node!uv_run+0x3da
node!uv__thread_start+0x4d
node!thread_start<unsigned int (__cdecl*)(void * __ptr64)>+0x50
verifier!VerifierGetPropertyValueByName+0x1aefd
kernel32!BaseThreadInitThunk+0x22
ntdll!RtlUserThreadStart+0x34
main thread (0x280c)
ntdll!ZwWaitForAlertByThreadId+0x14
ntdll!RtlSleepConditionVariableCS+0xd0
KERNELBASE!SleepConditionVariableCS+0x37
node!uv_cond_wait+0x10
node!node::tracing::NodeTraceBuffer::`scalar deleting destructor'+0x63
node!v8::platform::tracing::TracingController::Initialize+0x24
node!node::tracing::Agent::~Agent+0x74
node!node::Start+0x56a
node!wmain+0x1bc
node!__scrt_common_main_seh+0x10c
kernel32!BaseThreadInitThunk+0x22
ntdll!RtlUserThreadStart+0x34
will see if f39b3e33719cdb7102e9ae7b67a13de4dd681949 is of any relevance.
gireeshpunathil
on 16 Jan 2019
while this still need to be narrowed down, it is more or less evident that event loop is getting bad elements from the destruction that is happening in the main thread?
if so, does @addaleax 's reset StopTracingAgent() before platform teardown (#25472) going to be a solution for this?
gireeshpunathil
on 16 Jan 2019
fwiw, the failing thread is identified as the Agent thread that runs the event loop on tracing_loop_ in the lambda within Agent::Start
gireeshpunathil
on 16 Jan 2019
that leads to a point (of dilemma for me): is it fair / safe to execute uv_run from 2 different threads? one from agent thread created in Agent::Start and the other one (main) through Agent::~Agent?
edit: to execute uv_run => to execute uv_run on the same loop object
gireeshpunathil
on 16 Jan 2019
The code looks ok. We wait for the thread to join in StopTracing, before calling uv_run from another thread.
I cant get this to reproduce on my box. Could you inspect the content of the handle that causes the crash?
 bzoz
on 17 Jan 2019
bzoz
on 17 Jan 2019
@bzoz - sure; been trying hard to get a repro. Will update when I have one.
gireeshpunathil
on 17 Jan 2019
is it fair / safe to execute
uv_runfrom 2 different threads?
@gireeshpunathil I’m pretty sure the answer to that is “no”.
addaleax
on 17 Jan 2019
is it fair / safe to execute
uv_runfrom 2 different threads?
Other runtimes do this (e.g. Electron & Julia), but in a thread-safe way (conditionally on a mutex or other locks).
refack
on 17 Jan 2019
There is a uv_thread_join on the thread that runs the loop before the other thread gives the loop a spin.
bzoz
on 17 Jan 2019
Oh, yeah, running it concurrently is the issue. I think consecutively running on different threads should not be an issue on its own.
addaleax
on 18 Jan 2019
one challenge in getting the needed info is: right now the failing code is run as a child process, if we move it to the parent then it does not fail anymore; and if run as is it fails, but does not produce dumps.
I am running with SetErrorMode(0) in both libuv and the python harness, that addresses the dump generation issue for the parent, but not for the child!
Is there a specific flag I could pass to CreateProcessW? I don't see anything in uv_spawn that inhibits dump generation for the child.
gireeshpunathil
on 18 Jan 2019
the recreate frequency for this issue has got thin over time. So I guess I stop my effort on this further, and wait to see if it recurs.
gireeshpunathil
on 19 Jan 2019
I am running with
SetErrorMode(0)in both libuv and the python harness, that addresses thedumpgeneration issue for the parent, but not for the child!
That's what I was seeing as well... I'm wondering if that might indicate that the error happens at the kernel level, before the child process has completed it's launch.
refack
on 19 Jan 2019
@refack - that looks probable - I ran this in Linux, freebsd and AIX a 10K times and never seen a single failure, so something that deeply related to the OS and beneath, may be. The test is doing a lot of disk I/O, applying all possible fs operations on the same file in quick succession so I agree to such a (kernel) possibility.
gireeshpunathil
on 19 Jan 2019
Can somebody check whether https://github.com/nodejs/node/pull/25624 helps with this? (Edit: I’ve started a stress test there.)
addaleax
on 21 Jan 2019
Can somebody check whether #25624 helps with this? (Edit: I’ve started a stress test there.)
I Tested Build artifact from CI, compared with latest nightly and issue did not reproduce.
Then I tested the build artifact from an arbitrary previous job and it also did not reproduce.
Binary from latest nightly CI on master does reproduce.
So IMO the test is inconclusive 🤷♂️. Could any one of the commits in this range fixed the issue? Maybe https://github.com/nodejs/node/commit/f698386c7e988ef45027a75b2ff988899ee2af1d (It's PR's binary from 2 days ago also does not repro)
refack
on 22 Jan 2019
I don’t think this is fixed – the stress test for #25624 failed.
addaleax
on 22 Jan 2019
The stress test for #25624 show a failure on Windows2016 (1 core):
20:04:29 not ok 1 parallel/test-trace-events-fs-sync
20:04:29 ---
20:04:29 duration_ms: 1.164
20:04:29 severity: fail
20:04:29 exitcode: 1
20:04:29 stack: |-
20:04:29 c:\workspace\node-stress-single-test\nodes\win2016-1p-vs2017\test\parallel\test-trace-events-fs-sync.js:140
20:04:29 throw new Error(`${tr}:\n${util.inspect(proc)}`);
20:04:29 ^
20:04:29
20:04:29 Error: fs.sync.fdatasync:
20:04:29 { status: 3221225477,
20:04:29 signal: null,
20:04:29 output: [ null, '', '' ],
20:04:29 pid: 5124,
20:04:29 stdout: '',
20:04:29 stderr: '' }
20:04:29 at Object.<anonymous> (c:\workspace\node-stress-single-test\nodes\win2016-1p-vs2017\test\parallel\test-trace-events-fs-sync.js:140:11)
20:04:29 at Module._compile (internal/modules/cjs/loader.js:737:30)
20:04:29 at Object.Module._extensions..js (internal/modules/cjs/loader.js:748:10)
20:04:29 at Module.load (internal/modules/cjs/loader.js:629:32)
20:04:29 at tryModuleLoad (internal/modules/cjs/loader.js:572:12)
20:04:29 at Function.Module._load (internal/modules/cjs/loader.js:564:3)
20:04:29 at Function.Module.runMain (internal/modules/cjs/loader.js:802:12)
20:04:29 at executeUserCode (internal/bootstrap/node.js:497:15)
20:04:29 at startMainThreadExecution (internal/bootstrap/node.js:434:3)
20:04:29 ...
for the first time, saw this on a non-windows platform:
https://ci.nodejs.org/job/node-test-commit-aix/20695/nodes=aix61-ppc64/consoleFull
so:
- issue is not resolved,
- issue is not win32 / kernel related
gireeshpunathil
on 30 Jan 2019
As the recreate frequency is more, I went back to 7f913293c1ac50b01dfc775fe4861f362bcf624a where I it is relatively easy to fail.
But again, the child process crash is not helping us anyways, as we don't get any context other than the exit code.
I wrote a smaller version that essentially what the child was doing, and ran in parent, and got a crash:
Unhandled exception at 0x00007FF700FBDD70 in node.exe: 0xC0000005: Access violation reading location 0x0000015494449030.
main thread:
ntdll.dll!00007ff94f5b5154() Unknown
KernelBase.dll!00007ff94be2aadf() Unknown
> node.exe!uv_thread_join(void * * tid) Line 160 C
node.exe!node::tracing::Agent::~Agent() Line 81 C++
node.exe!node::Start(int argc, char * * argv) Line 1467 C++
node.exe!wmain(int argc, wchar_t * * wargv) Line 72 C++
node.exe!__scrt_common_main_seh() Line 288 C++
kernel32.dll!00007ff94de88102() Unknown
ntdll.dll!00007ff94f56c5b4() Unknown
failing thread:
> node.exe!uv_run(uv_loop_s * loop, <unnamed-enum-UV_RUN_DEFAULT> mode) Line 536 C
node.exe!uv__thread_start(void * arg) Line 104 C
node.exe!thread_start<unsigned int (__cdecl*)(void * __ptr64)>(void * const parameter) Line 115 C++
kernel32.dll!00007ff94de88102() Unknown
ntdll.dll!00007ff94f56c5b4() Unknown
this is basically:
https://github.com/libuv/libuv/blob/619937c783a05b51fba95cc9a62543deeffe5fa7/src/win/handle-inl.h#L103
reg:
RAX = 0000000000000000 RBX = 00000154944476F8 RCX = 00007FF94F5B5E84 RDX = 0000000000000000 RSI = 0000000000000001 RDI = 0000015494448FE0 R8 = 000000163B5FF728 R9 = 0000000000000001 R10 = 0000000000000000 R11 = 0000000000000246 R12 = 0000000000000000 R13 = 0000000000000000 R14 = 00007FF700D30000 R15 = 0000000000000000 RIP = 00007FF700FBDD70 RSP = 000000163B5FF7D0 RBP = 0000000000000000 EFL = 00010200
fault lines:
uv_process_endgames(loop);
00007FF700FBDD5A mov rdi,qword ptr [rbx+50h] // loop->endgame_handles into rdi
00007FF700FBDD5E test rdi,rdi
00007FF700FBDD61 je uv_run+40Fh (07FF700FBDEBFh) // if null go out
00007FF700FBDD67 nop word ptr [rax+rax]
* 00007FF700FBDD70 mov rax,qword ptr [rdi+50h] // loop->endgame_handles = handle->endgame_next;
// crash, as part of loop->endgame_handles is unavailable.
Unfortunatly I am unable to make meaning out of it.
I have the debugger launched, if any one is interested in any more data.
@bzoz @addaleax
gireeshpunathil
on 30 Jan 2019
ok, now given the problem site in localized, I covered the faulty lines in __try , __except blocks and ran the original test, the control goes to the catch block; so confirm that the failure is indeed here!
the only possibility I can think of is concurrent access to the endgame_handles list and / or its chain by 2 threads.
if 2 threads needs to operate on the same loop object, I don't know how many places we will need exclusive access, but in this case, at least in uv_want_endgame and uv_process_endgames
gireeshpunathil
on 31 Jan 2019
Given that we precisely know the failing line, I patched libuv thus:
- adding an exception handler to get the exception record
- adding instrument to print the relevant elements
diff --git a/deps/uv/src/win/handle-inl.h b/deps/uv/src/win/handle-inl.h
index 82c657d579..88bc38470b 100644
--- a/deps/uv/src/win/handle-inl.h
+++ b/deps/uv/src/win/handle-inl.h
@@ -91,16 +91,32 @@ INLINE static void uv_want_endgame(uv_loop_t* loop, uv_handle_t* handle) {
handle->endgame_next = loop->endgame_handles;
loop->endgame_handles = handle;
+ fprintf(stderr, "uv_want_endgame, loop: 0x%p, handle: 0x%p, type: %d, requester: %d\n", loop, handle, handle->type, GetCurrentThreadId());
}
}
+inline DWORD GGG(LPEXCEPTION_POINTERS ptr)
+{
+ EXCEPTION_RECORD* record = ptr->ExceptionRecord;
+ fprintf(stderr, "code: %d, flags: %d\n", record->ExceptionCode, record->ExceptionFlags);
+ return EXCEPTION_EXECUTE_HANDLER;
+}
+
INLINE static void uv_process_endgames(uv_loop_t* loop) {
uv_handle_t* handle;
+
+
while (loop->endgame_handles) {
- handle = loop->endgame_handles;
- loop->endgame_handles = handle->endgame_next;
+ __try {
+ handle = loop->endgame_handles;
+ fprintf(stderr, "uv_process_endgame, loop: 0x%p, handle: 0x%p, type: %d, executor: %d\n", loop, handle, handle->type, GetCurrentThreadId());
+ loop->endgame_handles = handle->endgame_next;
+ }
+ __except(GGG(GetExceptionInformation())) {
+ fprintf(stderr, "surprise in the end game!\n");
+ }
handle->flags &= ~UV_HANDLE_ENDGAME_QUEUED;
and got this:
uv_want_endgame, loop: 0x00007FF620A97810, handle: 0x00000099BDBBED20, type: 13, requester: 117392
uv_want_endgame, loop: 0x00007FF620A97810, handle: 0x00000099BDBBEDC0, type: 2, requester: 117392
uv_want_endgame, loop: 0x00007FF620A97810, handle: 0x00000099BDBBEE38, type: 6, requester: 117392
uv_want_endgame, loop: 0x00007FF620A97810, handle: 0x00000099BDBBEEB0, type: 9, requester: 117392
uv_want_endgame, loop: 0x00007FF620A97810, handle: 0x00000099BDBBEF28, type: 2, requester: 117392
uv_process_endgame, loop: 0x00007FF620A97810, handle: 0x00000099BDBBEF28, type: 2, executor: 117392
uv_process_endgame, loop: 0x00007FF620A97810, handle: 0x00000099BDBBEEB0, type: 9, executor: 117392
uv_process_endgame, loop: 0x00007FF620A97810, handle: 0x00000099BDBBEE38, type: 6, executor: 117392
uv_process_endgame, loop: 0x00007FF620A97810, handle: 0x00000099BDBBEDC0, type: 2, executor: 117392
uv_process_endgame, loop: 0x00007FF620A97810, handle: 0x00000099BDBBED20, type: 13, executor: 117392
// no problem, one full cycle of end game
// from the many types of handles, this looks like the main loop
uv_want_endgame, loop: 0x00007FF620A97810, handle: 0x00007FF620A951D0, type: 1, requester: 117392
uv_want_endgame, loop: 0x00007FF620A97810, handle: 0x0000025AD5BEB170, type: 1, requester: 117392
// 2 new parties registered for end game, but did not fire yet.
uv_want_endgame, loop: 0x0000025AD5BC0728, handle: 0x0000025AD5BC1FB0, type: 1, requester: 62228
uv_want_endgame, loop: 0x0000025AD5BC0728, handle: 0x0000025AD5BC2090, type: 1, requester: 62228
uv_process_endgame, loop: 0x0000025AD5BC0728, handle: 0x0000025AD5BC2090, type: 1, executor: 62228
uv_process_endgame, loop: 0x0000025AD5BC0728, handle: 0x0000025AD5BC1FB0, type: 1, executor: 62228
// failing thread (agent's thread) runs one cycle of its end game. All are async handles.
uv_want_endgame, loop: 0x0000025AD5BC9238, handle: 0x0000025AD5BC9408, type: 1, requester: 83608
uv_process_endgame, loop: 0x0000025AD5BC9238, handle: 0x0000025AD5BC9408, type: 1, executor: 83608
// some other loop, some other thread. don't know what it is.
uv_want_endgame, loop: 0x0000025AD5BC0728, handle: 0x0000025AD5BC2580, type: 1, requester: 62228
uv_want_endgame, loop: 0x0000025AD5BC0728, handle: 0x0000025AD5BC2660, type: 1, requester: 62228
uv_process_endgame, loop: 0x0000025AD5BC0728, handle: 0x0000025AD5BC2660, type: 1, executor: 62228
uv_process_endgame, loop: 0x0000025AD5BC0728, handle: 0x0000025AD5BC2580, type: 1, executor: 62228
// failing thread comes again, this time only to crash.
code: -1073741819, flags: 0
surprise in the end game!
Observations:
- Unlike I suspected earlier, no 2 threads seem to interact with one loop
- Problem always happens when the handle is async
- Problem always occurs onto the tracing agent's thread
- 0x62228 is the only thread that entered the endgame twice
Inferences:
- Given the code in
uv_want_endgameanduv_process_endgame, this does not seem - Given that the loop->engame_handles link is only modified by one thread, there is no synchronization / cache coherence issue
- Given that
uv_runcan be run multiple times, re-enteringuv_process_endgameseem to be valid endgame_nextfield inuv_handle_tis neither initialized to NULL in the handle init, nor nullified in the handle close. However, doing that do not seem to solve the issue; plus that cannot explain the current crash.
gireeshpunathil
on 2 Feb 2019
@nodejs/libuv
Trott
on 2 Feb 2019
ok, so here we are!
In addition to the above, add this one too:
diff --git a/src/tracing/node_trace_buffer.cc b/src/tracing/node_trace_buffer.cc
index 3b7119f6d5..9b907a6a81 100644
--- a/src/tracing/node_trace_buffer.cc
+++ b/src/tracing/node_trace_buffer.cc
@@ -110,6 +110,7 @@ NodeTraceBuffer::NodeTraceBuffer(size_t max_chunks,
 }

 NodeTraceBuffer::~NodeTraceBuffer() {
+  fprintf(stderr, "destroying exit signal handle 0x%p\n", &exit_signal_);
   uv_async_send(&exit_signal_);
   Mutex::ScopedLock scoped_lock(exit_mutex_);
   while (!exited_) {
and we get here:
uv_want_endgame, loop: 0x000002B61728B058, handle: 0x000002B61728B228, type: 1, requester: 11804
uv_process_endgame, loop: 0x000002B61728B058, handle: 0x000002B61728B228, type: 1, executor: 11804
...

destroying exit signal handle 0x000002B617283090
...
uv_want_endgame, loop: 0x000002B61727F618, handle: 0x000002B617282FB0, type: 1, requester: 103264
uv_want_endgame, loop: 0x000002B61727F618, handle: 0x000002B617283090, type: 1, requester: 103264
uv_process_endgame, loop: 0x000002B61727F618, handle: 0x000002B617283090, type: 1, executor: 103264
uv_process_endgame, loop: 0x000002B61727F618, handle: 0x000002B617282FB0, type: 1, executor: 103264
surprise in the end game!
- the bad async handle is indeed the exit signal from the trace buffer.
- the tracer is being destroyed as part of re-init.
exit_handle_is a part of NodeTraceBuffer object, not even a pointer. So it does not survive across delete.- we send a piece of memory which we delete soon.
- when the end game is on, this memory is unavailable.
Issue exists in all platforms, the crash will depend on how the C++ runtime deals with deleted memory. Some keep it aside for future uses, some unmap it, which case causes definite crash. From the symptom I assume Win 10 frees it up.
As the handle is used for cross thread communication, it should outlive the Buffer object.
And as we don't seem to create multiple TraceBuffer objects, how about this being made static?
cc @addaleax
gireeshpunathil
on 2 Feb 2019
@gireeshpunathil It looks like you’ve struck gold, but I’m not quite sure that what you’re suspecting as the reason is correct:
exit_signal_ is closed inside its own callback, and ~NodeTraceBuffer does not finish until exited_ is set, which only happens once exit_signal_ has been closed. Freeing the memory after the handle is closed is normal and should be okay.
However, there’s something that sticks out about your last log output: uv_want_endgame and uv_process_endgame happen in reverse order for the two NodeTraceBuffer handles.
We tell the thread that deletes NodeTraceBuffer to continue once exit_signal_ is closed, but we actually try to close flush_signal_ afterwards as well, when the other thread might have continued, and so we run into trouble there.
To confirm, running with this patch doesn’t make it crash on Linux for me, but it does make valgrind complain:
@@ -176,9 +177,12 @@ void NodeTraceBuffer::ExitSignalCb(uv_async_t* signal) {
            [](uv_handle_t* signal) {
       NodeTraceBuffer* buffer =
           reinterpret_cast<NodeTraceBuffer*>(signal->data);
+      {
       Mutex::ScopedLock scoped_lock(buffer->exit_mutex_);
       buffer->exited_ = true;
       buffer->exit_cond_.Signal(scoped_lock);
+      }
+      sleep(1);
   });
 }
Suggested solution: addaleax/node@60311fe2fa8d6e0670d8b51f703ec2738fc35686
Stress test CI: https://ci.nodejs.org/job/node-stress-single-test/2146/
addaleax
on 2 Feb 2019
@addaleax - I will also run the test with your patch, as well as go try to understand the changes.
gireeshpunathil
on 2 Feb 2019
@gireeshpunathil Just occurred to me that this might be somewhat easier to explain with your debug output:
destroying exit signal handle 0x000002B617283090  // enter destructor
...
// uv_close() for flush_signal_
uv_want_endgame, loop: 0x000002B61727F618, handle: 0x000002B617282FB0, type: 1, requester: 103264
// uv_close() for exit_signal_
uv_want_endgame, loop: 0x000002B61727F618, handle: 0x000002B617283090, type: 1, requester: 103264
// uv_close() callback for exit_signal_
uv_process_endgame, loop: 0x000002B61727F618, handle: 0x000002B617283090, type: 1, executor: 103264
/* XXX The destructor continues NOW and memory is released,
 * even though flush_signal_ still has a pending callback */
// uv_close() callback for flush_signal_
uv_process_endgame, loop: 0x000002B61727F618, handle: 0x000002B617282FB0, type: 1, executor: 103264
surprise in the end game!
Another data point. From our CI, binaries created on https://ci.nodejs.org/computer/test-rackspace-win2008r2-x64-3/builds reproduce readily. Binaries from other machines not so much 😕
refack
on 2 Feb 2019
Strong evidence that https://github.com/nodejs/node/pull/25896 fixes the issue. Good job y'all 🎩
- On https://ci.nodejs.org/computer/test-rackspace-win2008r2-x64-3/builds Checked out https://github.com/nodejs/node/commit/60311fe2fa8d6e0670d8b51f703ec2738fc35686
- Build node-after.zip
- run
git reset --hard HEAD~1(i.e. 28c0f84a695790109c6f863986feae2726374fa5) - Build node-pre.zip
- Tested on https://ci.nodejs.org/computer/test-azure_msft-win10-x64-3/
- Results ("pre" first, "after" second):
C:\workspace\node-test-binary-windows>python tools\test.py --repeat 10000 parallel/test-trace-events-fs-sync
=== release test-trace-events-fs-sync ===
Path: parallel/test-trace-events-fs-sync
C:\workspace\node-test-binary-windows\test\parallel\test-trace-events-fs-sync.js:140
    throw new Error(`${tr}:\n${util.inspect(proc)}`);
    ^

Error: fs.sync.utimes:
{ status: 3221225477,
  signal: null,
  output: [ null, '', '' ],
  pid: 192,
  stdout: '',
  stderr: '' }
    at Object.<anonymous> (C:\workspace\node-test-binary-windows\test\parallel\test-trace-events-fs-sync.js:140:11)
    at Module._compile (internal/modules/cjs/loader.js:735:30)
    at Object.Module._extensions..js (internal/modules/cjs/loader.js:746:10)
    at Module.load (internal/modules/cjs/loader.js:627:32)
    at tryModuleLoad (internal/modules/cjs/loader.js:570:12)
    at Function.Module._load (internal/modules/cjs/loader.js:562:3)
    at Function.Module.runMain (internal/modules/cjs/loader.js:798:12)
    at internal/main/run_main_module.js:27:11
Command: C:\workspace\node-test-binary-windows\Release\node.exe C:\workspace\node-test-binary-windows\test\parallel\test-trace-events-fs-sync.js
=== release test-trace-events-fs-sync ===
Path: parallel/test-trace-events-fs-sync
C:\workspace\node-test-binary-windows\test\parallel\test-trace-events-fs-sync.js:140
    throw new Error(`${tr}:\n${util.inspect(proc)}`);
    ^

Error: fs.sync.fstat:
{ status: 3221225477,
  signal: null,
  output: [ null, '', '' ],
  pid: 460,
  stdout: '',
  stderr: '' }
    at Object.<anonymous> (C:\workspace\node-test-binary-windows\test\parallel\test-trace-events-fs-sync.js:140:11)
    at Module._compile (internal/modules/cjs/loader.js:735:30)
    at Object.Module._extensions..js (internal/modules/cjs/loader.js:746:10)
    at Module.load (internal/modules/cjs/loader.js:627:32)
    at tryModuleLoad (internal/modules/cjs/loader.js:570:12)
    at Function.Module._load (internal/modules/cjs/loader.js:562:3)
    at Function.Module.runMain (internal/modules/cjs/loader.js:798:12)
    at internal/main/run_main_module.js:27:11
Command: C:\workspace\node-test-binary-windows\Release\node.exe C:\workspace\node-test-binary-windows\test\parallel\test-trace-events-fs-sync.js
[00:27|%   0|+   7|-   2]: Done

C:\workspace\node-test-binary-windows>python tools\test.py --repeat 10000 parallel/test-trace-events-fs-sync
[15:47|%   3|+ 307|-   0]: Done

C:\workspace\node-test-binary-windows>
New crash with patch from #25896
uv_want_endgame, loop: 0x000001E67201F838, handle: 0x000001E67201FCD0, type: 1, requester: 63340
uv_want_endgame, loop: 0x000001E67201F838, handle: 0x000001E67201FDB0, type: 1, requester: 63340
uv_process_endgame, loop: 0x000001E67201F838, handle: 0x000001E67201FDB0, type: 1, executor: 63340
uv_process_endgame, loop: 0x000001E67201F838, handle: 0x000001E67201FCD0, type: 1, executor: 63340
bad type!!!
- pls note that this may not be the
exit / flush signal handle pairs, as the printf is missing - pls also note that the
bad typeis my instrument, coming from the bottom of theendgameloop where it asserts when the handle type cannot be determined - it surely is indicative of access to released memory.
But then who can be these? let us find out.
gireeshpunathil
on 3 Feb 2019
node::tracing::NodeTraceWriter::ExitSignalCb too?
gireeshpunathil
on 3 Feb 2019
@addaleax - I can confirm that the change is relevant to NodeTraceWriter::ExitSignalCb as well.
With the new patch, test failed once without enough context, that prompted me to look around for similar patterns. But could not get enough evidence on this, as the failure suddenly just stopped.
Then I followed you suggestions in Linux (adding timing etc.) but did not see any failure. Tried this patch (in theory this should be ok, as we are on the back edge of deleting the object, so cleaning manually is fine)
index 3b7119f..33e12e4 100644
--- a/src/tracing/node_trace_buffer.cc
+++ b/src/tracing/node_trace_buffer.cc
@@ -114,6 +114,12 @@ NodeTraceBuffer::~NodeTraceBuffer() {
   Mutex::ScopedLock scoped_lock(exit_mutex_);
   while (!exited_) {
     exit_cond_.Wait(scoped_lock);
+    if (exited_) {
+     exit_signal_.type = (uv_handle_type) -1;
+     flush_signal_.type = (uv_handle_type) -1;
+    }
+
   }
 }
and saw what we used to see in Windows - but was assertion failures on bad handle type - because I manually cleared it.
Then I examined a freed object and saw that it is was in tact - so we were using freed memory in LInux too.
So applying the same theory, I can confirm that NodeTraceWriter::~NodeTraceWriter is vulnerable too.
On a hindsight, do we / should we have an option to direct malloc to fill freed up memory with garbage? Such an option would help us detect issues faster. I looked at MALLOPT and MALLOCOPTIONS but did not find any
gireeshpunathil
on 3 Feb 2019
@gireeshpunathil Yeah, thanks for catching that ~NodeTraceWriter has the same issue.
I think filling memory with garbage is something we'd only want to do in debug mode -- but maybe we can implement that in some way, yes?
addaleax
on 3 Feb 2019
Related issues
 cong88
·
3Comments
cong88
·
3Comments
 danielstaleiny
·
3Comments
danielstaleiny
·
3Comments
 filipesilvaa
·
3Comments
addaleax
·
3Comments
filipesilvaa
·
3Comments
addaleax
·
3Comments
 loretoparisi
·
3Comments
loretoparisi
·
3Comments
Most helpful comment
ok, so here we are!
In addition to the above, add this one too:
and we get here:
exit_handle_is a part of NodeTraceBuffer object, not even a pointer. So it does not survive across delete.Issue exists in all platforms, the crash will depend on how the C++ runtime deals with deleted memory. Some keep it aside for future uses, some unmap it, which case causes definite crash. From the symptom I assume Win 10 frees it up.
As the handle is used for cross thread communication, it should outlive the Buffer object.
And as we don't seem to create multiple TraceBuffer objects, how about this being made static?
cc @addaleax