- Version: 8.0.0
- Platform:Darwin Kernel Version 16.6.0
- Subsystem:
node --inspect-brk xxx.js
Debugger listening on ws://127.0.0.1:9229/0f2332ff-8ade-478f-bc82-539beccb434d
the given url could not be opend with chrome ,but succeeded with url below
chrome-devtools://devtools/bundled/inspector.html?experiments=true&v8only=true&ws=127.0.0.1:9229/0f2332ff-8ade-478f-bc82-539beccb434d
 rawbin-
All 16 comments
The ws:// URL is where the debugger is listening, but you need to connect to the chrome-devtools:// URL to actually communicate with it (unless you write your own tool). That's why the latter URL has the ws query string parameter. I think this is working as intended, although the messaging may be confusing. I think the idea was to make the displayed URL more vendor agnostic, with vendor specific instructions included at https://nodejs.org/en/docs/inspector/.
 cjihrig
on 2 Jun 2017
cjihrig
on 2 Jun 2017
Same problem!!! Where can I input the ws://127.0.0.1:9229/0f2332ff-8ade-478f-bc82-539beccb434d in chrome developer tools? No hint on https://nodejs.org/en/docs/inspector/.
 gmuc
on 7 Jun 2017
gmuc
on 7 Jun 2017
@gmuc try going to chrome://inspect if you are on the latest version of chrome. The target should show there
 evanlucas
on 7 Jun 2017
evanlucas
on 7 Jun 2017
I have chrome 58.0.3029 on OSX 10.10.5. My inspect URL from node 8.0 in docker is:
Debugger listening on ws://127.0.0.1:9223/99d7ea20-3e5d-4b18-891c-2aae3a1c69de
I follow https://nodejs.org/en/docs/inspector:
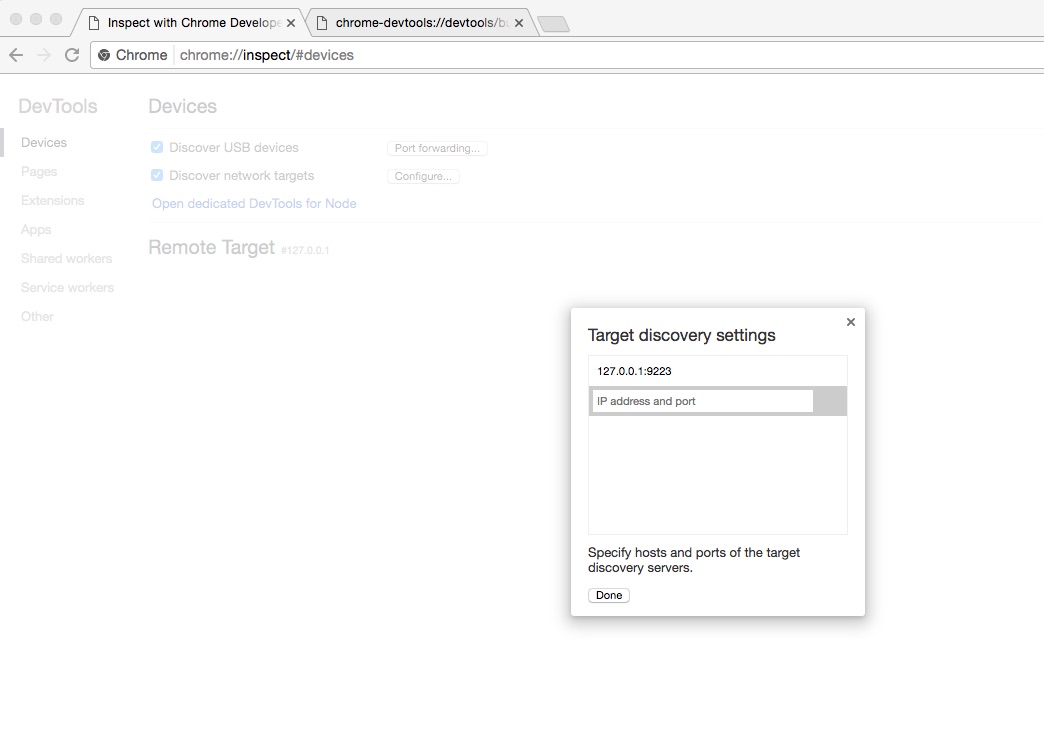
I open chrome://inspect ==> "Target discovery settings" = 127.0.0.1:9223 ==> Done
==> Open dedicated DevTools for Node ==> Debugger appear but no source to debug :-(
In older node versions "node --inspect=9223" output was
chrome-devtools://devtools/bundled/inspector.html?experiments=true&v8only=true&ws=127.0.0.1:9223/b41a882a-060e-437a-8ce7-820855b5aae3
I paste this URL in chrome and debugger work -- very simple!!!
gmuc
on 7 Jun 2017
cc/ @nodejs/v8-inspector for the usability
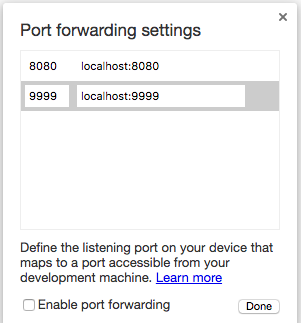
If you're running in docker then are you port mapping the container 9223 to your machine's 9223? If you're mapping to a different point you can watch that port with by clicking on the port forwarding button (using 9999 as an example).
 gibfahn
on 7 Jun 2017
gibfahn
on 7 Jun 2017
FWIW once you've got the ports set up, once you open the devtools with the Open dedicated DevTools for Node button, that window will automatically refresh every time you restart the debugger, so you don't have to keep copy-pasting links. That saves a lot of time.
gibfahn
on 7 Jun 2017
in my docker-compose.yml I map Ports:
ports:
- "9223:9223"
on "docker ps" I got:
PORTS
0.0.0.0:9223->9223/tcp, 0.0.0.0:3001->3000/tcp
9223 = debugger-port, 3001 = express port
==> no need of port forwarding
@gibfahn "Open dedicated DevTools for Node" very goog idea - but not working for me :-(
This is my screen after press "Open dedicated DevTools for Node" - empty debugger:
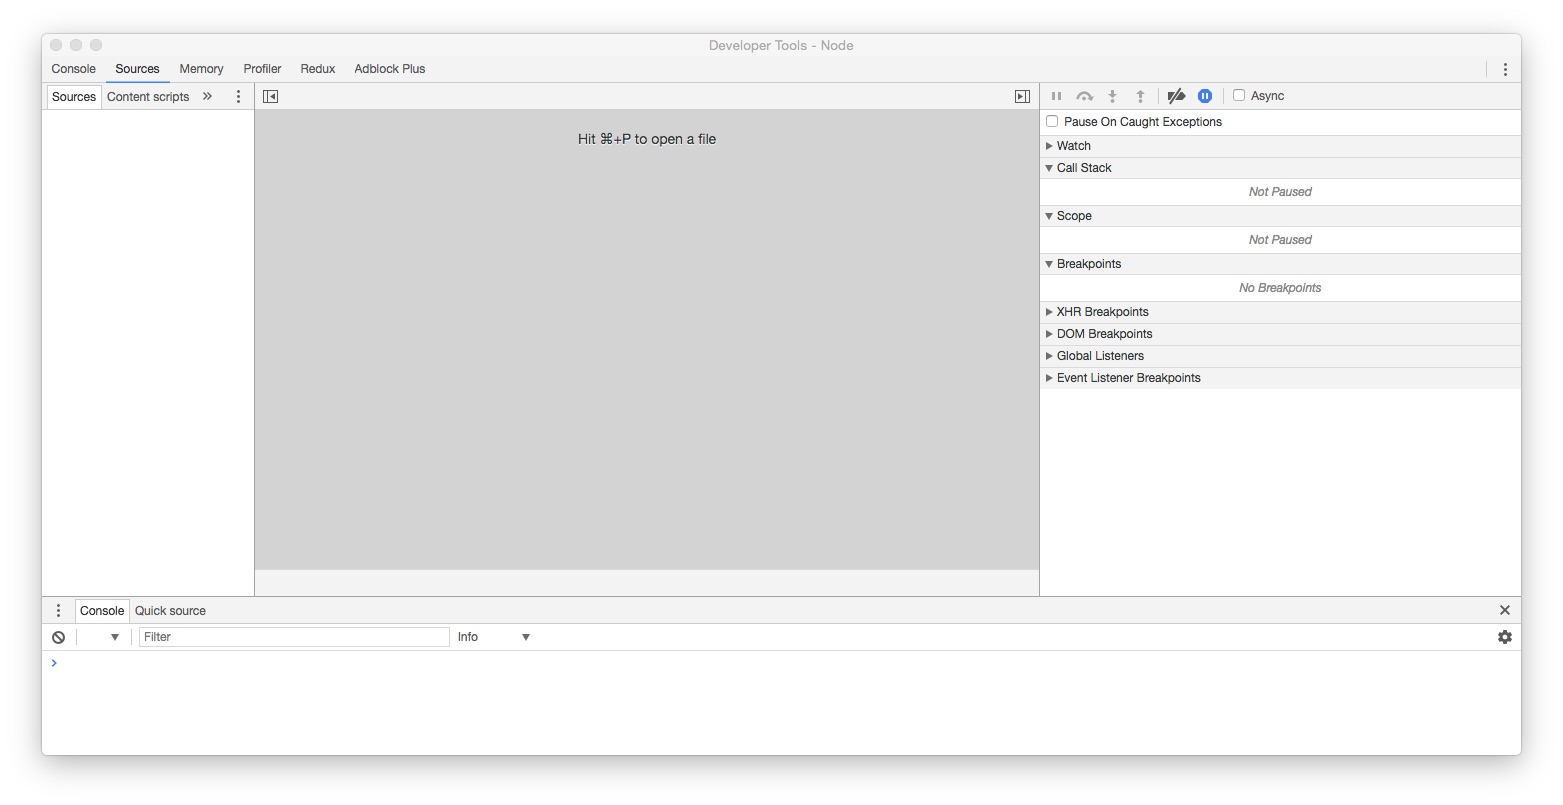
Any other ideas for analysis of these problem?
Why inspect print 99d7ea20-3e5d-4b18-891c-2aae3a1c69de if you only need ws://127.0.0.1:9223 for opening debugger?
gmuc
on 7 Jun 2017
I'm afraid that's the extent of my knowledge, I'm hoping someone from @nodejs/v8-inspector will know more.
gibfahn
on 7 Jun 2017
You can specify custom port (9223) by clicking the "Configure" on the chrome://inspect page. Then Chrome will detect when Node (or any other Chrome protocol server) is running on that port and will show the target.
 eugeneo
on 7 Jun 2017
eugeneo
on 7 Jun 2017
It's a problem of node version. I assume the handling of chrome devtools debugprotocol is buggy!
I now downgrade from node 8.0.0 to node 7.0.0 and chrome://inspect show a "Remote Target" ./src/index.js
file:///app/src/index.js and "Open dedicated DevTools for Node" open Debugger and show me source.
The debug link like
chrome-devtools://devtools/bundled/inspector.html?experiments=true&v8only=true&ws=127.0.0.1:9223/b41a882a-060e-437a-8ce7-820855b5aae3
working!!!
I try 7.8.0 too ==> same problems as 8.0.0
gmuc
on 8 Jun 2017
Thanks @gmuc. I've done the binary search, and 7.4.0 works for me, 7.5.0 does not.
 robertjustjones
on 20 Jun 2017
robertjustjones
on 20 Jun 2017
I imagine people have updated to latest Chrome by now and everything works with Node.js 8.2.1. If that's just wishful thinking on my part, please leave a comment or (if GitHub lets you) re-open. Thanks.
 Trott
on 8 Aug 2017
Trott
on 8 Aug 2017
@gmuc @rawbin- You might find this helpful; I just launched a tool to wrap the node --inspect command and automatically open the devtools panel for you (it's called rawkit). It does require installing a Chrome Extension (which is the only way to open that kind of url automatically) but it essentially resolves this compatibility issue with the type of link generated from --inspect or --inspect-brk (ie. it checks for the websocket url ws:// and normalizes back to the chrome-devtools: link).
Feel free to check it out and let me know if you have any problems with it: https://github.com/darcyclarke/rawkit
I've also added it to the list of available/optional Node.js Chrome Debugging tools here: https://github.com/nodejs/nodejs.org/pull/1331
Edit: I could also print out the normalized URL for you if that's the ideal... maybe make an issue/PR against the repo?
 darcyclarke
on 8 Aug 2017
darcyclarke
on 8 Aug 2017
@darcyclarke I think the original issue was to do with running node --inspect inside a docker container, does rawkit work in docker?
gibfahn
on 8 Aug 2017
@gibfahn yep. Again, I normalize the chrome-devtools:// URL from the output of node --inspect so if you're running a newer version of node and get the ws:// socket reference then we can provide you with a relevant debugging URL. That said, I currently do not output that reference; it is just used to immediately open the devtools. As mentioned, I definitely could add that feature behind some kind of flag (/me runs to add that feature).
darcyclarke
on 8 Aug 2017
Now it work. My mistake: "--inspect 0.0.0.0:9222" is related to internal port of docker container and not of the host.
The container run on a host. In dockfile from container is a mapping from internal 9222 to a port of the host i.e. 9226. Chrome run on the host and use this localhost:9226 connection for debugging with chrome-dev-tools. It was a network problem and not a problem of the node-version! Thats it!!!
Details: https://nodejs.org/en/docs/guides/debugging-getting-started/
gmuc
on 27 Apr 2018
Related issues
 Icemic
·
3Comments
Icemic
·
3Comments
 Brekmister
·
3Comments
Brekmister
·
3Comments
 jmichae3
·
3Comments
jmichae3
·
3Comments
 seishun
·
3Comments
seishun
·
3Comments
 ksushilmaurya
·
3Comments
ksushilmaurya
·
3Comments
Most helpful comment
@gmuc try going to
chrome://inspectif you are on the latest version of chrome. The target should show there