Node-oracledb: Possible memory leak when using cursors / nested cursors
Note: I created a minimal test case to reproduce this under both Windows and Linux: https://github.com/nicholas-ochoa/node-oracledb-leak
- What versions are you using?
Database: Oracle DB 19c Standard Edition 2
Windows:
Windows 10 Enterprise build 2004
process.platform: win32
process.version: v13.14.0
process.arch: x64
oracledb.versionString: 5.0.0
oracledb.oracleClientVersionString: 19.3.0.0.0
Linux:
RHEL 8.2
process.platform: linux
process.version: v13.14.0
process.arch: x64
oracledb.versionString: 5.0.0
oracledb.oracleClientVersionString: 19.6.0.0.0
Is it an error or a hang or a crash?
Memory leak leading to significant slowdown and eventual hangWhat error(s) or behavior you are seeing?
Our backend API creates a connection pool during initialization and then gets a connection at the start of each API request - this connection is used for all queries during the life of the request and then closed at the end of the request. I've noticed since upgrading to 5.x and converting our nested cursor queries from our older method (converting the result to an XML CLOB within the database and then returning that) to using plain cursors that our load/performance tests tanked. Further investigation shows that the API was using upwards of 6-7GB of memory before finally hanging entirely - this was after a few hundred API requests.
As far as I can tell the memory is being used by the node-oracledb native code and not within NodeJS - I've tried a few different methods of tracking memory usage within Node and I'm not seeing anything abnormal at all.
I created a minimal reproducible example that tries to do things in a similar fashion to our API while still remaining understandable. This example creates a connection pool and opens two connections that each run 250 queries that retrieve a nested cursor of 1 row and 1 child row. During my testing this example results in 2.2gb "working set" memory and 8.1gb of "private bytes" being used in Windows (as measured by SysInternals Process Explorer)
init.ts - sets up the database connection pool and executes runTest(1) and runTest(2) asynchronously. You can also execute a single test by commenting those out and uncommenting await runTest(1) - the memory leak still occurs. There is a setTimeout() of 120 seconds as well to keep the script alive long enough to debug or dump the memory.
database.ts - Creates the connection pool (configure your database connection string here) and also sets UV_THREADPOOL_SIZE to 100. This is pretty similar to how we're initializing the database in our main codebase (minus the logging/configurable parameters and other niceties).
runTest.ts - Gets a connection from the pool and runs 250 iterations of await orderInfo() before closing the connection
orderInfo.ts - Executes a stored procedure that returns a sys_refcursor. The cursor is then fetched using getRow(), followed by fetching the nested cursor stored in ORDER_DETAIL also using `getRow().
This can probably be simplified further but I was trying to keep the structure and overall "workflow" similar to how we're using this in our main app. Let me know if I need to distill it down further and I can try.
- Include a runnable Node.js script that shows the problem.
See repository for test case: https://github.com/nicholas-ochoa/node-oracledb-leak
 nicholas-ochoa
All 3 comments
We'll take a look. Can I ask you to try a newer Node.js version (or recent 12.x release) so you and we have the same baseline?
 cjbj
on 3 Jul 2020
cjbj
on 3 Jul 2020
Hi @nicholas-ochoa ,
Thanks for sharing the code with us, I have created a simplified script based in your code to replicate the behavior that you are describing in this issue.
One of the things I noticed is that there is no cursor.close() call in your scripts, so I ran a quick comparison between the script with and without cursor.close(), these are my results:
- NodeJS 12.18.1
- node-oracledb v5
- Oracle Instant Client 19.6
- Oracle DB 19.6
- OE Linux 7
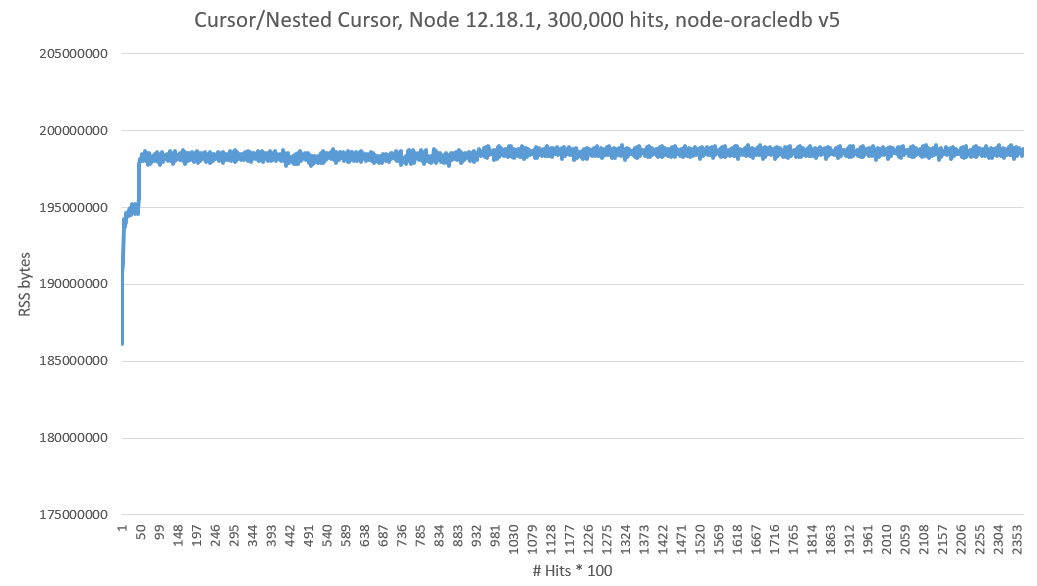
With cursor.close()
Without cursor.close()
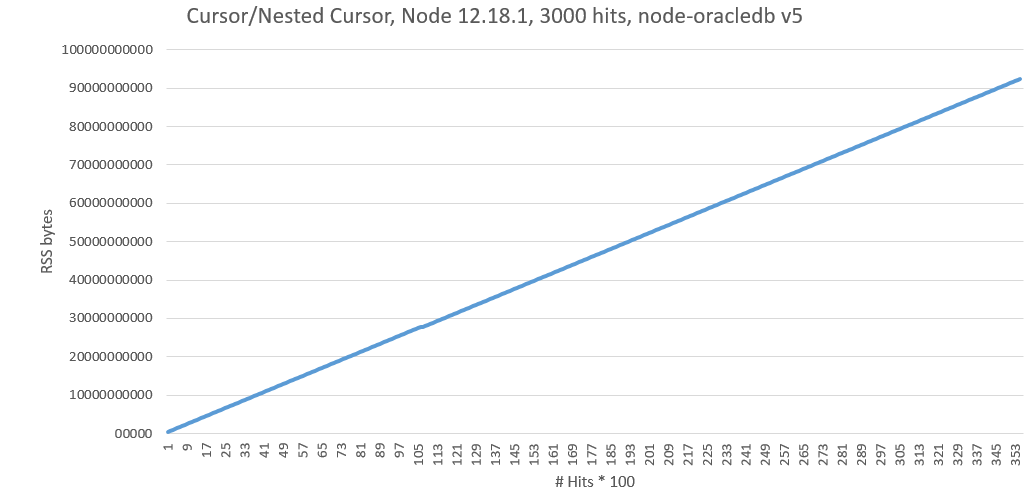
Without cursor.close() I was able to replicate the behavior your are describing here, but after adding the cursor.close() the RSS memory seems to get stabilized, I will leave running the test for longer time to be sure that there is no other issue going on here.
As first instance I would recommend you to add the cursor.close(), something like this await result.outBinds.cursor.close().
Thanks,
 j-antonio-rivera
on 3 Jul 2020
j-antonio-rivera
on 3 Jul 2020
It appears this was just user error on my part, I apologize for the fire drill. The issue wasn't quite what @j-antonio-rivera had mentioned but close. When creating the sample and simplifying the code I removed an unwindResultSet function that loops through the cursor and fetches the rows - I refactored this in to the orderInfo.ts file and forgot to include the .close() call after looping through the cursor.
I noticed that after including that file in my sample and fixing an issue (I was closing the nested cursor twice after fetching the rows from it) the memory leak disappeared. I've applied the same "fix" to my main application code and the memory leak has disappeared completely.
Sorry for the false alarm! At least I was able to track down the issue. 👍
nicholas-ochoa
on 6 Jul 2020
Related issues
 klaus82
·
4Comments
klaus82
·
4Comments
 ChrisHAdams
·
3Comments
ChrisHAdams
·
3Comments
 rstor1
·
4Comments
rstor1
·
4Comments
 tbyoran
·
4Comments
tbyoran
·
4Comments
 rheinripper
·
4Comments
rheinripper
·
4Comments
Most helpful comment
It appears this was just user error on my part, I apologize for the fire drill. The issue wasn't quite what @j-antonio-rivera had mentioned but close. When creating the sample and simplifying the code I removed an
unwindResultSetfunction that loops through the cursor and fetches the rows - I refactored this in to theorderInfo.tsfile and forgot to include the.close()call after looping through the cursor.I noticed that after including that file in my sample and fixing an issue (I was closing the nested cursor twice after fetching the rows from it) the memory leak disappeared. I've applied the same "fix" to my main application code and the memory leak has disappeared completely.
Sorry for the false alarm! At least I was able to track down the issue. 👍