Node_exporter: Support new pressure interface
Kernel 4.20 will include the facebook psi pressure metrics (commit). The psi documentation is available in the upstream kernel tree.
PSI adds a new interface in procfs to retrieve resource congestion information:
/proc/pressure/cpu:1:some avg10=0.00 avg60=0.00 avg300=0.00 total=1167162866
/proc/pressure/io:1:some avg10=0.00 avg60=0.00 avg300=0.00 total=61955081
/proc/pressure/io:2:full avg10=0.00 avg60=0.00 avg300=0.00 total=58578187
/proc/pressure/memory:1:some avg10=0.00 avg60=0.00 avg300=0.00 total=0
/proc/pressure/memory:2:full avg10=0.00 avg60=0.00 avg300=0.00 total=0
The total values are measured in µs, since bootup. The some lines sum up the the amount of time where there was at least some congestion, e.g. for CPU at least one process that would be able to use a CPU core could not get scheduled due to congestion. It could be seen as the times where the runqueue was filled up with too many tasks to handle.
The full metrics describe the time where no process could make progress due to a congestion, e.g. all processes waiting for memory while the kernel was OOMing processes.
The rate of the totals, in seconds, can be interpreted as a percentage of congestion. E.g. if per second 0.5s had some congestion then the system was congested on CPU ~50% of the overall time.
This is exactly what the first 3 values measure: avg300 is the same as rate(...._total_seconds[5m]) * 100 (and avg60 = rate(....[1m]), avg10 would be rate(...[10s]). I would thus recommend to only export the totals.
I have patched our ubuntu based 4.18 kernel with the latest PSI patches and put it into a custom procfs / node_exporter build. Here is an example screenshot of the CPU metric while building said kernel with make -j64 on a 32 core machine:
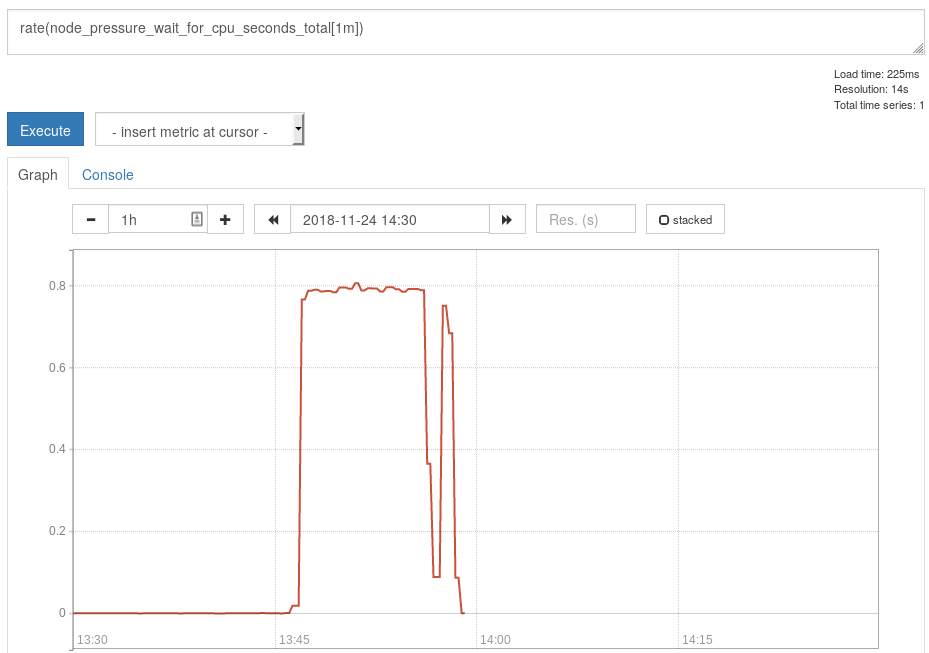
The big dip on CPU congestion was caused by an IO congestion. And 80% of the time there was _some_ congestion (at least one process could not get scheduled). The node_load1 metric over the same period was hovering around ~77.
I screwed up the naming as I needed this graph to fully understand how the metrics work but I've uploaded my procfs patch and node_exporter patch for reference (it does contain a procfs test fixture that might be interesting).
It would be great to have this metric available in node_exporter.
 rtreffer
All 7 comments
Nice, very interesting data. It's too bad they don't just expose the data in Prometheus format to begin with. ;-)
 SuperQ
on 26 Nov 2018
SuperQ
on 26 Nov 2018
With prometheus/procfs#126 resolved we should be able to start work on this. I'm hoping to have some time the coming week to do this.
 daenney
on 10 Feb 2019
daenney
on 10 Feb 2019
A bit of discussion before I get started; what do we want the time series to look like in the end (in text exposition format)?
We can access 3 resources, "memory", "io", and "cpu". Each expose 2 time shares of stats, the "some" and the "full". Each of those have 4 values of Avg10, Avg60, Avg300 and Total.
A similar metric type is the load average and I'm thinking we should base it on that. So you end up with gauges of the form node_psi_avg10, node_psi_avg60 and so on.
Now comes the question, should resource be a label or encoded in the time series name and similarly should the time shares be labels or encoded in the time series name? I.e, do we want:
node_psi_avg10{resource="memory",time="full"} 10
Or:
node_psi_memory_avg10{time="full"} 10
Perhaps the other way around
node_psi_some_avg10{resource="memory"} 10
Or even no labels at all and move time into the metric name and end up with node_psi_memory_some_avg10? That last one feels bad somehow.
There's also @rtreffer's point, should we even expose the avg ones or only expose the total (since we can have Prometheus calculate the rest)? If we only expose the total I suppose node_psi_total{resource="memory"} makes the most sense to me.
Also, what do we want to name these? "some" and "full" are not exactly descriptive. @rtreffer uses wait_for_cpu_seconds_total and pause_for_cpu_seconds_total in his example. I'm kind of onboard with that, except for the _for_, but it's not immediately obvious what the difference between wait and pause is if you're not familiar with this. Does anyone have any other suggestions w.r.t what we could call them? This also still begs the question whether the resource should be part of the metric name or a label.
daenney
on 11 Feb 2019
We shouldn't include the Avg* metrics at all. For Prometheus use, we only need the total counters.
I would suggest node_pressure_cpu_waiting_seconds_total and node_pressure_cpu_stalled_seconds_total.
EDIT: Another way to make it more in line with the upstream name would be node_pressure_cpu_some_waiting_seconds_total.
EDIT2: Added _pressure_ to indicate that the metrics are coming from /proc/pressure. Yes, it's more verbose than _psi_, but it will match the procfile and collector name.
SuperQ
on 11 Feb 2019
Ah yeah, that works. Thanks for the feedback!
I think if we have "waiting" and "stalled" I'd prefer to exclude the "some" and "full". It doesn't help much as far as comprehension goes and mostly just reflects an implementation detail of the procfs interafce.
daenney
on 11 Feb 2019
I don't understand how total metric is calculated for n number of processes. Can anybody help me out with this?
 Gurucharan21
on 17 May 2019
Gurucharan21
on 17 May 2019
@Gurucharan21 This isn't something we're calculating, it's exposed straight from the Linux kernel. Documentation around that can be found in a few places:
- https://lwn.net/Articles/759658/
- https://www.kernel.org/doc/Documentation/accounting/psi.txt
- https://facebookmicrosites.github.io/psi/
- https://kernelnewbies.org/Linux_4.20#Pressure_stall_information_for_better_overview_of_system_load
- https://www.google.com/search?q=linux+pressure+stall+information
https://major.io/2019/01/27/using-the-pressure-stall-information-interface-in-kernel-4.20/ has a fairly simple introduction to these values.
It's also not about "n processes", it's all processes. The only way to get it for a group of processes would be through cgroups2 which this code doesn't support yet.
However, the issue tracker really isn't the place for usage related questions. Please defer to the mailing lists for that.
daenney
on 17 May 2019
Related issues
 cjroebuck
·
3Comments
cjroebuck
·
3Comments
 fchiorascu
·
3Comments
fchiorascu
·
3Comments
 dorkmatt
·
3Comments
dorkmatt
·
3Comments
 alexandrul
·
3Comments
alexandrul
·
3Comments
 mhansen
·
4Comments
mhansen
·
4Comments
Most helpful comment
Nice, very interesting data. It's too bad they don't just expose the data in Prometheus format to begin with. ;-)