NLog version: 4.6.4
Platform: .NET Core 2.2.7 Linux
Current NLog config (xml or C#, if relevant)
```F#
let configureLogging (logLevel: LogLevel) =
LayoutRenderer.Register
LayoutRenderer.Register
let hostSite = Environment.getEnvironmentVariable "HostSite" (Some "local")
let logLayoutString = sprintf "${longdate}|${level:uppercase=true}|${logger}|${host-site:%s}${corr}|${message}" hostSite
let config = new LoggingConfiguration()
let cLayout = Layout.FromString(logLayoutString);
let consoleTarget = new ConsoleTarget( Name = "logToConsole", Layout = cLayout)
let bufferedTarget = new Targets.Wrappers.AsyncTargetWrapper(consoleTarget, 10000, Wrappers.AsyncTargetWrapperOverflowAction.Block)
config.LoggingRules.Add(new LoggingRule("*", logLevel, bufferedTarget))
LogManager.Configuration <- config
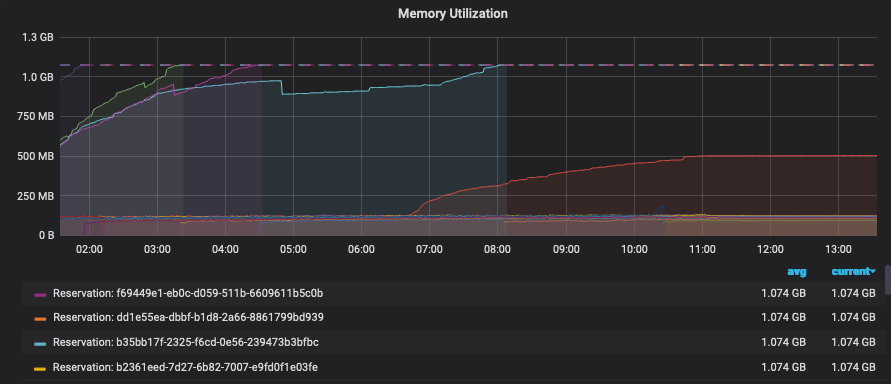
During a soak test we discovered that at a certain threshold memory would climb for some processes and OOM.
I was able to create a coredump of the process. Upon inspection there were over 1100 blocked threads. I dumped the stack for these and found the following:
00007F85D2FFA3A0 00007f86746a09f3 [HelperMethodFrame_1OBJ: 00007f85d2ffa3a0] System.Threading.Monitor.ObjWait(Boolean, Int32, System.Object)
00007F85D2FFA4D0 00007F85FE7F08B0 NLog.Targets.Wrappers.ConcurrentRequestQueue.WaitForBelowRequestLimit()
00007F85D2FFA500 00007F85FCF5B2AF NLog.Targets.Wrappers.ConcurrentRequestQueue.Enqueue(NLog.Common.AsyncLogEventInfo)
00007F85D2FFA570 00007F85FCF55E96 NLog.Targets.Wrappers.AsyncTargetWrapper.Write(NLog.Common.AsyncLogEventInfo)
00007F85D2FFA5B0 00007F85FCF55DC2 NLog.Targets.Wrappers.AsyncTargetWrapper.WriteAsyncThreadSafe(NLog.Common.AsyncLogEventInfo)
00007F85D2FFA5F0 00007F85FCF559C5 NLog.Targets.Target.WriteAsyncLogEvent(NLog.Common.AsyncLogEventInfo)
00007F85D2FFA660 00007F85FCF5537E NLog.LoggerImpl.WriteToTargetWithFilterChain(NLog.Targets.Target, NLog.Filters.FilterResult, NLog.LogEventInfo, NLog.Common.AsyncContinuation)
00007F85D2FFA690 00007F85FCF54AFC NLog.LoggerImpl.Write(System.Type, NLog.Internal.TargetWithFilterChain, NLog.LogEventInfo, NLog.LogFactory)
...
...
...
We suspected it may be an issue with the `ConcurrentRequestQueue` and we changed our configuration to the following

```F#
let configureLogging (logLevel: LogLevel) =
    LayoutRenderer.Register<HostSiteLayoutRenderer>("host-site");
    LayoutRenderer.Register<CorrelationLayoutRenderer>("corr");
    let hostSite = Environment.getEnvironmentVariable "HostSite" (Some "local")
    let logLayoutString = sprintf "${longdate}|${level:uppercase=true}|${logger}|${host-site:%s}${corr}|${message}" hostSite
    let config = new LoggingConfiguration()
    let cLayout = Layout.FromString(logLayoutString);
    let consoleTarget = new ConsoleTarget( Name = "logToConsole", Layout = cLayout)
    let bufferedTarget = new Targets.Wrappers.AsyncTargetWrapper(consoleTarget, 200, Wrappers.AsyncTargetWrapperOverflowAction.Block)
    bufferedTarget.ForceLockingQueue <- true
    config.LoggingRules.Add(new LoggingRule("*", logLevel, bufferedTarget))
    LogManager.Configuration <- config
When we did another soak test we found the issue to have resolved.
 taion809
All 27 comments
Hi! Thanks for opening your first issue here! Please make sure to follow the issue template - so we could help you better!
![welcome[bot] picture](https://avatars.githubusercontent.com/in/4141?v=4&s=40) welcome[bot]
on 11 Oct 2019
welcome[bot]
on 11 Oct 2019
Do you mean "ForceLockingQueue=true" (C# syntax ;)) solved the issue here?
 304NotModified
on 11 Oct 2019
304NotModified
on 11 Oct 2019
Yes, sorry 😅
taion809
on 11 Oct 2019
@taion809 And you are completely sure it is NLog 4.6.4 that is deployed (and not an earlier version) ?
Anyway created #3622 that removes any attempts in being smart. Consumer-thread now always pulses producers (And not just when being busy).
When NLog 4.6.8 is released, then I would be really happy if you could try this version with ForceLockingQueue=false. There are already pre-release nuget-packages ready here (See NLog.4.6.7.10625-PR3622.nupkg):
https://ci.appveyor.com/project/nlog/nlog/builds/28056047/artifacts
 snakefoot
on 11 Oct 2019
snakefoot
on 11 Oct 2019
Hi,
We're sure we're on 4.6.4, as a sort of twist we're seeing that ForceLockingQueue=true does lead to a similar issue but the climb is much much slower. We're still investigating on our side as well.
Thanks :)
OS Thread Id: 0x10d
        Child SP               IP Call Site
00007F66A67461D0 00007f67226209f3 [GCFrame: 00007f66a67461d0]
00007F66A67462B0 00007f67226209f3 [HelperMethodFrame_1OBJ: 00007f66a67462b0] System.Threading.Monitor.ObjWait(Boolean, Int32, System.Object)
00007F66A67463E0 00007F66AAEBB1AA NLog.Targets.Wrappers.AsyncRequestQueue.Enqueue(NLog.Common.AsyncLogEventInfo)
00007F66A6746450 00007F66AAEB3BF6 NLog.Targets.Wrappers.AsyncTargetWrapper.Write(NLog.Common.AsyncLogEventInfo)
00007F66A6746490 00007F66AAEB39D2 NLog.Targets.Wrappers.AsyncTargetWrapper.WriteAsyncThreadSafe(NLog.Common.AsyncLogEventInfo)
00007F66A67464D0 00007F66AAEB3685 NLog.Targets.Target.WriteAsyncLogEvent(NLog.Common.AsyncLogEventInfo)
00007F66A6746540 00007F66AAEB31EE NLog.LoggerImpl.WriteToTargetWithFilterChain(NLog.Targets.Target, NLog.Filters.FilterResult, NLog.LogEventInfo, NLog.Common.AsyncContinuation)
00007F66A6746570 00007F66AAEB27DC NLog.LoggerImpl.Write(System.Type, NLog.Internal.TargetWithFilterChain, NLog.LogEventInfo, NLog.LogFactory)
00007F66A67465E0 00007F66ABA9BCAD [email protected](System.String)
00007F66A6746620 00007F66ABA9B746 Core.Diagnostics+logElapsed@33-2[[System.__Canon, System.Private.CoreLib]].Invoke(System.__Canon)
00007F66A6746670 00007F66A92E9925 Microsoft.FSharp.Control.AsyncPrimitives.CallThenInvokeNoHijackCheck[[System.__Canon, System.Private.CoreLib],[System.__Canon, System.Private.CoreLib]](Microsoft.FSharp.Control.AsyncActivation`1<System.__Canon>, Microsoft.FSharp.Core.FSharpFunc`2<System.__Canon,Microsoft.FSharp.Control.FSharpAsync`1<System.__Canon>>, System.__Canon)
00007F66A67466B0 00007F66A7C212F3 Microsoft.FSharp.Control.Trampoline.Execute(Microsoft.FSharp.Core.FSharpFunc`2<Microsoft.FSharp.Core.Unit,Microsoft.FSharp.Control.AsyncReturn>) [E:\A\_work\130\s\src\fsharp\FSharp.Core\async.fs @ 109]
00007F66A6746700 00007F66AB9E314B <StartupCode$FSharp-Core>.$Async.once@1106[[System.__Canon, System.Private.CoreLib],[System.__Canon, System.Private.CoreLib]](Microsoft.FSharp.Control.AsyncActivation`1<System.__Canon>, System.Threading.Thread, Microsoft.FSharp.Control.Latch, Microsoft.FSharp.Core.FSharpRef`1<Boolean>, Microsoft.FSharp.Core.FSharpRef`1<Microsoft.FSharp.Core.FSharpOption`1<Microsoft.FSharp.Core.FSharpFunc`2<Microsoft.FSharp.Core.Unit,Microsoft.FSharp.Control.AsyncReturn>>>, Microsoft.FSharp.Core.FSharpFunc`2<System.__Canon,Microsoft.FSharp.Control.AsyncReturn>, System.__Canon)
00007F66A6746740 00007F66AB9E2F42 <StartupCode$FSharp-Core>.$Async+once@1106-1T[[System.__Canon, System.Private.CoreLib],[System.__Canon, System.Private.CoreLib]].Invoke(Microsoft.FSharp.Core.FSharpFunc`2<System.__Canon,Microsoft.FSharp.Control.AsyncReturn>, System.__Canon)
00007F66A67467B0 00007F66AB9E2E36 Marvel.AsyncExtensions+AsyncOps+awaitTaskCancellationAsError@106-3[[System.__Canon, System.Private.CoreLib]].Invoke(System.Threading.Tasks.Task`1<System.__Canon>)
00007F66A67467D0 00007F66A76134DD System.Threading.ExecutionContext.RunInternal(System.Threading.ExecutionContext, System.Threading.ContextCallback, System.Object) [/root/coreclr/src/mscorlib/shared/System/Threading/ExecutionContext.cs @ 167]
00007F66A6746830 00007F66A76D7D4C System.Threading.Tasks.Task.ExecuteWithThreadLocal(System.Threading.Tasks.Task ByRef) [/root/coreclr/src/mscorlib/src/System/Threading/Tasks/Task.cs @ 2421]
00007F66A67468C0 00007F66A7710588 System.Threading.ThreadPoolWorkQueue.Dispatch() [/root/coreclr/src/mscorlib/src/System/Threading/ThreadPool.cs @ 588]
00007F66A6746C90 00007f6720dc617f [DebuggerU2MCatchHandlerFrame: 00007f66a6746c90]
Have you checked the NLog InternalLogger for any warnings or errors? Maybe all threads are blocking because of issues in the console target.
Are other parts of the application using the Console.Writeline directly without using NLog? The console is by default not threadsafe.
How many cores does the machine have? Running more than double amount of threads will slowly cause everything to halt.
Why are you writing to the console instead of a file? If writing many logevents per second then the console is not the fastest
How many times during your application lifetime do you call the configureLogging-method? Single time at application startup? Once for every thread-startup? Once for every class? Once for every request? Once for every LogEvent?
snakefoot
on 15 Oct 2019
Have created PR #3635 where more love and care is implemented for the Console-Target.
Also introduces a new parameter WriteBuffer=true that will reduce memory-allocations and improve speed when wrapped using AsyncWrapper.
snakefoot
on 20 Oct 2019
Maybe the issue is the following:
- 10 Threads attacks the async-console-target. Async-background-writer falls behind because console is slow. OverflowAction block causes 10 threads to get stuck waiting for async-background-writer to catch up.
- NLog Configuration is reloaded. AsyncWrapper is closed (and stops async-background-writer), but never releases any of the threads being stuck inside waiting for queue. New async-console-target is created.
- 10 new threads attacks the new async-console-target. Story repeats itself until having 1100 threads stuck inside old async-console-target-objects.
Will try and make an unit-test that reproduces this issue.
snakefoot
on 20 Oct 2019
Created PR #3636 with a unit-test and and a fix for the above scenario.
snakefoot
on 20 Oct 2019
Thanks for the help, we will try to use 4.6.8 once it's released.
Have you checked the NLog InternalLogger for any warnings or errors?
We just enabled this, we'll rerun our soak test and post the results
Are other parts of the application using the Console.Writeline directly without using NLog?
no
How many cores does the machine have?
16 cores
Why are you writing to the console instead of a file?
We write to stdout, we're running in docker and our infrastructure consumes these and forwards them to splunk.
How many times during your application lifetime do you call the
configureLogging
Once on startup
taion809
on 21 Oct 2019
@taion809 We write to stdout and stderr
How do you write to both stdout and stderr? See only one console-target in your example config
snakefoot
on 21 Oct 2019
sorry in this service we're only logging to stdout, i'll edit my previous comment :)
taion809
on 21 Oct 2019
Have you checked the NLog InternalLogger for any warnings or errors? We just enabled this, we'll rerun our soak test and post the results
Please use internalLogLevel=Debug, this should keep the amount of logging to a reasonable level, but also provide good detail of what is happening.
snakefoot
on 21 Oct 2019
@taion809 We just enabled this, we'll rerun our soak test and post the results
Any luck in capturing NLog InternalLogger output to a file, that we can look at?
snakefoot
on 24 Oct 2019
@taion809 NLog ver. 4.6.8 is very close to be released.
It would be very helpful if you could try this pre-release to verify if it resolves your issues:
https://ci.appveyor.com/project/nlog/nlog/builds/28449686/artifacts (Download NLog.4.6.7.10711-PR3653.nupkg)
It also includes this PR #3635, that improves the console-target performance with 200 pct. when enabling the target-setting WriteBuffer = true.
Please perform the soak-test with ForceLockingQueue=false.
snakefoot
on 30 Oct 2019
I assume this is fixed with 4.6.8, so closing for now.
304NotModified
on 4 Nov 2019
NLog ver. 4.6.8 has been released on nuget:
snakefoot
on 4 Nov 2019
Sorry this has taken me a long time to respond!
We're running with 4.6.8 and we are still running into deadlocks
OS Thread Id: 0x17f
        Child SP               IP Call Site
00007FEB93AD61E0 00007febab1e39f3 [GCFrame: 00007feb93ad61e0]
00007FEB93AD62C0 00007febab1e39f3 [HelperMethodFrame_1OBJ: 00007feb93ad62c0] System.Threading.Monitor.ObjWait(Boolean, Int32, System.Object)
00007FEB93AD63F0 00007FEB35342342 NLog.Targets.Wrappers.ConcurrentRequestQueue.WaitForBelowRequestLimit()
00007FEB93AD6430 00007FEB33B0D78F NLog.Targets.Wrappers.ConcurrentRequestQueue.Enqueue(NLog.Common.AsyncLogEventInfo)
00007FEB93AD64A0 00007FEB33B079A6 NLog.Targets.Wrappers.AsyncTargetWrapper.Write(NLog.Common.AsyncLogEventInfo)
00007FEB93AD64E0 00007FEB33B078D2 NLog.Targets.Wrappers.AsyncTargetWrapper.WriteAsyncThreadSafe(NLog.Common.AsyncLogEventInfo)
00007FEB93AD6520 00007FEB33B07455 NLog.Targets.Target.WriteAsyncLogEvent(NLog.Common.AsyncLogEventInfo)
00007FEB93AD6590 00007FEB33B070AE NLog.LoggerImpl.WriteToTargetWithFilterChain(NLog.Targets.Target, NLog.Filters.FilterResult, NLog.LogEventInfo, NLog.Common.AsyncContinuation)
00007FEB93AD65C0 00007FEB33B068AC NLog.LoggerImpl.Write(System.Type, NLog.Internal.TargetWithFilterChain, NLog.LogEventInfo, NLog.LogFactory)
00007FEB93AD6630 00007FEB3472846D [email protected](System.String)
00007FEB93AD6670 00007FEB340C959B [email protected](Microsoft.FSharp.Core.Unit) [/app/src/App/Logging.fs @ 261]
00007FEB93AD66F0 00007FEB3082533A Microsoft.FSharp.Control.AsyncPrimitives.CallThenInvoke[[System.__Canon, System.Private.CoreLib],[System.__Canon, System.Private.CoreLib]](Microsoft.FSharp.Control.AsyncActivation`1<System.__Canon>, System.__Canon, Microsoft.FSharp.Core.FSharpFunc`2<System.__Canon,Microsoft.FSharp.Control.FSharpAsync`1<System.__Canon>>)
00007FEB93AD6750 00007FEB30824AC3 Microsoft.FSharp.Control.Trampoline.Execute(Microsoft.FSharp.Core.FSharpFunc`2<Microsoft.FSharp.Core.Unit,Microsoft.FSharp.Control.AsyncReturn>)
00007FEB93AD67A0 00007FEB340C919B Microsoft.FSharp.Control.AsyncPrimitives+taskContinueWithUnit@1006.Invoke(System.Threading.Tasks.Task)
00007FEB93AD67D0 00007FEB302134DD System.Threading.ExecutionContext.RunInternal(System.Threading.ExecutionContext, System.Threading.ContextCallback, System.Object)
00007FEB93AD6830 00007FEB302D7D4C System.Threading.Tasks.Task.ExecuteWithThreadLocal(System.Threading.Tasks.Task ByRef)
00007FEB93AD68C0 00007FEB30310588 System.Threading.ThreadPoolWorkQueue.Dispatch()
00007FEB93AD6C90 00007feba998917f [DebuggerU2MCatchHandlerFrame: 00007feb93ad6c90]
Did you activate writeBuffer=true for the console target?
Think you have to include the NLog internal Logger at debug level to see what might fail. NLog can handle a huge amount of logging, but it will not be fast if a target is slow or failing. (If the internal logger at debug-level gives too much performance hit, then info-level might also reveal something).
snakefoot
on 23 Nov 2019
Running our test again it _looks_ like enabling writeBuffer=true may have helped as we're running into other issues now. We'll continue to monitor. Thanks!
taion809
on 25 Nov 2019
@taion809 Must admit it doesn't sound very high performance to have 1000 concurrent threads running. They will only spend time on context switching, instead of completing their expected task.
I notice that you have HostSiteLayoutRenderer and CorrelationLayoutRenderer. If you add [ThreadSafe]-attribute like this:
```c#
using NLog.Config;
using NLog.LayoutRenderers;
[LayoutRenderer("host-site")]
[ThreadSafe]
public class HostSiteLayoutRenderer : LayoutRenderer
{
}
[LayoutRenderer("corr")]
[ThreadSafe]
public class CorrelationLayoutRenderer : LayoutRenderer
{
}
```
Then you will allow the NLog-engine to skip using global-lock when writing to NLog-target, and it will improve concurrency performance even more.
Ofcourse it requires that your custom LayoutRenderer are threadsafe and supports concurrent threads.
snakefoot
on 25 Nov 2019
@taion809 Must admit it doesn't sound very high performance to have 1000 concurrent threads running. They will only spend time on context switching, instead of completing their expected task.
I agree, the thread pool starts off much much lower than this. During the operation of the service, when this issue manifests, we see the thread pool increase unbounded until the process eventually crashes.
I notice that you have HostSiteLayoutRenderer and CorrelationLayoutRenderer. If you add [ThreadSafe]-attribute like this:
Thanks I'll take a look at this as well :)
taion809
on 25 Nov 2019
@taion809 Have your issues with NLog been resolved, so we can close this issue?
snakefoot
on 28 Nov 2019
Please add the requested info, so we could help you better! (This issue will be closed in 7 days)
![repo-ranger[bot] picture](https://avatars.githubusercontent.com/in/11906?v=4&s=40) repo-ranger[bot]
on 2 Dec 2019
repo-ranger[bot]
on 2 Dec 2019
I think this can be closed, we havent seen this pop back up after having enabled buffered writes. Thanks for all the help and hard work!
taion809
on 3 Dec 2019
Hi,
We're running into same issue with NLog 4.7.6.
We have the following NLog.config:
<?xml version="1.0" encoding="utf-8" ?>
<nlog xmlns="http://www.nlog-project.org/schemas/NLog.xsd"
      xmlns:xsi="http://www.w3.org/2001/XMLSchema-instance"
      xmlns:sl="http://www.nlog-project.org/schemas/NLog.Targets.Syslog.xsd"
      autoReload="true"
      throwConfigExceptions="true"
      throwExceptions="false"
      internalLogLevel="Info"
      internalLogToConsole="true">

    <!-- enable asp.net core layout renderers -->
    <extensions>
        <add assembly="NLog.Web.AspNetCore"/>
    </extensions>

    <!-- the targets to write to -->
    <targets>
        <target name="default-async" xsi:type="AsyncWrapper" overflowAction="Block" queueLimit="50000">
            <target xsi:type="Console" name="default" WriteBuffer="true"
                    layout="[${longdate} ${event-properties:item=EventId_Id} ${uppercase:${level}}] ${message} [${mdlc:RequestGuid}] ${logger} ${exception:format=tostring}" />
        </target>
        <target name="own-web-async" xsi:type="AsyncWrapper" overflowAction="Block" queueLimit="50000">
            <target xsi:type="Console" name="own-web" WriteBuffer="true"
                    layout="[${longdate} ${event-properties:item=EventId_Id} ${uppercase:${level}}] ${message} ${aspnet-mvc-action} ${aspnet-request-url} [${mdlc:RequestGuid}] ${logger} ${exception:format=tostring}" />
        </target>
    </targets>

    <!-- rules to map from logger name to target -->
    <rules>
        <logger name="Microsoft.*" writeTo="own-web-async" final="true">
            <filters defaultAction='Log'>
                <when condition="contains('${aspnet-request-url}', '/health/')" action="Ignore" />
                <when condition="ends-with('${aspnet-request-url}', '/metrics')" action="Ignore" />
            </filters>
        </logger>
        <logger name="*" writeTo="default-async" />
    </rules>
</nlog>
Under heavy load (about 10k rps, where single request itself makes many writes) we get a "deadlock" with the following stacktrace:
Monitor.Wait() at C:\Users\User\AppData\Roaming\JetBrains\Rider2020.3\resharper-host\SourcesCache\3BB42FD3-8BD8-407B-9667-FBF8CE1367E9\199\Monitor.cs:line 177
Monitor.Wait() at C:\Users\User\AppData\Roaming\JetBrains\Rider2020.3\resharper-host\SourcesCache\3BB42FD3-8BD8-407B-9667-FBF8CE1367E9\199\Monitor.cs:line 197
ConcurrentRequestQueue.WaitForBelowRequestLimit() at C:\Users\User\AppData\Roaming\JetBrains\Rider2020.3\resharper-host\SourcesCache\BC58F7AA-B054-4B56-909C-6485BD28CE06\52\ConcurrentRequestQueue.cs:line 139
ConcurrentRequestQueue.Enqueue() at C:\Users\User\AppData\Roaming\JetBrains\Rider2020.3\resharper-host\SourcesCache\BC58F7AA-B054-4B56-909C-6485BD28CE06\52\ConcurrentRequestQueue.cs:line 106
AsyncTargetWrapper.Write() at C:\Users\User\AppData\Roaming\JetBrains\Rider2020.3\resharper-host\SourcesCache\BC58F7AA-B054-4B56-909C-6485BD28CE06\4E\AsyncTargetWrapper.cs:line 433
AsyncTargetWrapper.WriteAsyncThreadSafe()
Target.WriteAsyncLogEvent()
LoggerImpl.WriteToTargetWithFilterChain()
LoggerImpl.Write()
Logger.WriteToTargets()
Logger.Log()
NLogLogger.Log<Microsoft.Extensions.Logging.LoggerMessage.LogValues<string, string>>()
Logger.<Log>g__LoggerLog|12_0<Microsoft.Extensions.Logging.LoggerMessage.LogValues<string, string>>()
Logger.Log<Microsoft.Extensions.Logging.LoggerMessage.LogValues<string, string>>()
LoggerMessage.<>c__DisplayClass9_0<string, string>.<Define>g__Log|0()
LoggerMessage.<>c__DisplayClass9_0<string, string>.<Define>b__1()
...
So no more output in console nor any new request get processed. But I call it a "deadlock" because when I change internalLogLevel to "Debug" then every second a line or few lines get appeared in console:
...
[2021-03-01 12:34:55.1975 1 INFO] Request starting HTTP/1.1 POST https://localhost:44302/api/dictionaries/GetDictionariesByRequests application/x-msgpack -  https://localhost/api/dictionaries/GetDictionariesByRequests [] Microsoft.AspNetCore.Hosting.Diagnos
tics
2021-03-01 12:34:56.1904 Debug Async queue is full
2021-03-01 12:34:56.1904 Debug Yielding because the overflow action is Block...
2021-03-01 12:34:56.2039 Debug Blocking because the overflow action is Block...
[2021-03-01 12:34:56.1904 1 INFO] Request starting HTTP/1.1 POST https://localhost:44302/api/dictionaries/GetDictionariesByRequests application/x-msgpack -  https://localhost/api/dictionaries/GetDictionariesByRequests [] Microsoft.AspNetCore.Hosting.Diagnos
tics
2021-03-01 12:34:57.1872 Debug Async queue is full
2021-03-01 12:34:57.1872 Debug Yielding because the overflow action is Block...
2021-03-01 12:34:57.1998 Debug Blocking because the overflow action is Block...
[2021-03-01 12:34:57.1872 1 INFO] Request starting HTTP/1.1 POST https://localhost:44302/api/dictionaries/GetDictionariesByRequests application/x-msgpack -  https://localhost/api/dictionaries/GetDictionariesByRequests [] Microsoft.AspNetCore.Hosting.Diagnos
tics
2021-03-01 12:34:58.1977 Debug Async queue is full
2021-03-01 12:34:58.1977 Debug Yielding because the overflow action is Block...
2021-03-01 12:34:58.2114 Debug Blocking because the overflow action is Block...
...
So it is not an issue perhaps but rather some logging overhead and/or misconfigured something. Please provide some recommendations.
On the other hand it would be nice if the queue limit hit does not block each next write, but the content of queue got processed instead unless it hit 90% of limit or so.
 meareindel
on 1 Mar 2021
meareindel
on 1 Mar 2021
Please open a new issue and link to this one, thanks!
304NotModified
on 1 Mar 2021
Related issues
 qaqz111
·
25Comments
qaqz111
·
25Comments
 kshkrao3
·
25Comments
kshkrao3
·
25Comments
 Fresa
·
33Comments
Fresa
·
33Comments
 longskikondi
·
35Comments
304NotModified
·
36Comments
longskikondi
·
35Comments
304NotModified
·
36Comments