Nlog: When target of type is Network,how to setting index of elastic?
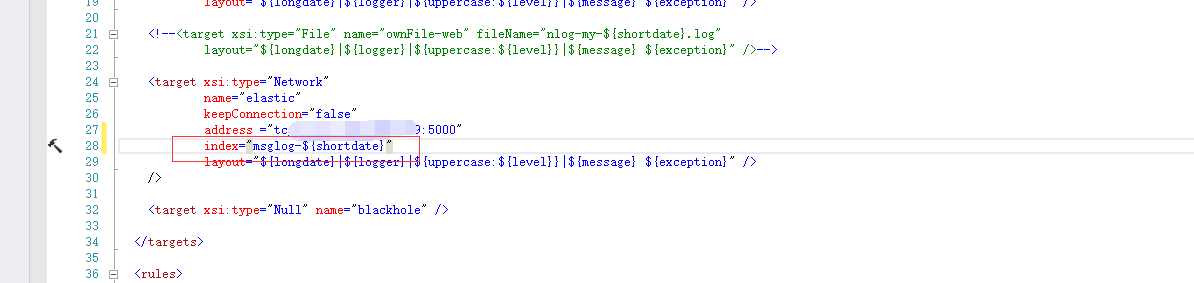
The config of source code:
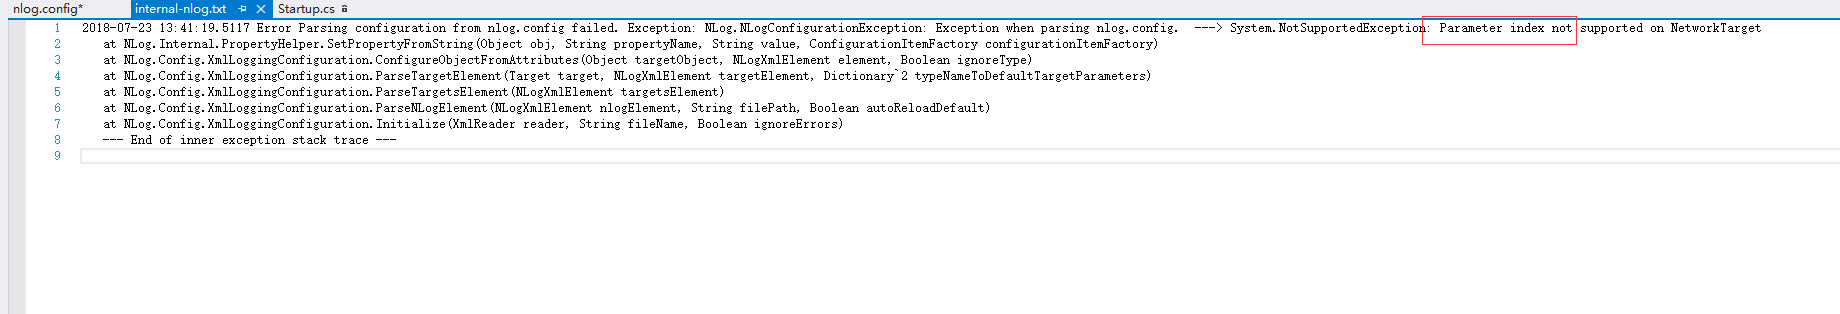
Error message:
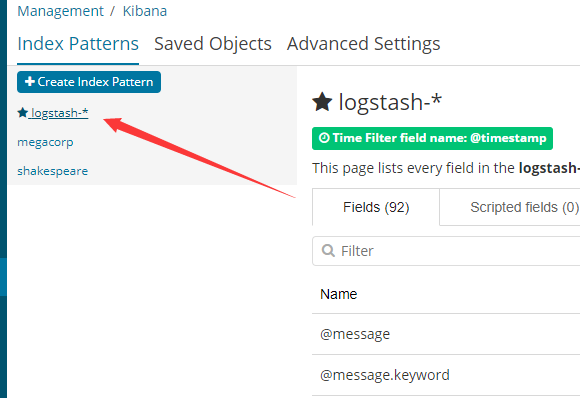
elk Kibana Index:
 moyuanhui
All 10 comments
I hope that I can specify different indexes according to the project.
moyuanhui
on 23 Jul 2018
Think you should take this to the support forum of LogStash for how to setup Index.
The NLog Network Target has no direct support for configuration of index (As you have discovered yourself).
 snakefoot
on 23 Jul 2018
snakefoot
on 23 Jul 2018
Think you should take this to the support forum of LogStash for how to setup Index.
Agree on this. We won't maintain Kibina/Logstash.
Closing this as we haven't the knowledge to help you on this one.
 304NotModified
on 23 Jul 2018
304NotModified
on 23 Jul 2018
OK, I have solved it. Thank you very much
moyuanhui
on 31 Jul 2018
Maybe share the solution you found? It might help others :)
snakefoot
on 31 Jul 2018
Hi @moyuanhui ,
Could you please share your solution for enabling index for Elastic Search. I am trying the same for Splunk index
 sujivisva
on 18 Nov 2020
sujivisva
on 18 Nov 2020
@sujivisva Different solutions for Splunk:
snakefoot
on 18 Nov 2020
Hi @snakefoot
Thanks for your response.
I am trying to do the Network target but with UDP protocol.
name="Splunk"
address="udp://
newLine="true"
layout="${level}|${logger}|${message}|{exception:format=tostring}">
However am not able to view any logs in splunk.
The problem is, I have a custom index created in splunk, not a default one.
How can I mention the index part in NLog network target configuration?
sujivisva
on 19 Nov 2020
@sujivisva This place is mostly issue about NLog, and not so much about communication-protocols with random external-systems like Splunk or Elastic. Maybe try Splunk-support-forum or StackOverflow?
snakefoot
on 19 Nov 2020
Hi @snakefoot ,
Thanks.!
This particular topic is about what I am trying to do exactly. And @moyuanhui has mentioned that he has solved the problem. Thats why trying to get his solution.
sujivisva
on 19 Nov 2020
Related issues
 geedsen
·
3Comments
geedsen
·
3Comments
 MaximRouiller
·
3Comments
MaximRouiller
·
3Comments
 Jerefeny
·
3Comments
Jerefeny
·
3Comments
 vasumsit
·
3Comments
vasumsit
·
3Comments
 smeegoan
·
3Comments
smeegoan
·
3Comments
Most helpful comment
Maybe share the solution you found? It might help others :)