Hey guys, how are you?
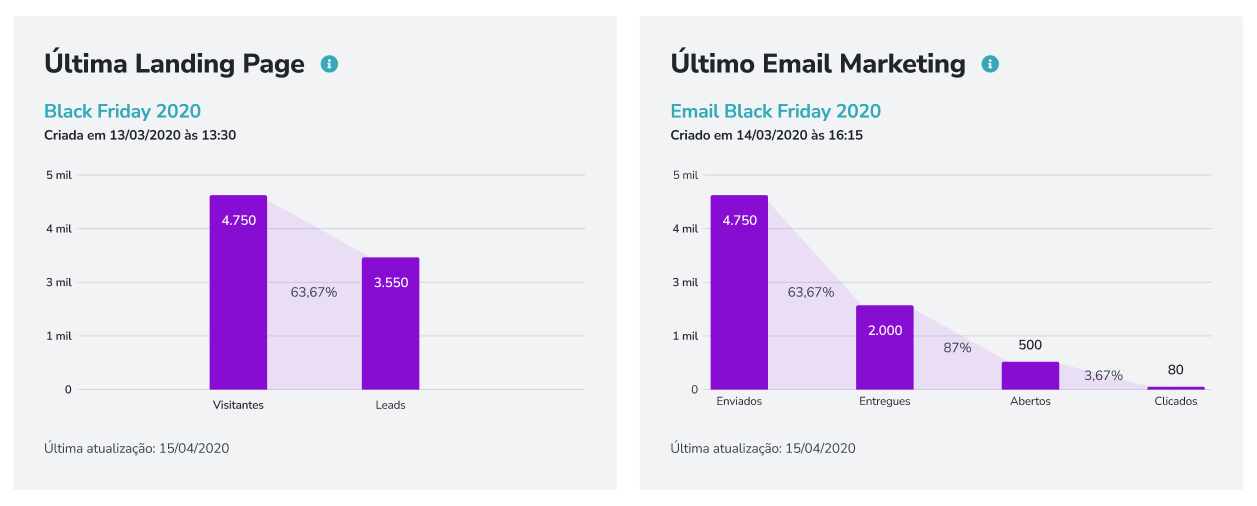
I need to give some alternatives to our designer, he drew this bar graph with an area indicating the percentage
I thought about exporting the Areas component in the line package, what do you think?
Because I don't know if this type of graph makes sense, or if so, I can try to implement it directly in the bar graph.
 sfiorotti
All 5 comments
You could achieve this with a custom layer passed to the Bar chart.
 wyze
on 17 Nov 2020
wyze
on 17 Nov 2020
Yes, but I saw an Areas component in the @nivo/line that could be reused here in this case, I just need it to be exported. makes sense? can I submit a PR?
sfiorotti
on 17 Nov 2020
I'm not sure if we want to be exporting internal components like that, @plouc?
I'm also not sure how helpful it would be to you given your requirements. It will draw the area under the lines for data you give it, which will be different than what you pass to the Bar chart. Given where the areas are drawn in related to your bars, I think it would be more work to reuse than component than to draw the paths manually.
wyze
on 17 Nov 2020
okay, i will make a custom layer, if this is interesting let me know i can put it in the @nivo/bar package! Thanks @wyze!
sfiorotti
on 17 Nov 2020
@sfiorotti I ran across this example which was helpful to me:
https://codesandbox.io/s/m4ro13jjn8
 ollwenjones
on 23 Nov 2020
ollwenjones
on 23 Nov 2020
Related issues
 dubzzz
·
3Comments
dubzzz
·
3Comments
 stahlmanDesign
·
3Comments
stahlmanDesign
·
3Comments
 pratikguru
·
3Comments
pratikguru
·
3Comments
 vagnervst
·
4Comments
vagnervst
·
4Comments
 p45mark
·
3Comments
p45mark
·
3Comments