Hello guys,
I'm trying to display negative values on a chart, they will display <
Regards,
 hybrisCole
All 12 comments
Hi @hybrisCole, on which chart? Some of them does not have y values :)
 plouc
on 6 Sep 2017
plouc
on 6 Sep 2017
Whoops just noticed I put
This is the code I'm testing with:
<Bar
              data={[
                {
                  country: "AD",
                  "hot dog": -103,
                  "hot dogColor": "hsl(66, 70%, 50%)",
                  burger: 188,
                  burgerColor: "hsl(227, 70%, 50%)",
                  sandwich: 100,
                  sandwichColor: "hsl(275, 70%, 50%)",
                  kebab: -167,
                  kebabColor: "hsl(330, 70%, 50%)",
                  fries: -175,
                  friesColor: "hsl(254, 70%, 50%)",
                  donut: 36,
                  donutColor: "hsl(157, 70%, 50%)"
                },
                {
                  country: "AE",
                  "hot dog": -119,
                  "hot dogColor": "hsl(83, 70%, 50%)",
                  burger: 192,
                  burgerColor: "hsl(181, 70%, 50%)",
                  sandwich: 13,
                  sandwichColor: "hsl(243, 70%, 50%)",
                  kebab: -24,
                  kebabColor: "hsl(323, 70%, 50%)",
                  fries: 144,
                  friesColor: "hsl(336, 70%, 50%)",
                  donut: 20,
                  donutColor: "hsl(325, 70%, 50%)"
                },
                {
                  country: "AF",
                  "hot dog": 100,
                  "hot dogColor": "hsl(270, 70%, 50%)",
                  burger: 164,
                  burgerColor: "hsl(319, 70%, 50%)",
                  sandwich: 47,
                  sandwichColor: "hsl(55, 70%, 50%)",
                  kebab: 169,
                  kebabColor: "hsl(166, 70%, 50%)",
                  fries: 85,
                  friesColor: "hsl(41, 70%, 50%)",
                  donut: -177,
                  donutColor: "hsl(133, 70%, 50%)"
                },
                {
                  country: "AG",
                  "hot dog": 96,
                  "hot dogColor": "hsl(354, 70%, 50%)",
                  burger: -189,
                  burgerColor: "hsl(70, 70%, 50%)",
                  sandwich: 153,
                  sandwichColor: "hsl(176, 70%, 50%)",
                  kebab: 25,
                  kebabColor: "hsl(102, 70%, 50%)",
                  fries: 88,
                  friesColor: "hsl(357, 70%, 50%)",
                  donut: 40,
                  donutColor: "hsl(186, 70%, 50%)"
                },
                {
                  country: "AI",
                  "hot dog": 125,
                  "hot dogColor": "hsl(45, 70%, 50%)",
                  burger: 68,
                  burgerColor: "hsl(285, 70%, 50%)",
                  sandwich: 100,
                  sandwichColor: "hsl(21, 70%, 50%)",
                  kebab: 39,
                  kebabColor: "hsl(115, 70%, 50%)",
                  fries: 200,
                  friesColor: "hsl(130, 70%, 50%)",
                  donut: -29,
                  donutColor: "hsl(50, 70%, 50%)"
                },
                {
                  country: "AL",
                  "hot dog": 110,
                  "hot dogColor": "hsl(209, 70%, 50%)",
                  burger: 11,
                  burgerColor: "hsl(248, 70%, 50%)",
                  sandwich: -141,
                  sandwichColor: "hsl(11, 70%, 50%)",
                  kebab: 21,
                  kebabColor: "hsl(326, 70%, 50%)",
                  fries: 199,
                  friesColor: "hsl(353, 70%, 50%)",
                  donut: 135,
                  donutColor: "hsl(227, 70%, 50%)"
                },
                {
                  country: "AM",
                  "hot dog": 36,
                  "hot dogColor": "hsl(160, 70%, 50%)",
                  burger: -32,
                  burgerColor: "hsl(69, 70%, 50%)",
                  sandwich: 89,
                  sandwichColor: "hsl(53, 70%, 50%)",
                  kebab: 18,
                  kebabColor: "hsl(194, 70%, 50%)",
                  fries: 67,
                  friesColor: "hsl(96, 70%, 50%)",
                  donut: 155,
                  donutColor: "hsl(350, 70%, 50%)"
                }
              ]}
              keys={[
                "hot dog",
                "burger",
                "sandwich",
                "kebab",
                "fries",
                "donut"
              ]}
              indexBy="country"
              margin={{
                top: 50,
                right: 60,
                bottom: 50,
                left: 60
              }}
              xPadding={0.2}
              groupMode="stacked"
              layout="vertical"
              colors="nivo"
              colorBy="id"
              axisBottom={{
                orient: "bottom",
                tickSize: 5,
                tickPadding: 5,
                tickRotation: 0,
                legend: "country",
                legendPosition: "center",
                legendOffset: 36
              }}
              axisLeft={{
                orient: "left",
                tickSize: 5,
                tickPadding: 5,
                tickRotation: 0,
                legend: "food",
                legendPosition: "center",
                legendOffset: -40
              }}
              enableGridX={false}
              enableGridY={true}
              enableLabels={true}
              labelsTextColor="inherit:darker(1.6)"
              labelsLinkColor="inherit"
              animate={true}
              motionStiffness={90}
              motionDamping={15}
              isInteractive={true}
              width={1127}
              height={600}
            />
These negative values won't appear on the
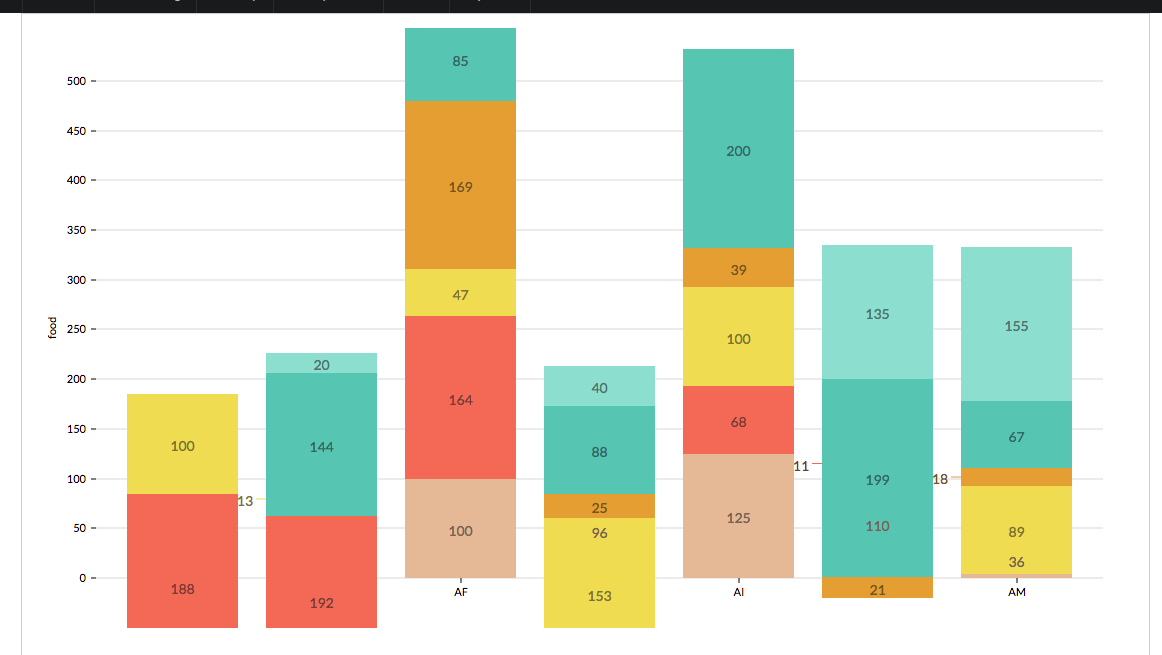
So it seems that some values are like gone or just not being displayed, if this is not the right Graph, which one would you recommend me to display "Weekly Money Win/Loss for each customer"? I guess I could try a
Regards,
hybrisCole
on 6 Sep 2017
The bar chart supports minValue, maxValue props
plouc
on 6 Sep 2017
But you should upgrade to [email protected], also note that xPadding is now padding, and perhaps add a marker at 0
plouc
on 6 Sep 2017
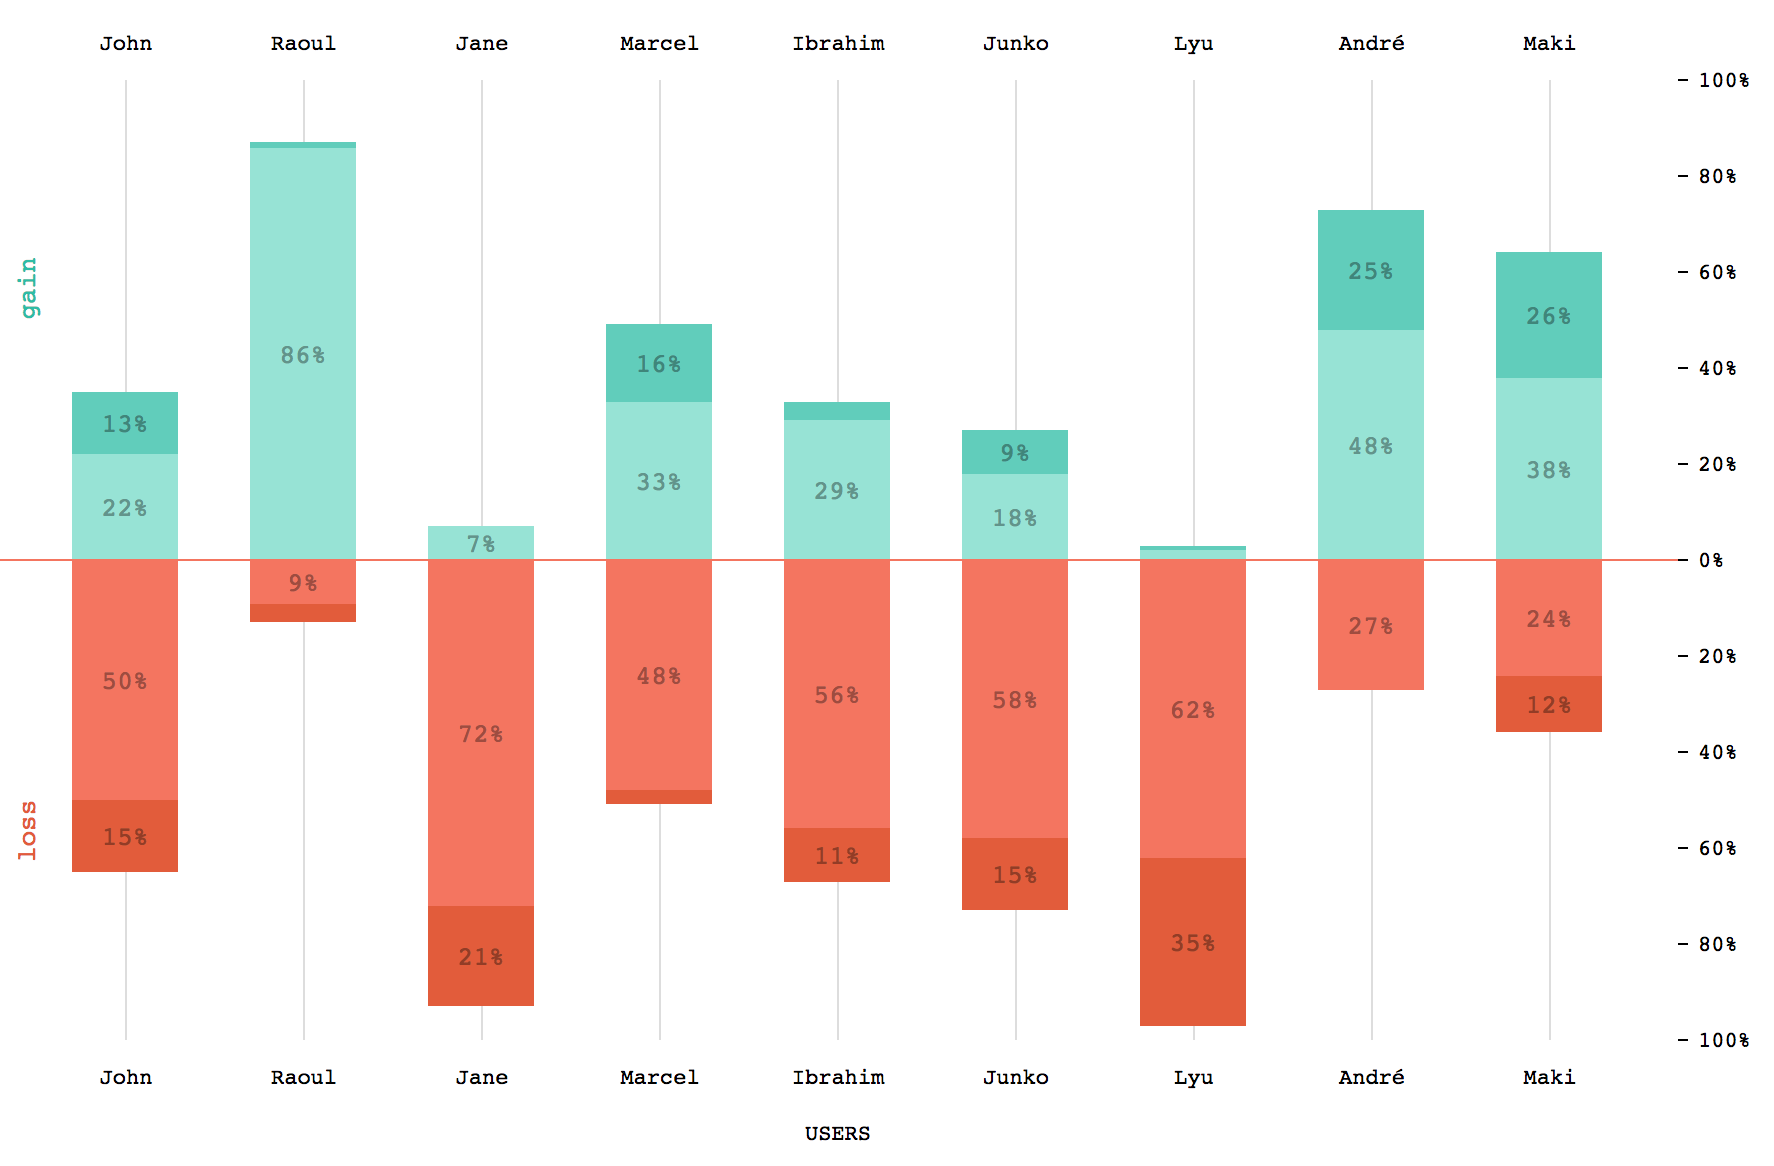
But the result isn't good, the values are stacked, and you want them to diverge at 0, I've tried something here: https://www.webpackbin.com/bins/-KtNgP-32oM9zRHagHMX
plouc
on 6 Sep 2017
Hum… the bar chart is the best option, but not as it is, I think I have to add support for setting y0 and y1 with y0 being 0 if no value provided
plouc
on 6 Sep 2017
Or just add a divergeAt option, so in your case you should set it to 0
plouc
on 6 Sep 2017
Thank you, I tried what you said, looks better but still won't display negative values
hybrisCole
on 7 Sep 2017
Available in [email protected], see the corresponding example in the storybook.
plouc
on 8 Sep 2017
plouc
on 8 Sep 2017
@plouc great package of course.
Just wanted to confirm we'll have to calculate min/max on the fly ourselves and pass those into the relevant props?
 acomito
on 11 Sep 2018
acomito
on 11 Sep 2018
@acomito, you can use auto for both.
plouc
on 11 Sep 2018
Related issues
 zhe1ka
·
3Comments
zhe1ka
·
3Comments
 danpettay
·
3Comments
danpettay
·
3Comments
 cedmax
·
4Comments
cedmax
·
4Comments
 Buvaneshkumar7
·
3Comments
Buvaneshkumar7
·
3Comments
 gcloeval
·
3Comments
gcloeval
·
3Comments
Most helpful comment