Ngx-charts: unable to sort values in x-axis for line chart
When i am trying to replicate something like this : https://swimlane.gitbooks.io/ngx-charts/content/charts/line-chart.html
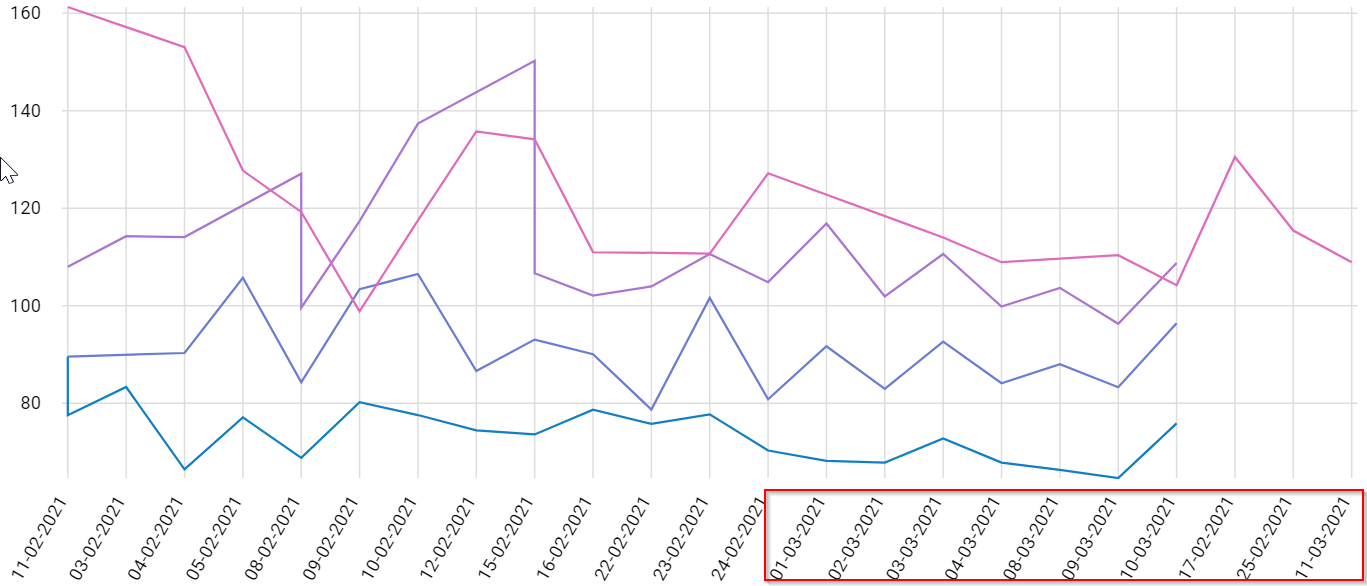
i am unable to sort the values on x - axis. the data is looking like 2000, 2001, 2002, 1999. but it should be 1999, 2000, 2001, 2002.
How to solve this?
 adithyasai
All 10 comments
I am having the same problem. My x-axis is as follows: 1 -> 5 -> 3 -> 4, when it should be 1 -> 3 -> 4 -> 5.
 ThomasEWilson
on 22 Jan 2018
ThomasEWilson
on 22 Jan 2018
Are you passing those values as strings, or numbers?
Strings:
export const single = [
  {
    name: '2',
    value: 40632
  },
  {
    name: '1',
    value: 49737
  },
  {
    name: '3',
    value: 36745
  }
]
Numbers:
export const single = [
  {
    name: 2,
    value: 40632
  },
  {
    name: 1,
    value: 49737
  },
  {
    name: 3,
    value: 36745
  }
]
If you are passing them as numbers, the should be sorted.
 marjan-georgiev
on 8 Apr 2018
marjan-georgiev
on 8 Apr 2018
I think there should be an option to not sort the x-axis since I might have pre-sorted data in the correct order but then when sorted automatically by the chart, they are in the wrong order.
 Cryptonious
on 14 Jun 2018
Cryptonious
on 14 Jun 2018
having a "name" property be the indicator of location on the x axis seems odd
 waterskier2007
on 23 Aug 2018
waterskier2007
on 23 Aug 2018
Any luck/ideas on affecting the order of any axis?
I have numbers in my data, I even made sure by logging typeof val in the formatting function; But no matter what I do the numbers are out of order on the Y scale for my heatmap. Screenshot: https://i.imgur.com/5oWUk4d.png
My console with the data: https://i.imgur.com/1eDwqUt.png
It seems to order the Y axis based on the available numbers within a series, so let's say a series has only Thursday-Friday-Saturday (because that's the times you are selecting in your range);
Then because of that, the axis will start with 4-5-6-7-1-2-3.
If I manually set the ticks to be an array of numbers (1-2-3-4-5-6-7) it doesn't override the order. How would I go about besides devising an algorithm to fill my first series with filler data points?
 sebastiangug
on 26 Apr 2019
sebastiangug
on 26 Apr 2019
To anyone who has run into sorting issues, the problem is easier than you think. Let's take this series for example:
[
{name: 'series one', value: 5 values},
{name: 'series two', value: 10 values}
]
This data will cause sorting issues because the array is a different length. Even if the first series has 5 values, it needs all 10 to show correctly.
 austinthedeveloper
on 22 Oct 2020
austinthedeveloper
on 22 Oct 2020
Are you passing those values as strings, or numbers?
Strings:
export const single = [
  {
    name: '2',
    value: 40632
  },
  {
    name: '1',
    value: 49737
  },
  {
    name: '3',
    value: 36745
  }
]
Numbers:
export const single = [
  {
    name: 2,
    value: 40632
  },
  {
    name: 1,
    value: 49737
  },
  {
    name: 3,
    value: 36745
  }
]
If you are passing them as numbers, the should be sorted.
What if I have formatted dates or something like that? How would one do the sorting?
 ddsultan
on 7 Nov 2020
ddsultan
on 7 Nov 2020
To anyone who has run into sorting issues, the problem is easier than you think. Let's take this series for example:
[
{name: 'series one', value: 5 values},
{name: 'series two', value: 10 values}
]This data will cause sorting issues because the array is a different length. Even if the first series has 5 values, it needs all 10 to show correctly.
In principle yes, but how do I deal with the situation where I don't have 10 values in the first series? i.e., I can't just set the missing values to zero, I actually do not have data for that series at that x value.
Is there a way in ngx-charts to specify that a value is missing?
 acgrama
on 16 Aug 2021
acgrama
on 16 Aug 2021
Are you passing those values as strings, or numbers?
Strings:export const single = [ { name: '2', value: 40632 }, { name: '1', value: 49737 }, { name: '3', value: 36745 } ]Numbers:
export const single = [
  {
    name: 2,
    value: 40632
  },
  {
    name: 1,
    value: 49737
  },
  {
    name: 3,
    value: 36745
  }
]
If you are passing them as numbers, the should be sorted.
What if I have formatted dates or something like that? How would one do the sorting?
Same case here, is there a way to deal with this gracefully via ngx-charts?
acgrama
on 16 Aug 2021
OK, seems like the best way I can find is to use unix milliseconds as x axis values, since they are then sorted correctly, and use the xAxisTickFormatting function to format the milliseconds into human-readable timestamps shows as labels.
acgrama
on 16 Aug 2021
Related issues
 molot1989
·
25Comments
molot1989
·
25Comments
 ssleptsov
·
35Comments
ssleptsov
·
35Comments
 sjdemoor
·
20Comments
sjdemoor
·
20Comments
 Enngage
·
22Comments
Enngage
·
22Comments
 GlauberF
·
20Comments
GlauberF
·
20Comments
Most helpful comment
Are you passing those values as strings, or numbers?
Strings:
Numbers:
If you are passing them as numbers, the should be sorted.