Ngx-charts: Expect text and unit font size could be customised in gauge chart
I'm submitting a ... (check one with "x")
[ ] bug report => search github for a similar issue or PR before submitting
[ x] feature request
[ ] support request => Please do not submit support request here
Current behavior
Expected behavior
Hopefully user can customise font size for these two labels, thanks
Reproduction of the problem
What is the motivation / use case for changing the behavior?
Please tell us about your environment:
ngx-charts version: x.x.x
Angular version: 2.x.x
Browser: [all | Chrome XX | Firefox XX | IE XX | Safari XX | Mobile Chrome XX | Android X.X Web Browser | iOS XX Safari | iOS XX UIWebView | iOS XX WKWebView ]
Language: [all | TypeScript X.X | ES6/7 | ES5]
 qiluo
qiluo
All 7 comments
The text and unit fonts automatically scale with the chart, so we can not allow overriding those without breaking responsiveness.
 marjan-georgiev
on 4 May 2017
marjan-georgiev
on 4 May 2017
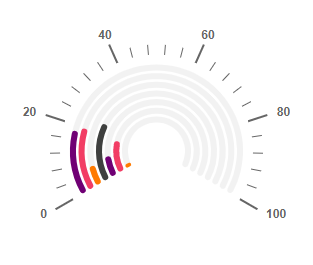
But if set showAxis=false, the inner texts (value and unit) would be very large
qiluo
on 8 May 2017
Yes, I agree with @qiluo this is how my gauge looks if I set showAxis=false.
https://plnkr.co/edit/CoCmJQd6eNNTTKUI7anq?p=preview

<ngx-charts-gauge
  [results]="base"
  [min]="0"
  [max]="100"
  [units]="'%'"
  [angleSpan]="180"
  [startAngle]="-90"
  [showAxis]="false"
  (select)="onSelect($event)">
 pmadhavan
on 27 Oct 2017
pmadhavan
on 27 Oct 2017
Please reopen if this is still an issue.
 Hypercubed
on 6 Aug 2018
Hypercubed
on 6 Aug 2018
Hello. I have this issue as well. I'm using the gauge chart to display my state of charge. Is there any way to just display the value with a % sign next to it? https://i.gyazo.com/95c75c7b15bab799fe840595ffc32e05.png
This is how it looks currently.
 mokhz
on 30 Jan 2019
mokhz
on 30 Jan 2019
Hello. I have this issue as well. I'm using the gauge chart to display my state of charge. Is there any way to just display the value with a % sign next to it? https://i.gyazo.com/95c75c7b15bab799fe840595ffc32e05.png
This is how it looks currently.
Hello again. I solved this issue by using valueFormatting. However, when I first used a valueFormatting function it started to kill the performance since I hadn't changed my ChangeDetectionStrategy, so make sure you use
changeDetection: ChangeDetectionStrategy.OnPush
mokhz
on 16 Feb 2019
I had a solution for hiding the Gauge chart middle text.
[scheme]="colorScheme"
[results]="radioData"
[min]="0"
[max]="100"
[angleSpan]="240"
[startAngle]="-120"
[bigSegments]="10"
[smallSegments]="5"
[tooltipDisabled]="false"
[valueFormatting]="hideShowText"
[animations]="animations" >
By using [valueFormatting]="hideShowText", in component part we need to write below function
hideShowText(showText){
//console.log(showText)
}
That's it data will hide
 vgreddyrontala
on 6 Oct 2020
vgreddyrontala
on 6 Oct 2020
Related issues
 workfel
·
3Comments
workfel
·
3Comments
 emeric0101
·
3Comments
emeric0101
·
3Comments
 sjdemoor
·
3Comments
sjdemoor
·
3Comments
 kakalos12
·
4Comments
kakalos12
·
4Comments
 achimha
·
3Comments
achimha
·
3Comments
Most helpful comment
Yes, I agree with @qiluo this is how my gauge looks if I set showAxis=false.

https://plnkr.co/edit/CoCmJQd6eNNTTKUI7anq?p=preview