Ngx-charts: Easily Disable Chart Animations
I'm submitting a ... (check one with "x")
[ ] bug report => search github for a similar issue or PR before submitting
[x] feature request
[ ] support request => Please do not submit support request here
What is the motivation / use case for changing the behavior?
It would be very useful to have a quick-option to turn animations on/off -- mostly for the sake of performance.
[animation] = "animation"

//options
animation =  false;
This would help in situations where performance may be a concern, or if a chart is being used multiple times on the same view/page. For example, I am using a normalized horizontal bar chart in a table column/cell (one per row) to represent percentages of the relevant data, and 25 rows of them animating at the same time is bit much. I realize this may be a unique use-case; however, turning animations off may, in some cases, be just as important as their glamour.
If there is already an easy way to turn animations off, it is not currently documented.
:)
 ghost
ghost
All 11 comments
This is a valid feature request. We are waiting for the new animation features to land in angular so we can improve our animations. I agree there should be an option to disable them.
 marjan-georgiev
on 15 Feb 2017
marjan-georgiev
on 15 Feb 2017
I'd also like to see a way to disable the data-point behaviours in the Angular 2 branch, if that's feasible.
 VecchioIdraulico
on 3 Apr 2017
VecchioIdraulico
on 3 Apr 2017
Attached shows attempted use of gauge. If animation cannot be disabled that pretty much makes e.g. the gauge unusable, as on every update the gauge redraws from position 0. Even a quick hack to disable animations might allow us to proceed w/ ngx-charts, please advise

.
 brent-williams
on 17 May 2017
brent-williams
on 17 May 2017
I could use this change as well. Here's an updated Plnkr of the demo to show what @brent-williams was describing.
 jsheldon
on 29 Aug 2017
jsheldon
on 29 Aug 2017
Any updates on this?
 michaelfaisst
on 8 Sep 2017
michaelfaisst
on 8 Sep 2017
This really desperately needs a solution... The gauge element is unusable with updating values.
 ItsEcholot
on 8 Sep 2017
ItsEcholot
on 8 Sep 2017
Is there a fix in the works for this?
 mhmmxx
on 21 Sep 2017
mhmmxx
on 21 Sep 2017
Any updates on this?
 philjones88
on 2 Oct 2017
philjones88
on 2 Oct 2017
The gauge animation issue is addressed by https://github.com/swimlane/ngx-charts/pull/563
I am working on adding animations input to the charts that would disable the animations for the component.
marjan-georgiev
on 2 Oct 2017
animations input landed in 6.1.0
marjan-georgiev
on 12 Oct 2017
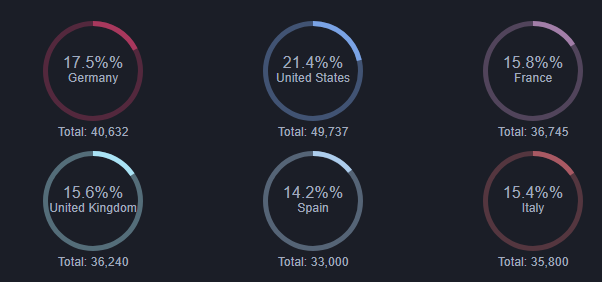
Hi, After disable the animation, the pie grid chart show two % , how to solve this? Thanks
 khaukheng
on 21 Dec 2017
khaukheng
on 21 Dec 2017
Related issues
 tobigit
·
4Comments
tobigit
·
4Comments
 workfel
·
3Comments
workfel
·
3Comments
 Jacquers
·
3Comments
Jacquers
·
3Comments
 amcdnl
·
4Comments
amcdnl
·
4Comments
 merinshaji
·
3Comments
merinshaji
·
3Comments
Most helpful comment
This is a valid feature request. We are waiting for the new animation features to land in angular so we can improve our animations. I agree there should be an option to disable them.