Ngx-charts: Charts to be responsive on screen resize
**I'm submitting a
- [X] feature request
Current behavior
Charts are not responsive. On screen resize, they don't scale.
Expected behavior
Charts should resize based on screen resize.
Reproduction of the problem

What is the motivation / use case for changing the behavior?
To use charts with different screen sizes
Please tell us about your environment:
Operating system - mac
IDE - webstorm
package manager - NPM
ngx-charts version: 3.0.4
Angular version: 2.4.1
Browser:Chrome & Firefox
 richavyas
All 35 comments
Try removing the [view] input. If that is not present or undefined, the chart resizes to fit its parent container.
 marjan-georgiev
on 1 Jan 2017
marjan-georgiev
on 1 Jan 2017
we can prob close this one in favor of this feature request https://github.com/swimlane/ngx-charts/issues/150
 kyleledbetter
on 3 Jan 2017
kyleledbetter
on 3 Jan 2017
@marjan-georgiev : if view is undefined the charts fits to its parent container, true, but on resize, if the parent container is responsive ( c.f bootstrap class container ) the chart doesn't resize.
:(
 Asone
on 27 Jun 2017
Asone
on 27 Jun 2017
@marjan-georgiev : tried it on v5.3.1
Asone
on 27 Jun 2017
I agree with @Asone, is there any way to force a resize when the parent container is resized?
 markmssd
on 28 Jul 2017
markmssd
on 28 Jul 2017
Same problem described by @Asone here. @markmssd, Have you found any workarounds?
 williangd
on 9 Aug 2017
williangd
on 9 Aug 2017
Nope no solution yet, just living with it for now...
markmssd
on 10 Aug 2017
Hey
you can try to bind the view array on window resize event
work for me
component
onResize(event) {
this.view = [event.target.innerWidth - 900, 280 ];
}
in html
<ngx-charts-area-chart
(window:resize)="onResize($event)"
[view]="view"
[scheme]="colorScheme">
</ngx-charts-area-chart>
 dudipsh
on 26 Sep 2017
dudipsh
on 26 Sep 2017
Where are you getting the view array from?
markmssd
on 26 Sep 2017
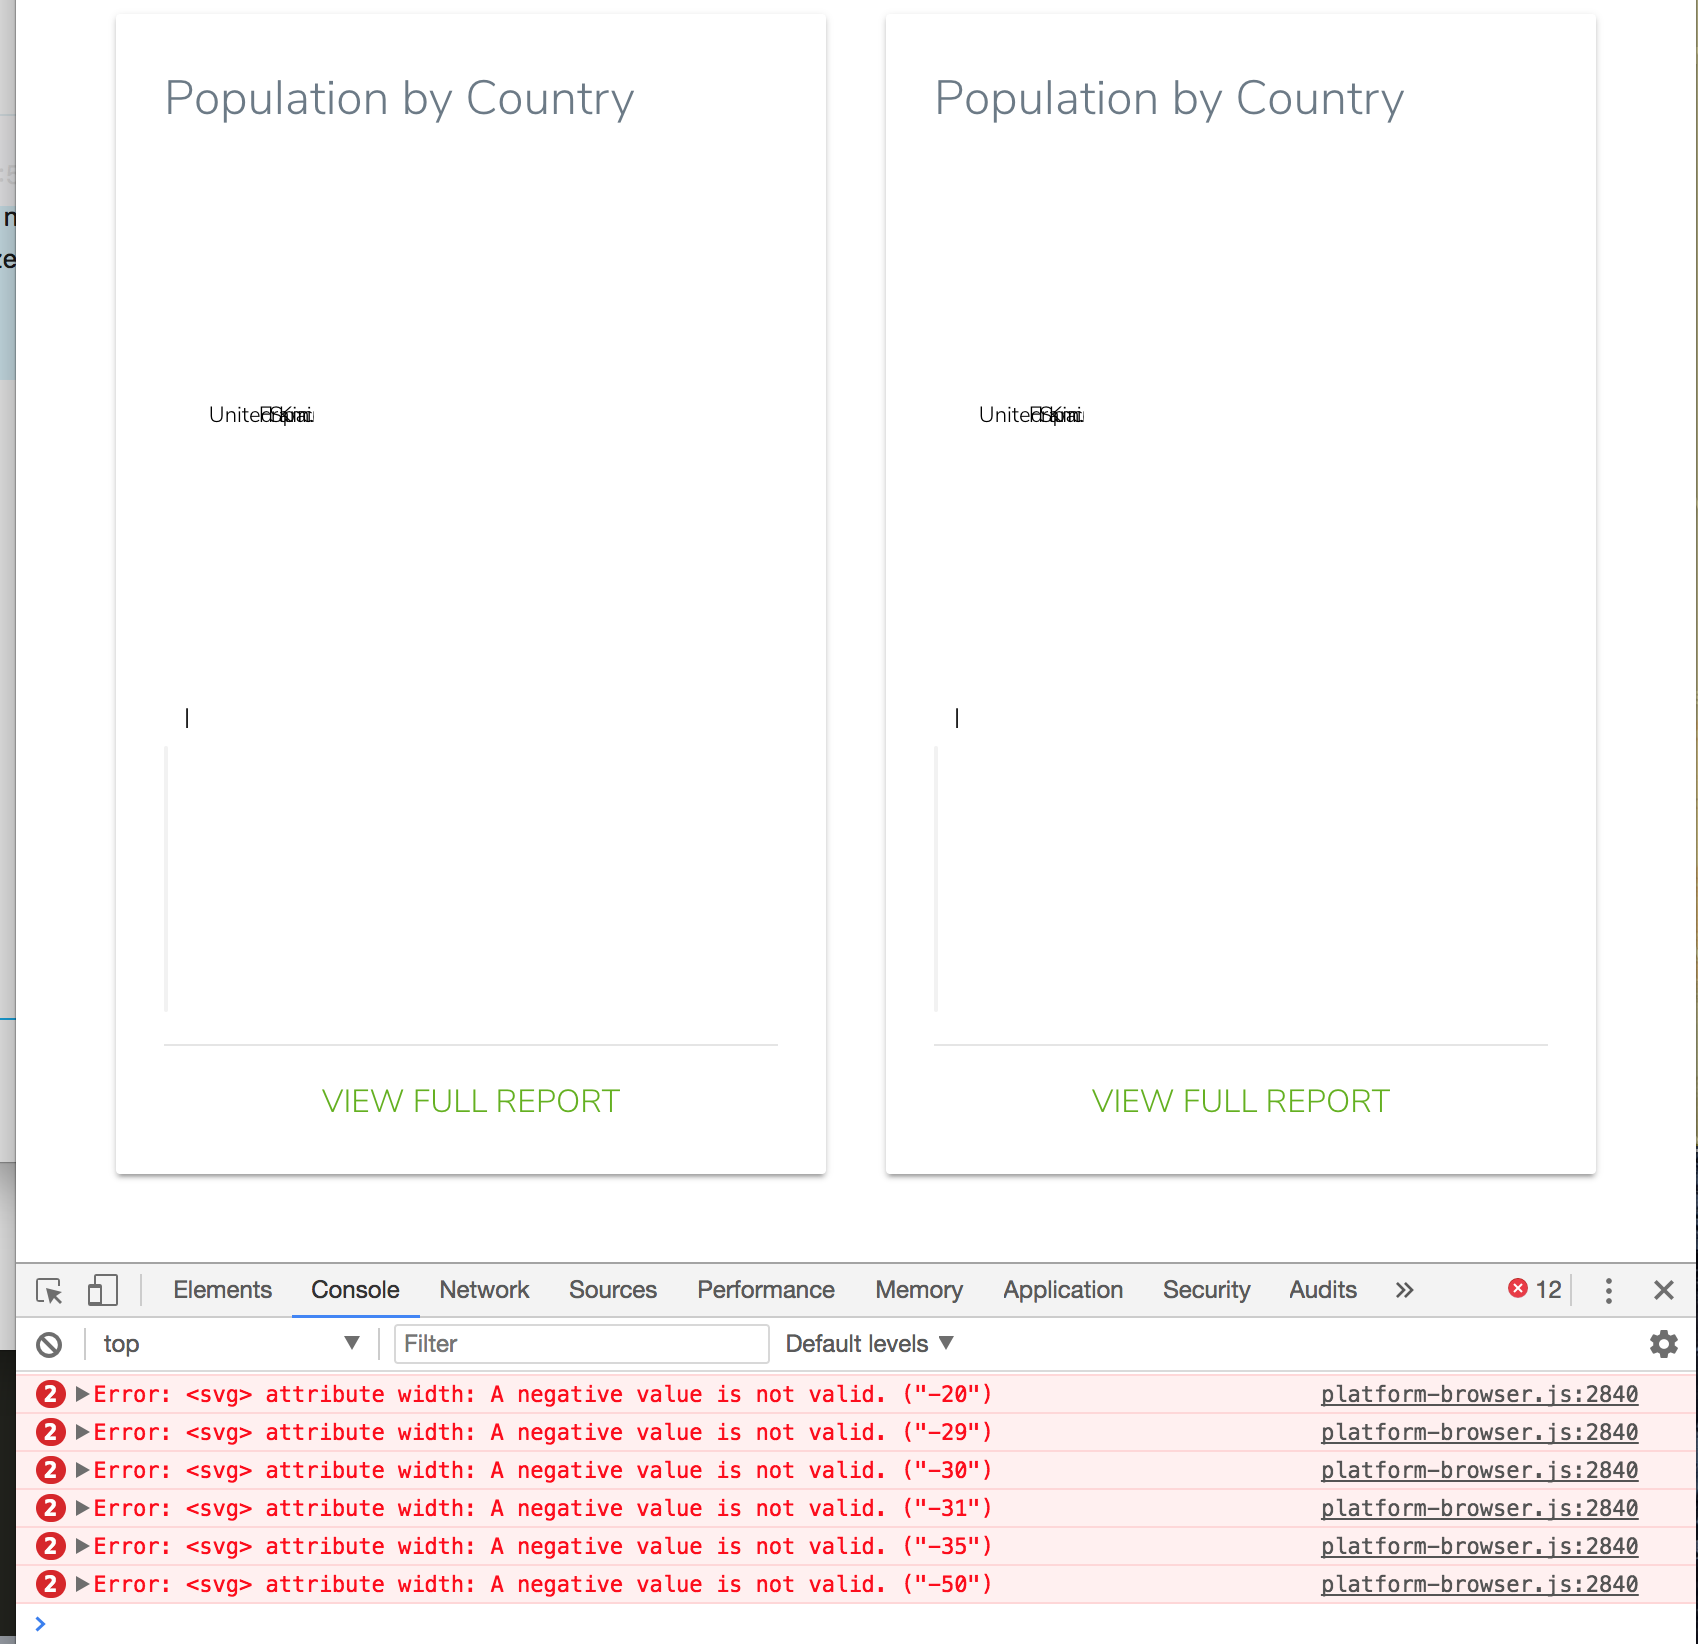
@dudipsh that works until a certain point...
... after which it throws a negative width error
 mmahmad
on 23 Nov 2017
mmahmad
on 23 Nov 2017
Put chart in a container
 Sendrea
on 10 Feb 2018
Sendrea
on 10 Feb 2018
Put chart in a container ,even if chart not resizing properly , just fire the window resize event it will automatically resize. window.dispatchEvent(new Event('resize'));
 amit11patel6
on 10 Mar 2018
amit11patel6
on 10 Mar 2018
@ViewChild('graphWrapper') graphWrapper: ElementRef;
constructor(private zone: NgZone) {}
` fixGraphPosition() {
this.zone.runOutsideAngular(() => {
Observable.fromEvent(window, 'resize')
.debounceTime(200).distinctUntilChanged().subscribe((e: Event) => {
this.zone.run(() => {
this.changeSize.next(e);
})
}
)
});
this.changeSize.subscribe((e: Event) => { this.onResize(e);
});
onResize(event) {
if (this.graphWrapper && this.graphWrapper.nativeElement) {
this.chartWidth = this.graphWrapper.nativeElement.offsetWidth;
}
} `
dudipsh
on 12 Mar 2018
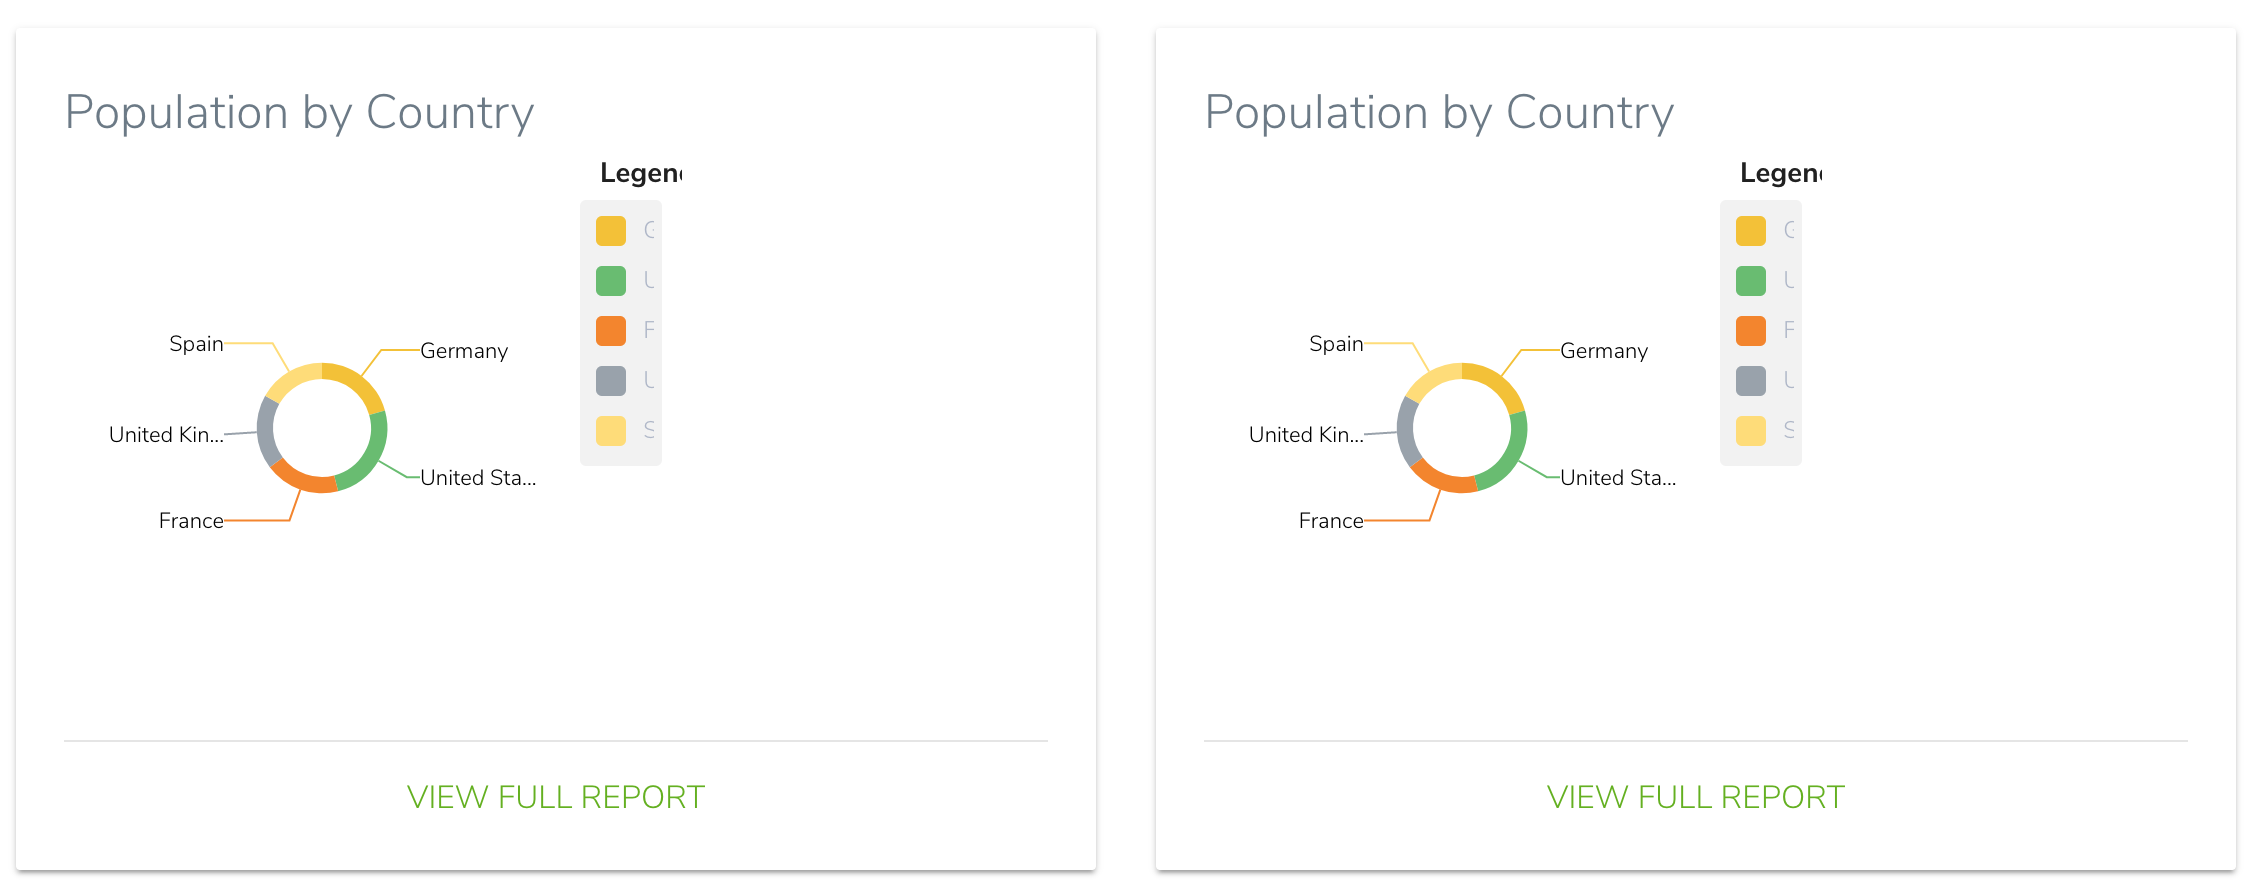
@mmahmad Sorry for off topic question, but how did you get this nice donut chart? I've spent couple of hours so far struggling with this to take out of the box. By any chance there is a manual I could use? Thx in advance.
 rkuodys
on 1 May 2018
rkuodys
on 1 May 2018
@rkuodys It's available as an input to the pie chart. Pass [doughnut]=true.
Reference: https://swimlane.gitbook.io/ngx-charts/examples/pie-charts/pie-chart
mmahmad
on 1 May 2018
I solved it by putting it inside a div with css --> display: grid;
// html
<div id="pie-chart-parent">

    <ngx-charts-pie-chart></ngx-charts-pie-chart>

</div>
// css
#pie-chart-parent {
display: grid;
}
 noeldelgadom
on 24 May 2018
noeldelgadom
on 24 May 2018
I went a bit old school with this. After spending ages on it, I solved it by adding a 1px transparent .gif into the responsive container which houses, say, ngx-charts-pie-chart :
<img src="data:image/gif;base64,R0lGODlhAQABAIAAAAAAAP///yH5BAEAAAAALAAAAAABAAEAAAIBRAA7">
then style it:
img {
width: 100%;
}
ngx-charts-pie-chart{
position:absolute;
top:0;
bottom:0;
left:0;
right:0;
}
This works because the image forces a percentage height which the chart needs to size itself.
It is slow to resize in that there is a slight delay after the browser window has been resized, but it does work if you don't mind that.
Also, I should note that I needed the pie chart without legend and labels and using display:grid from above would not strip away the empty space these items would have occupied.
 torontocode
on 29 May 2018
torontocode
on 29 May 2018
Actually, I improved on the above by not using an image and just adding padding-bottom:100%; to the responsive container.
Does the same thing.
torontocode
on 29 May 2018
hi @torontocode, do you still use the img tag for new solution? or just a container class you create that is the parent to the chart
 johren02
on 23 Jun 2018
johren02
on 23 Jun 2018
No - you don't need an image any more - just set chart css position to absolute and padding-bottom:100% on the parent.
torontocode
on 19 Jul 2018
I had the same problem with treemap chart. My solution:
<ngx-charts-tree-map
#chart
[view]="[width, height]"
[scheme]="colorScheme"
[results]="single"
[valueFormatting]="valueFormatting">
</ngx-charts-tree-map>
``` Typescript
@Input() private _width = null;
set width(value: any) {
this._width = value;
}
get width(): any {
return this._width || this.el.nativeElement.clientWidth;
}
constructor(private el: ElementRef) {}
Logic: If no width specified than i take the width of the host element.
``` Css
:host {
display: block;
}
 ErvinLlojku
on 26 Jul 2018
ErvinLlojku
on 26 Jul 2018
@dudipsh My onResize function does not get called .I am using angular-gridster2 with ngx-charts so I need to resize the chart based on div size .Here is how I have used
<div #component1 class="ngx-charts-bar-vertical" style=" display: grid; ">
<ngx-charts-bar-vertical
(window:resize)="onResize($event)"
[scheme]="colorScheme"
[results]="single"
[gradient]="gradient"
[xAxis]="showXAxis"
[yAxis]="showYAxis"
[legend]="showLegend"
[showXAxisLabel]="showXAxisLabel"
[showYAxisLabel]="showYAxisLabel"
[xAxisLabel]="xAxisLabel"
[yAxisLabel]="yAxisLabel"
[xAxisTickFormatting]="xAxisTickFormatting"
(select)="onSelect($event)"
(legendLabelClick)="onLegendLabelClick($event)"
(dblclick)="dblclick($event)"
(xAxisLabelclick)="xAxisLabelclick($event)">
</ngx-charts-bar-vertical>
</div>
Any help on how can i resize the chart based on user interaction with div .
 amrit-kumar
on 13 Aug 2018
amrit-kumar
on 13 Aug 2018
@amrit-kumar
did you try with my example? (its works for me)
try to move the " (window:resize)="onResize($event)" up to the div
<div #component1 class="ngx-charts-bar-vertical" (window:resize)="onResize($event) ">
<ngx-charts-bar-vertical></<ngx-charts-bar-vertical>
</div>
dudipsh
on 13 Aug 2018
create 3 charts with difference size :dagger:
 wahabiberexia
on 4 Sep 2018
wahabiberexia
on 4 Sep 2018
How the chart width and height is determined is explained here.
So what I did is basically remove the view input and set the min-height of the chart's parent. The responsiveness upon window resize is taken care of automatically.
<div class="row">
<div class="col-md-6 chart-parent">
<ngx-charts-bar-vertical></ngx-charts-bar-vertical>
</div>
<div class="col-md-6 chart-parent">
<ngx-charts-bar-vertical></ngx-charts-bar-vertical>
</div>
</div>
.chart-parent{
min-height: 350px;
}
Both charts now resize nicely.
Hope this helps someone.
 khalidcawl
on 2 Oct 2018
khalidcawl
on 2 Oct 2018
Just found some solution here https://stackoverflow.com/questions/52552815/how-can-i-make-my-ngx-line-chart-responsive seems like quite clean way of approaching the problem
 kuncevic
on 14 Dec 2018
kuncevic
on 14 Dec 2018
The solution for me was to create a parent div and add some CSS :
charts.component.html
<div id="line-chart-parent" class="col-8">
<ngx-charts-line-chart class="chart-container"
[scheme]="colorScheme"
[results]="results"
[curve]="curve"
[showXAxisLabel]="true"
[showYAxisLabel]="true"
[xAxis]="true"
[yAxis]="true"
[autoScale]="true"
[showGridLines]="true"
(select)="select($event)">
</ngx-charts-line-chart>
</div>
charts.component.css
#line-chart-parent {
display: grid;
min-height: 500px;
}
I wanted the width to be responsive and the heigth to be fixed.
 EfkanKnz
on 16 May 2019
EfkanKnz
on 16 May 2019
@amit11patel6 you are the man!
We were trying it from last 3 days , but finally from your solution , we have done it!!!! Thanks a lot.
 yogendra-waghale
on 27 Jun 2019
yogendra-waghale
on 27 Jun 2019
This should be definitively handled by the ngx charts lib. Not setting view didn't do the trick, neither did [view]="".
Here's my temporary "fix":
html
<div #pbgChartContainer>
<ngx-charts-bar-horizontal
...
(window:resize)="onResize()"
...
</ngx-charts-bar-horizontal>
</div>
component
@ViewChild('pbgChartContainer') pbgChartContainer: ElementRef;
...
onResize() {
setTimeout(() => {
this.pbgChartOptions.view = [this.pbgChartContainer.nativeElement.offsetWidth, 300];
}, 500)
}
It only works using setTimeout. This should be done as well in ngOnInit for different devices. However, it'd be nice if someone has a better angular-ish solution.
 rodrigosanchezg8
on 16 Jan 2020
rodrigosanchezg8
on 16 Jan 2020
Put chart in a container ,even if chart not resizing properly , just fire the window resize event it will automatically resize. window.dispatchEvent(new Event('resize'));
Hi can you please tell me exactly where I have to put this in my TS file?
 kavyahalani
on 27 Feb 2020
kavyahalani
on 27 Feb 2020
Put chart in a container ,even if chart not resizing properly , just fire the window resize event it will automatically resize. window.dispatchEvent(new Event('resize'));
Hi can you please tell me exactly where I have to put this in my TS file?
You can create a function
resizeGraph() {
window.dispatchEvent(new Event('resize'));
}
and you can call this function on some button which toggles the screen or do some operation related to graph
 omdhanwant
on 27 Feb 2020
omdhanwant
on 27 Feb 2020
I solved it by putting it inside a div with css --> display: grid;
// html
<div id="pie-chart-parent">

    <ngx-charts-pie-chart></ngx-charts-pie-chart>

</div>
// css
#pie-chart-parent {
display: grid;
}
This one fixed my issue. But i am not quite sure this is the right way .I mean it is way better to tweak these controls from library itself
 SandeepBalachandran
on 27 Apr 2020
SandeepBalachandran
on 27 Apr 2020
The solution for me was to create a parent div and add some CSS :
charts.component.html<div id="line-chart-parent" class="col-8"> <ngx-charts-line-chart class="chart-container" [scheme]="colorScheme" [results]="results" [curve]="curve" [showXAxisLabel]="true" [showYAxisLabel]="true" [xAxis]="true" [yAxis]="true" [autoScale]="true" [showGridLines]="true" (select)="select($event)"> </ngx-charts-line-chart> </div>
charts.component.css#line-chart-parent { display: grid; min-height: 500px; }I wanted the width to be responsive and the heigth to be fixed.
This worked for me. Thanks in advance
 DinalieLiyanage
on 14 Jun 2020
DinalieLiyanage
on 14 Jun 2020
So display:grid doesn't work with advanced-pie, bars. The listeners to rerender chart (widthheight) also doesn't work. Will replace these charts with another more responsive, unfortunately.
 IgorKurkov
on 26 Nov 2020
IgorKurkov
on 26 Nov 2020
Try removing the
[view]input. If that is not present or undefined, the chart resizes to fit its parent container.
set the parent div width 100%; as well as give some height to that div,this will do the trick.
                    <ngx-charts-line-chart  [scheme]="colorScheme" [legend]="legend" [showXAxisLabel]="showXAxisLabel" [showYAxisLabel]="showYAxisLabel" [xAxis]="xAxis" [yAxis]="yAxis" [xAxisLabel]="xAxisLabel" [yAxisLabel]="yAxisLabel" [timeline]="timeline" [results]="graphActualContent" (select)="onSelect($event)" (activate)="onActivate($event)" (deactivate)="onDeactivate($event)">
                    </ngx-charts-line-chart>
 ksohail-weeinvent
on 12 Apr 2021
ksohail-weeinvent
on 12 Apr 2021
Related issues
 kakalos12
·
4Comments
kakalos12
·
4Comments
 ianfdk
·
3Comments
ianfdk
·
3Comments
 cfremgen
·
3Comments
cfremgen
·
3Comments
 sjdemoor
·
3Comments
sjdemoor
·
3Comments
 faisalnet5
·
3Comments
faisalnet5
·
3Comments
Most helpful comment
I solved it by putting it inside a div with css --> display: grid;
// html
// css
#pie-chart-parent { display: grid; }