Ngx-charts: Add spline interpolation option for lines and areas
Add an input property to line and area charts that specifies the interpolation algorithm used to generate the paths.
The available values would be 'linear', 'cardinal', and 'monotone'.
Example:
http://bl.ocks.org/mbostock/4342190
 marjan-georgiev
All 5 comments
Added an input called curve to the line and all area charts. The type is one of d3's curve functions:
https://github.com/d3/d3-shape#curves
[curve]="d3.shape.curveLinear"
hi,
can you please provide a working plunker for this?
i found myself struggling with implementing this curve.
thanks a lot.
 dtsanan
on 31 Dec 2017
dtsanan
on 31 Dec 2017
+1 don't understand exactly how to make it work?
I guess we have to put our own curve function or import the d3 library?
Thanks!
 valentinbdv
on 10 Jan 2018
valentinbdv
on 10 Jan 2018
See https://github.com/swimlane/ngx-graph/issues/50 for some pointers
 olliechick
on 13 Dec 2019
olliechick
on 13 Dec 2019
I have understood how it works 💯
to get Linear type, here is the solution :
component.html
<ngx-charts-polar-chart
  [view]="view]"
  [scheme]="colorScheme"
  [results]="_Data"
  [legend]="Legend"
  [xAxis]="XAxis"
  [curve]="linearCurve"
>
</ngx-charts-polar-chart>
component.ts
import * as shape from 'd3-shape';
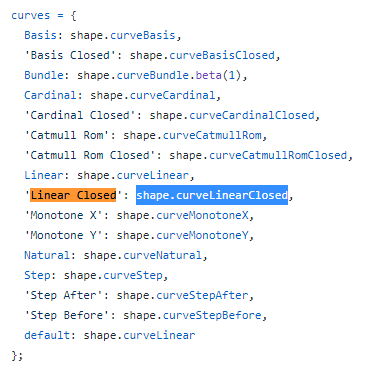
linearCurve= shape.curveLinearClosed;
and you will get linear curve.
Hope you find this solution helpful 👍
Here are different inbuilt functions :
 parthdevloper
on 8 Aug 2020
parthdevloper
on 8 Aug 2020
Related issues
 lokeshdaiya
·
3Comments
lokeshdaiya
·
3Comments
 faisalnet5
·
3Comments
faisalnet5
·
3Comments
 ronybarbosa
·
3Comments
ronybarbosa
·
3Comments
 kakalos12
·
4Comments
kakalos12
·
4Comments
 cfremgen
·
3Comments
cfremgen
·
3Comments
Most helpful comment
I have understood how it works 💯
to get Linear type, here is the solution :
component.html
component.ts
and you will get linear curve.
Hope you find this solution helpful 👍
Here are different inbuilt functions :
>>reference<<