Ng2-charts: Set custom values for y-axis.
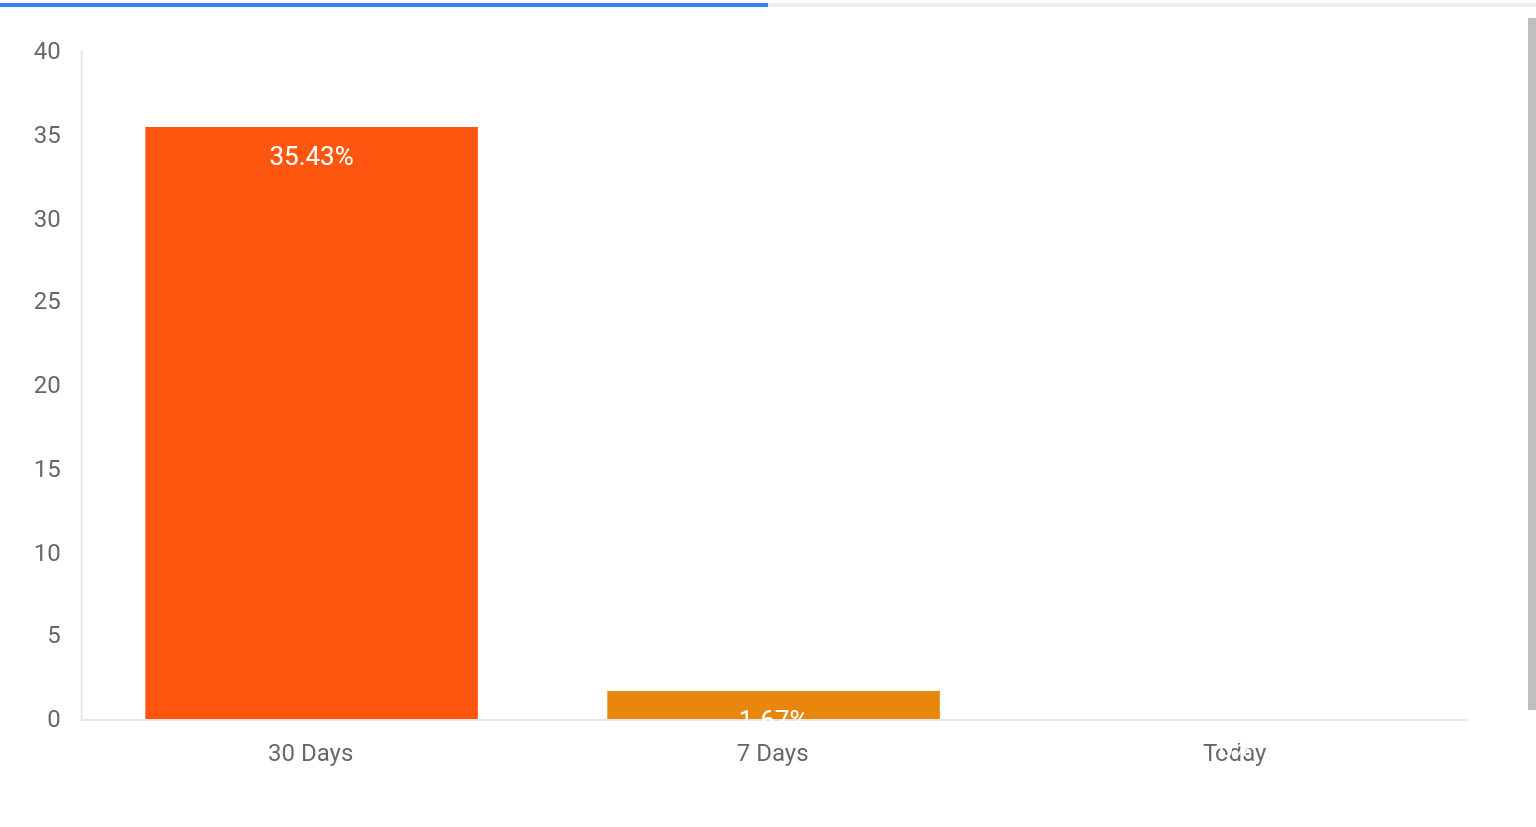
Currently y axis values are determined form the chat datasource. Is it possible to set max values or custom intervals for y-axis.
For example:
This chart plots percentage values. Since its a percentage, it has to be plotted against the maximum value of 100%. Is it possible to display 100% as the maximum value on y-axis regardless of the chart data.
 venkadesh02
All 12 comments
I have this issue too. Can anyone please help?
 srinidhi-rao
on 3 Jul 2017
srinidhi-rao
on 3 Jul 2017
Check the Chart.JS docs for this one. It is set in options.
You didn't post your code, so I am unsure what your variables are, but:
optionsVariable : {
  scales : {
    yAxes: [{
       ticks: {
          steps : 10,
          stepValue : 10,
          max : 100,
        }
    }]
  }
}
That should do it for you
 bjines
on 7 Jul 2017
bjines
on 7 Jul 2017
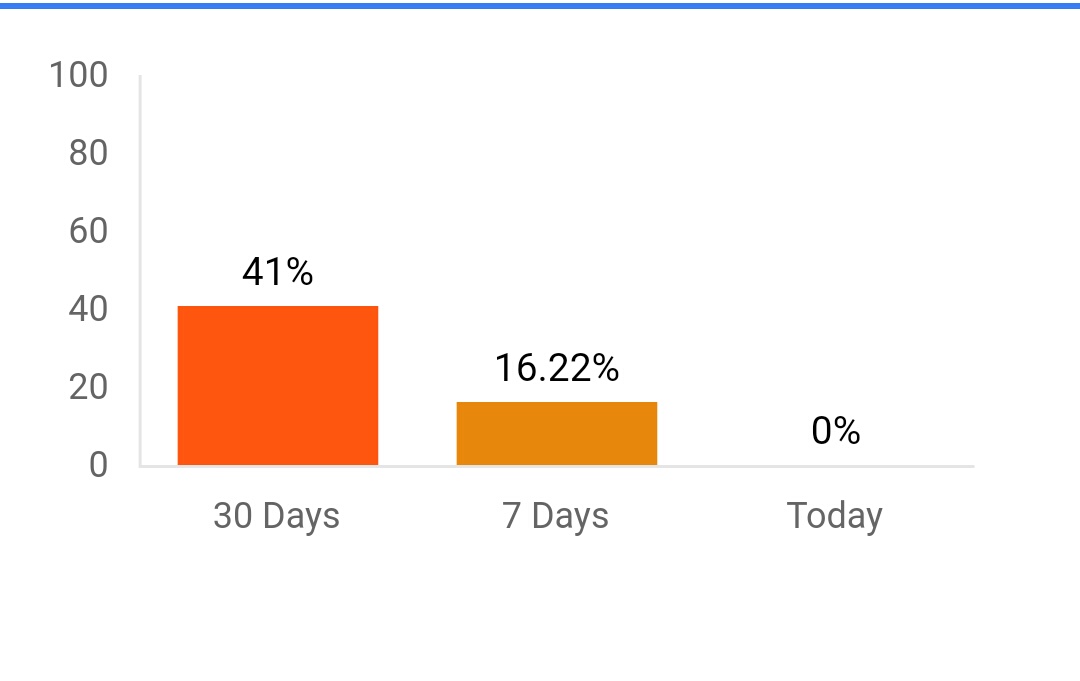
Thanks. This works. This how my chart looks after applying the change that
you suggested.
On Jul 7, 2017 8:12 PM, "bjines" notifications@github.com wrote:
Check the Chart.JS docs for this one. It is set in options.
You didn't post your code, so I am unsure what your variables are, but:
optionsVariable : {
  scales : {
    yAxes: [{
       ticks: {
          steps : 10,
          stepValue : 10,
          max : 100,
        }
    }]
  }
}
That should do it for you
—
You are receiving this because you commented.
Reply to this email directly, view it on GitHub
https://github.com/valor-software/ng2-charts/issues/853#issuecomment-313701590,
or mute the thread
https://github.com/notifications/unsubscribe-auth/AJRKqxb_mr9Y9sV-ctTP9cQksKb-uLSPks5sLkPDgaJpZM4OL3DC
.
srinidhi-rao
on 10 Jul 2017
 sasrinidhi
on 10 Jul 2017
sasrinidhi
on 10 Jul 2017
optionsVariable : {
  scales : {
    yAxes: [{
       ticks: {
          steps : 10,
          stepValue : 10,
          max : 100,
        }
    }]
  }
}
it don't work for me.
optionsVariable : {
  scales : {
    yAxes: [{
       ticks: {
          min: 0,
          stepValue : 10,
          max : 100,
        }
    }]
  }
}
but this config work for me
 preservance717
on 9 Feb 2018
preservance717
on 9 Feb 2018
its not 'min', use beginAtZero: true
 ArneKnockaert
on 22 Feb 2018
ArneKnockaert
on 22 Feb 2018
@bjines
Do you know how I can set dynamically the max value optionsVariable ?
In other words I only want to set max in different events.
this.optionsVariable.scales.yAxes.ticks.max =maxValue didn't work for me, and I got this error : "Cannot set property 'max' of undefined" .
 AmalMtibaa
on 6 Jul 2018
AmalMtibaa
on 6 Jul 2018
@bjines
if u add in ngOnInit
this.chartOptions.scales.yAxes[0].ticks.max = this.maxYaxis;
must work
 katedoctor
on 6 Aug 2018
katedoctor
on 6 Aug 2018
But it is always plotting data with respect primary/first axis scaling values. How to plot based on mulitple scaling values?
 Ashok-Kumar-Venaktesh
on 13 Aug 2018
Ashok-Kumar-Venaktesh
on 13 Aug 2018
   yAxes: [{
            stacked: true,            // this also..
            scaleLabel: {
              display: true,
              labelString: 'Flowdata'
            },
            ticks: {
              min: 0, max : 60,steps:5,stepValue:12,
              // Include a dollar sign in the ticks
              callback: function(value, index, values) {
                  return  value + 'ml/s';
              }
            }
          }]
I have added all those things in my code ,still its not working
 thotasatyasri
on 21 Mar 2019
thotasatyasri
on 21 Mar 2019
steps under ticks section is not working for me
 Saitejas1997
on 28 Mar 2020
Saitejas1997
on 28 Mar 2020
y-axis tickes section works for me, Thank you for the code.
Here is my code :
 scales: {
          yAxes: [{
            barPercentage: 6.0,
            categoryPercentage: 6.0,
            ticks: {
             beginAtZero: true,
              callback: function (value, index, values) {
                return '$' + value + 'k';
              },
            }
          }]
        }
 kedar2594
on 24 Jul 2020
kedar2594
on 24 Jul 2020
Related issues
 tushartgsit
·
5Comments
tushartgsit
·
5Comments
 RKornu
·
3Comments
RKornu
·
3Comments
 sarn3792
·
4Comments
sarn3792
·
4Comments
 martinpinto
·
3Comments
martinpinto
·
3Comments
 mrpotato3
·
5Comments
mrpotato3
·
5Comments
Most helpful comment
Check the Chart.JS docs for this one. It is set in options.
You didn't post your code, so I am unsure what your variables are, but:
That should do it for you