Ng2-charts: How to display value on Chart (ionic 2)?
I want to display plotted values on Chart always. Currently its showing when user hover / click on the chart. How to show values always on the chart? i attached the sample image that i want to display the values (i attached bar chart but i want to display values on all type of charts).

 venkadesh02
All 29 comments
Replace this options in my component is working.
Credit StackOverFlow
public lineChartOptions: any = {
    responsive: true,
    tooltips: {
      enabled: false
    },
    animation: {
      onComplete: function () {
        var ctx = this.chart.ctx;
        ctx.textAlign = "center";
        ctx.textBaseline = "middle";
        var chart = this;
        var datasets = this.config.data.datasets;

        datasets.forEach(function (dataset: Array<any>, i: number) {
          ctx.font = "10px Arial";


          ctx.fillStyle = "Black";
          chart.getDatasetMeta(i).data.forEach(function (p: any, j: any) {
            ctx.fillText(datasets[i].data[j], p._model.x, p._model.y - 20);
          });

        });
      }
    },
    legend: {
      display: true,
      labels: {
        fontColor: 'rgb(255, 99, 132)'
      }
    }
  }
 seksitha
on 30 May 2017
seksitha
on 30 May 2017
Great!! Working fine. Thanks.
venkadesh02
on 23 Jun 2017
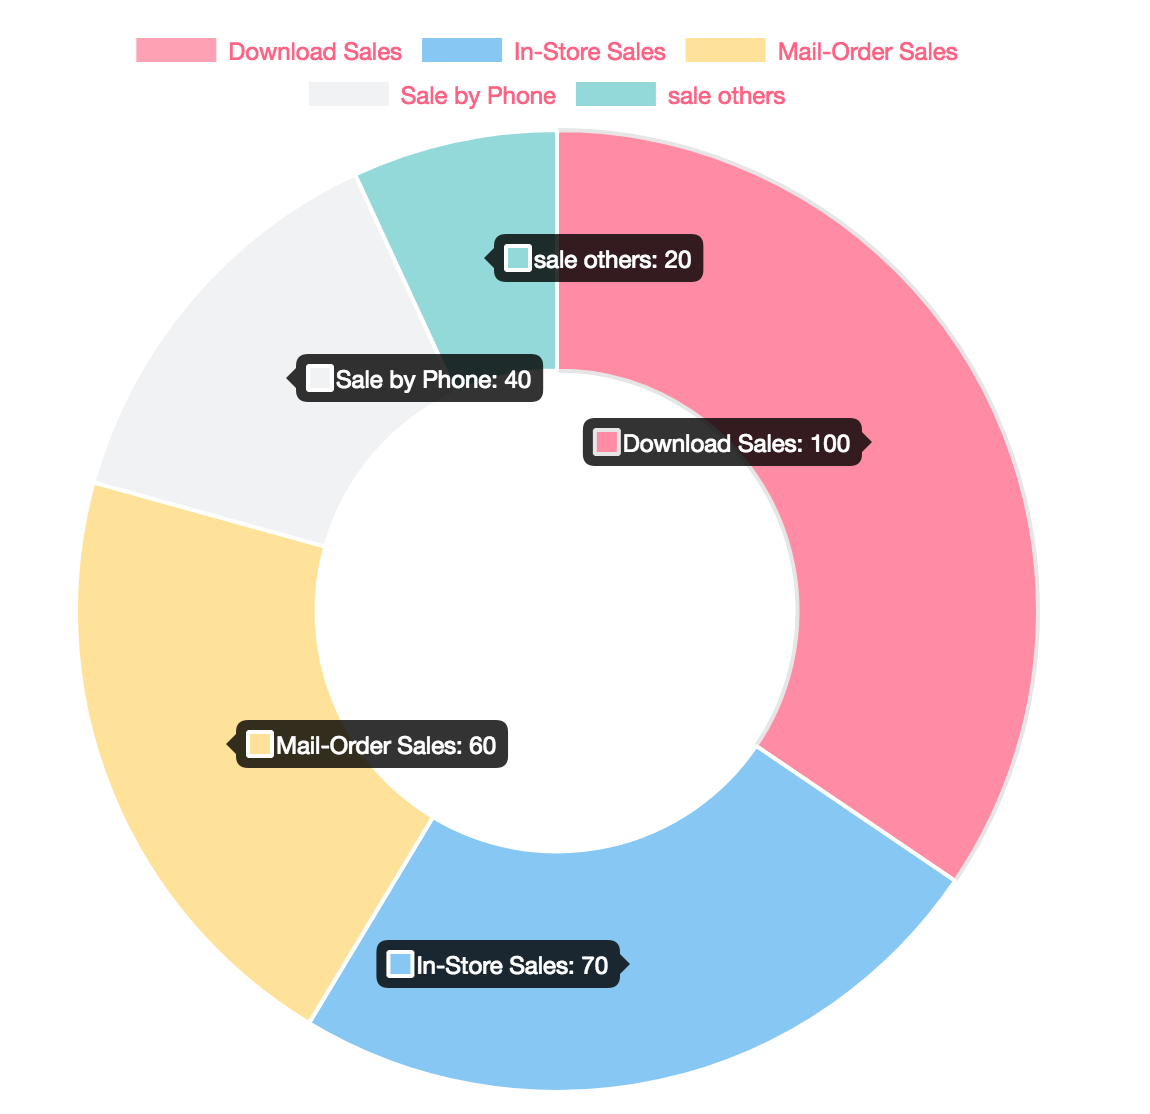
Can you please tell me how display values on donut chart ?
venkadesh02
on 23 Jun 2017
OK, after searching for a while I only have solution of showing all tooltips.
stackOverflow
First you need to create a chartjs plugin and import it to your app.
here is the code let call pluginShowTooltips.js.
Chart.pluginService.register({
  beforeRender: function(chart) {
    if (chart.config.options.showAllTooltips) {
      // create an array of tooltips
      // we can't use the chart tooltip because there is only one tooltip per chart
      chart.pluginTooltips = [];
      chart.config.data.datasets.forEach(function(dataset, i) {
        chart.getDatasetMeta(i).data.forEach(function(sector, j) {
          chart.pluginTooltips.push(new Chart.Tooltip({
            _chart: chart.chart,
            _chartInstance: chart,
            _data: chart.data,
            _options: chart.options.tooltips,
            _active: [sector]
          }, chart));
        });
      });

      // turn off normal tooltips
      chart.options.tooltips.enabled = false;
    }
  },
  afterDraw: function(chart, easing) {
    if (chart.config.options.showAllTooltips) {
      // we don't want the permanent tooltips to animate, so don't do anything till the animation runs atleast once
      if (!chart.allTooltipsOnce) {
        if (easing !== 1)
          return;
        chart.allTooltipsOnce = true;
      }

      // turn on tooltips
      chart.options.tooltips.enabled = true;
      Chart.helpers.each(chart.pluginTooltips, function(tooltip) {
        tooltip.initialize();
        tooltip.update();
        // we don't actually need this since we are not animating tooltips
        tooltip.pivot();
        tooltip.transition(easing).draw();
      });
      chart.options.tooltips.enabled = false;
    }
  }
});
in the chart component
public options: any = {
    responsive: true,
    showAllTooltips:true,
    legend: {
      display: true,
      labels: {
        fontColor: 'rgb(255, 99, 132)'
      }
    }
  };
In view
<canvas baseChart
              [data]="doughnutChartData"
              [labels]="doughnutChartLabels"
              [chartType]="doughnutChartType"
              [options]="options">

  </canvas>
Is it not possible to display the value inside the donut chart like what is shown in image?
venkadesh02
on 27 Jun 2017
can u tell me how to do it for pie chart?
 shashank00000007
on 18 Sep 2017
shashank00000007
on 18 Sep 2017
I believe it is the same in Pie chart. If you get the donut chart to work it will work the same.
seksitha
on 2 Oct 2017
I want to display values of legends in descending order so how to do this?
 lakshyamathur1
on 22 May 2018
lakshyamathur1
on 22 May 2018
@lakshyamathur1 I'm not clear about your question. what kind of chart do you refer to?
Anyway, I guess you want to display chart from high value down to lowest one?
then just short your model before pass to chat [data] = chartDataAfterShort
seksitha
on 22 May 2018
@seksitha
Thanks for your response
See I am using ng2-doughnut chart.
I am getting values from backend(API) to build my chart ..
Now the requirement is to show the values of legend in the descending order.
So please help
lakshyamathur1
on 22 May 2018
Your info is not enough for me to help you.
Can you show your API data you get from Backend?
Can you show the image or draw by what you mean?
seksitha
on 22 May 2018
Is this something you are looking for?
seksitha
on 22 May 2018
@seksitha yaa this is exactly what I am building but my requirement was to show the chart( without hover effect ) on left side and the legends(value) on right side so I am getting chart on left side and on the right side I am getting values for e.g.
A-20
B-10
C-25
D-5....
and these legends(values ) are coming from API.
So, I need to display this data in Descending order .
So if there is any control or does CANVAS have any property to show data in descending order.
Hope now I am clear?
 lakshyamathur
on 22 May 2018
lakshyamathur
on 22 May 2018
This is data require to use in chart
doughnutChartLabels: string[] = ['A', 'B', 'C', 'D', 'E']
doughnutChartData: number[] = [100, 70, 60, 40, 20]
This is is normally data I get from API
data = [{'B':70}',{'A':100},{'D':40},{'E':20},{'C':60}] (It is not in order descending)
or Maybe another format that why I ask you what is your format?
data = [{label: 'B', val: 70}',{label:'A', val:100},{label:'D',val:40},{label:'E',val:20},{label:'C', val:60}]
So you need to write pipe function to short your data and separate as your requirement. and it is depend that why I ask about your API DATA.
seksitha
on 22 May 2018
if you get data in this format which is common :
data = [{label: 'B', val: 70}',{label:'A', val:100},{label:'D',val:40},{label:'E',val:20},{label:'C', val:60}]
this example in ES6
short array var sortData = data.sort((a,b) => a.val > b.val)
take label var doughnutChartLabels = sortData.map(val=>val.label)
take value var doughnutChartdata = sortData.map(val=>val.val)
seksitha
on 22 May 2018
@seksitha I am somewhat getting you but my case is little complicated so, now let me share the code with you
lakshyamathur1
on 22 May 2018
@seksitha I am building my code in Angular 4( Typescript )
Just let me know when you are online.
lakshyamathur1
on 22 May 2018
Where is your code? I will help if I can.
seksitha
on 23 May 2018
@seksitha can you suggest me how to wrap the value of labels...
means now for e.g. I am getting values ABCDE-20%
but as per my screen I want to display values like :- ABC...-20%...
Please help immediately
lakshyamathur1
on 24 May 2018
@seksitha :- my HTML is:-
[chartType]="doughnutChartType"
[data]="pieData2"
[labels]="labels2"
[options]="options"
[legend]="true"
[colors]="pieChartColor">
lakshyamathur1
on 24 May 2018
@seksitha :- my TS( Typescript ) file looks like:-
                this.labels.push();
                this.pieData.push(result.Share);
                this.labels2.push(result.OwnerShipName + '-' + result.Share + '%');
                this.pieData2.push(null);
Let chat it is better. poke me when you are there.
seksitha
on 24 May 2018
@seksitha
Hii seksitha,
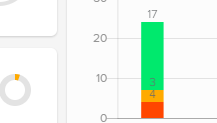
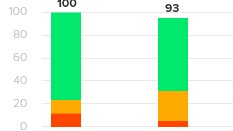
I have stacked bar chart in which 3bar chart is there I am able to so the value separate separate on each three bar can u help me to show addition of all three bar at top of stacked bar chart....I will be greatful for your help...
 vinitkrb
on 29 Aug 2018
vinitkrb
on 29 Aug 2018
@vinitkrb I don't understand what you mean. do you mean you can display 3 bar but not other 3 bars? can you show the screenshot?
seksitha
on 29 Aug 2018
vinitkrb
on 29 Aug 2018
@seksitha
i have attached the screenshot i have stacked bar chart first image is what i created second is what i want you can see the value is coming seprate seprate but i want addition of all three value at top. attaching code
// animation: {
// onComplete: function () {
// var ctx = this.chart.ctx;
// ctx.textAlign = "center";
// ctx.textBaseline = "middle";
// var chart = this;
// var datasets = this.config.data.datasets;
// datasets.forEach(function (dataset: Array
// ctx.font = "10px Arial";
// ctx.fillStyle = "Black";
// chart.getDatasetMeta(i).data.forEach(function (p: any, j: any) {
// ctx.fillText(datasets[i].data[j], p._model.x, p._model.y - 10);
// });
// });
// }
// },
vinitkrb
on 29 Aug 2018
Sorry, I still don't understand what you want to achieve. your screenshot did not explain me.
seksitha
on 29 Aug 2018
Can u see the value on bar chart 3 color is there on 1 staced chart and 3
value is coming I don't want that 3 value I want addition of all 3 value at
top of chart
On Wed, Aug 29, 2018, 5:31 PM Sitha Sek notifications@github.com wrote:
Sorry, I still don't understand what you want to archive. your screenshot
did not explain me.—
You are receiving this because you were mentioned.
Reply to this email directly, view it on GitHub
https://github.com/valor-software/ng2-charts/issues/802#issuecomment-416927394,
or mute the thread
https://github.com/notifications/unsubscribe-auth/Ah4VqzSSFqCml-RPUeOnUHXJkEiy8gY9ks5uVoKUgaJpZM4NdcGr
.
vinitkrb
on 29 Aug 2018
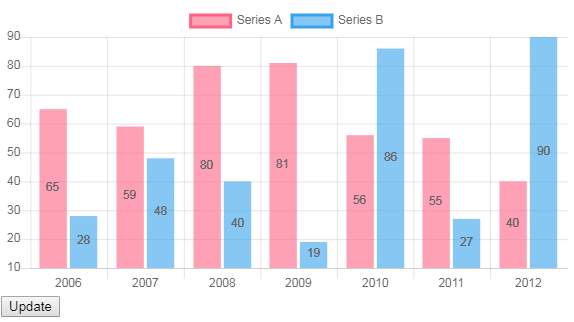
Use chartjs-plugin-datalabels - see this stackblitz: https://stackblitz.com/edit/ng2-charts-bar-labels
 paviad
on 8 Mar 2019
paviad
on 8 Mar 2019
Related issues
 RKornu
·
3Comments
RKornu
·
3Comments
 dslima90
·
3Comments
dslima90
·
3Comments
 hggeorgiev
·
4Comments
hggeorgiev
·
4Comments
 shyamal890
·
4Comments
shyamal890
·
4Comments
 SteeledSlagle13
·
3Comments
SteeledSlagle13
·
3Comments