Ng2-charts: How to display value above bar chart
Hi.
I would like to display the value above bar chart.

Component.ts
import { Component, OnInit } from '@angular/core';
import { ProspectService } from './prospect.service';
import {Observable} from 'rxjs/Rx';
import { Prospect } from './prospect';
import { ChartData } from "../chartData";

@Component({
  selector: 'app-prospects',
  templateUrl: './prospects.component.html',
  styleUrls: ['./prospects.component.css'],
  providers : [ProspectService]
})
export class ProspectsComponent implements OnInit {
  private prospects: Array<Prospect> = [];

  public barChartOptions:any = {
      scaleShowVerticalLines: false,
      responsive: true,
      scaleShowValues: true,
      scaleValuePaddingX: 10,
      scaleValuePaddingY: 10
  };

  public barChartLabels:string[] = ['Test'];
  public barChartType : string = 'bar';
  public barChartLegend: boolean = true;
  public barChartData: ChartData[] = [
    {data: [50], label: 'Series A'}
  ];


  public chartColors: Array<any> = [
    { // first color
      backgroundColor: '#67b346',
      //backgroundColor:["#FF7360", "#6FC8CE", "#FAFFF2", "#FFFCC4", "#B9E8E0"],
      borderColor: '#000000',
      pointBackgroundColor: 'rgba(225,10,24,0.2)',
      pointBorderColor: '#fff',
      pointHoverBackgroundColor: '#fff',
      pointHoverBorderColor: 'rgba(225,10,24,0.2)'
    }];

  // events
  public chartClicked(e:any):void {
    //console.log(e);
  }

  public chartHovered(e:any):void {
    //console.log(e);
  }
  constructor(private prospectService : ProspectService) {
    Observable.interval(10000).subscribe(x => { //every 10 seconds
            this.getProspect();
    });
  }

  ngOnInit() {
    this.getProspect();
  }

  public getProspect(): void{
    this.prospectService.getProspects().then(response => {
        this.prospects = response;
        this.setValuesToChart();
    });
  }

  public setValuesToChart(): void{
    let i =0;
    this.clearValues();
    var newData = new ChartData();
    this.prospects.forEach((prospect) =>{
        if(i != 0){
            this.barChartLabels.push(prospect.name);
            newData.data.push(prospect.value);
            newData.label = " Estimated Prospect Value by Account Manager";
        }
        i++;
    });
    this.barChartData.push(newData);
    this.barChartData = this.barChartData.slice();
  }

  public clearValues() : void{
    this.barChartData.forEach((info) =>{
      info.data.slice(0);
    });
    this.barChartData.splice(0);
    this.barChartLabels.splice(0);
  }

}
Component.html
<div class="container-fluid">
    <div>
      <div style="display: block">
        <canvas baseChart height="140"
                [datasets]="barChartData"
                [labels]="barChartLabels"
                [options]="barChartOptions"
                [legend]="barChartLegend"
                [colors]="chartColors"
                [chartType]="barChartType"
                (chartHover)="chartHovered($event)"
                (chartClick)="chartClicked($event)">

        </canvas>
      </div>
    </div>
</div>
Hope someone could help me
Thanks :)
 sarn3792
All 27 comments
if you found any solution then please share.
 ghost
on 7 Mar 2017
ghost
on 7 Mar 2017
Hi @sarn3792 ,
I Hope you found a way to make it. Could you please let me know?
Thank you very much.
 RamakrishnaE
on 14 Mar 2017
RamakrishnaE
on 14 Mar 2017
Hi,
I don't know if it works for barchart, but here is what I used for line chart:
```
public lineChartOptions: any = {
responsive: true,
animation: {
onComplete: function () {
var chartInstance = this.chart,
ctx = chartInstance.ctx;
ctx.textAlign = 'center';
ctx.textBaseline = 'bottom';
this.data.datasets.forEach(function (dataset, i) {
var meta = chartInstance.controller.getDatasetMeta(i);
meta.data.forEach(function (bar, index) {
var data = dataset.data[index];
ctx.fillText(data, bar._model.x, bar._model.y - 5);
});
});
}
}
};
```
Philippe
 philippegabert
on 26 Mar 2017
philippegabert
on 26 Mar 2017
Thanks Philippe, but where we need to put this function?
 sanjeevani-ftcash
on 29 Mar 2017
sanjeevani-ftcash
on 29 Mar 2017
In your file Component.ts
Actually you need to update your barChartOptions to add the animation part.
If your current options are:
public barChartOptions:any = {
scaleShowVerticalLines: false,
responsive: true,
scaleShowValues: true,
scaleValuePaddingX: 10,
scaleValuePaddingY: 10
};
You should replace them with:
public barChartOptions:any = {
scaleShowVerticalLines: false,
responsive: true,
scaleShowValues: true,
scaleValuePaddingX: 10,
scaleValuePaddingY: 10,
 animation: {
           onComplete: function () {
               var chartInstance = this.chart,
               ctx = chartInstance.ctx;
               ctx.textAlign = 'center';
               ctx.textBaseline = 'bottom';
               this.data.datasets.forEach(function (dataset, i) {
                   var meta = chartInstance.controller.getDatasetMeta(i);
                   meta.data.forEach(function (bar, index) {
                       var data = dataset.data[index];
                       ctx.fillText(data, bar._model.x, bar._model.y - 5);
                   });
               });
           }
       }
};
got it working, thanks a lot. 👍
sanjeevani-ftcash
on 29 Mar 2017
Great. Do not forget to close the issue. :+1:
philippegabert
on 29 Mar 2017
Fixes #662
sanjeevani-ftcash
on 29 Mar 2017
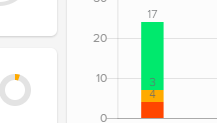
Team, I implemented this fix to my bar chart it worked well. But looking for some more improvisation on it, if particular bar does not appears on the chart as a result no data or length of dataset is 0, How to omit the value of 0 displaying. My chart is as below, can someone just a quick way for not displaying the 0's

 sukumar89
on 9 Nov 2017
sukumar89
on 9 Nov 2017
@philippegabert Do you have example for Pie Chart? And it will be helpful to understand how you reach to this solution e.g. documentation, explanation. There are too many things which require explanation for a newbie.
 dgpuranik
on 23 Nov 2017
dgpuranik
on 23 Nov 2017
Any solution for a Pie chart? So we can display data into each part of the pie.
Thanks forward
 ProElbs
on 12 Jan 2018
ProElbs
on 12 Jan 2018
in the animation, you can do something like this:
 animation: {
           onComplete: function () {
               var chartInstance = this.chart,
               ctx = chartInstance.ctx;
               ctx.textAlign = 'center';
               ctx.textBaseline = 'bottom';
               this.data.datasets.forEach(function (dataset, i) {
                   var meta = chartInstance.controller.getDatasetMeta(i);
                   meta.data.forEach(function (bar, index) {
                       var data = dataset.data[index];
                       if (data > 0) {
                         ctx.fillText(data, bar._model.x, bar._model.y - 5);
                      }
                   });
               });
           }
       }
 karthik67
on 12 Jan 2018
karthik67
on 12 Jan 2018
that will get rid of the zeros in the bar
karthik67
on 12 Jan 2018
thank you @philippegabert !! That worked beautifully for me.
 king612
on 23 Feb 2018
king612
on 23 Feb 2018
@philippegabert Actually, now that I play with it some, the data labels above the bars disappear as soon as you hover over one of the bars and the default tooltip / mouse over appears. Any suggestions? Thanks!
king612
on 26 Feb 2018
@philippegabert Excellent solution, but it appears at once on the chart, exist a way with "transition"?
 guto-gomes
on 26 Mar 2018
guto-gomes
on 26 Mar 2018
Thank you @philippegabert. I see one problem with that, as soon as I move mouse over the chart, the values disappears.
 imran-khan8
on 27 Mar 2018
imran-khan8
on 27 Mar 2018
if you keep the mouse, it will be back.
Sent from Outlookhttp://aka.ms/weboutlook
From: imran-khan8 notifications@github.com
Sent: Tuesday, March 27, 2018 1:54 PM
To: valor-software/ng2-charts
Cc: karthik67; Comment
Subject: Re: [valor-software/ng2-charts] How to display value above bar chart (#662)
Thank you @philippegaberthttps://github.com/philippegabert. I see one problem with that, as soon as I move mouse over the chart, the values disappears.
—
You are receiving this because you commented.
Reply to this email directly, view it on GitHubhttps://github.com/valor-software/ng2-charts/issues/662#issuecomment-376616590, or mute the threadhttps://github.com/notifications/unsubscribe-auth/AJp6AorCYNUeI7MlU-PfGsVctLZtLgrFks5tiny4gaJpZM4MU3kv.
karthik67
on 27 Mar 2018
Hi @karthik67 @imran-khan8 @guto-gomes
Any solution so that data remains on the bar even if tooltip is displayed or on hover. Currently on mouse over it disappears
 manhar-developer
on 12 Jul 2018
manhar-developer
on 12 Jul 2018
can anyone help to show total value(addition of all bar chart value in stacked chart) to show at top in stacked bar chart.
 vinitkrb
on 24 Aug 2018
vinitkrb
on 24 Aug 2018
@vinitkrb I inserted with the following code:
animation: {
      onComplete: function () {
        const chartInstance = this.chart,
          ctx = chartInstance.ctx;

        const fontSize = 20;
        const fontStyle = '600';
        const fontFamily = 'Open Sans';
        ctx.font = Chart.helpers.fontString(fontSize, fontStyle, fontFamily);

        ctx.textAlign = 'center';
        ctx.textBaseline = 'bottom';
        ctx.fillStyle = '#676A6C';

        this.data.datasets.forEach(function (dataset, i) {
          const meta = chartInstance.controller.getDatasetMeta(i);
          meta.data.forEach(function (bar, index) {
            if(dataset.data[index] != 0){
              const data = dataset.data[index] + '%';
              ctx.fillText(data, bar._model.x, bar._model.y - 0);
            }
          });
        });
      }
    },
not working
vinitkrb
on 27 Aug 2018
@guto-gomes
just open the image its coming like this but i want like following image.
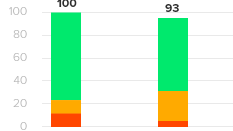
vinitkrb
on 27 Aug 2018
Hi @karthik67 @imran-khan8 @guto-gomes
Any solution so that data remains on the bar even if tooltip is displayed or on hover. Currently on mouse over it disappears
Did someone found a way? I really need something like this
 DiegoArredondo
on 24 Oct 2018
DiegoArredondo
on 24 Oct 2018
Hello,
Is there any way to put the values of the 'X' and 'Y' axis next to the point in the line graph at each point?
 tucamefe
on 15 Jan 2019
tucamefe
on 15 Jan 2019
Use chartjs-plugin-datalabels which is robust and full featured. Check this stackblitz: https://stackblitz.com/edit/ng2-charts-bar-labels

 paviad
on 8 Mar 2019
paviad
on 8 Mar 2019
You can duplicate the code for the onComplete event for the onProgress event, which will only cause a slight flicker but this is better than it disappearing and reappearing:
    animation: {
      onComplete: function () {
          var chartInstance = this.chart,
              ctx = chartInstance.ctx;

          ctx.textAlign = 'center';
          ctx.textBaseline = 'bottom';

          this.data.datasets.forEach(function (dataset, i) {
              var meta = chartInstance.controller.getDatasetMeta(i);
              meta.data.forEach(function (bar, index) {
                  var data = dataset.data[index];
                  ctx.fillText(data, bar._model.x, bar._model.y - 5);
              });
          });
      },
      onProgress: function () {
          var chartInstance = this.chart,
              ctx = chartInstance.ctx;

          ctx.textAlign = 'center';
          ctx.textBaseline = 'bottom';

          this.data.datasets.forEach(function (dataset, i) {
              var meta = chartInstance.controller.getDatasetMeta(i);
              meta.data.forEach(function (bar, index) {
                  var data = dataset.data[index];
                  ctx.fillText(data, bar._model.x, bar._model.y - 5);
              });
          });
      }
  }
 henkkruger
on 24 Feb 2020
henkkruger
on 24 Feb 2020
Related issues
 martinpinto
·
3Comments
martinpinto
·
3Comments
 shyamal890
·
4Comments
shyamal890
·
4Comments
 tssobe
·
4Comments
tssobe
·
4Comments
 shenriksen4
·
3Comments
shenriksen4
·
3Comments
 SteeledSlagle13
·
3Comments
SteeledSlagle13
·
3Comments
Most helpful comment
In your file Component.ts
Actually you need to update your barChartOptions to add the animation part.
If your current options are:
You should replace them with: