Nextflow: Workflow report should warn if some task executions were ignored
It would be great if the Workflow Report (and other things) could warn if there were tasks that failed but were ignored. To do this, it would great to have variables with the counts of different task outputs. For example:
workflow.task_counts.success
workflow.task_counts.cached
workflow.task_counts.failed
workflow.task_counts.ignored
..or whatever makes sense.
There can be some complication with tasks that fail but are resubmitted and succeed, but I guess if we can just count the ignored ones then we should be fine (we will get a pipeline error if something fails properly).
Thanks!
Phil
 ewels
ewels
All 53 comments
Ok. It's quite straightforward. I add stats attribute in metadata will all this number. Then you will add in the report.
 pditommaso
on 24 Nov 2017
pditommaso
on 24 Nov 2017
Interesting point, now failing task for which the error strategy ignore are reported as FAILED. Maybe it make sense to report them as IGNORED, tho it gives me the impression to be a bit ambiguous (ignored why?)
pditommaso
on 24 Nov 2017
When a task fail and the execution is retried, should ignored tasks counter be incremented? Also the status flag should continue to be FAILED or something else? What do you think? cc @emi80
pditommaso
on 28 Nov 2017
No, ignored counter shouldn't be incremented if we retry - the reason I want this feature is so that we know when failed tasks have been skipped due to being ignored. If they're retried and succeed then we don't need to warn about it in the summary report.
How about having FAILED_RETRY, FAILED_IGNORE, FAILED_FINISH, FAILED_IGNORE statuses instead? Then no counter required (easy to count ourselves). Or alternatively a new field called failure_action with RETRY, IGNORE, FINISH, IGNORE or something?
Phil
ewels
on 28 Nov 2017
I agree with @ewels that ignored counter should not be incremented when processes are retried.
For the status info I would go for a new field. Maybe it can be called error_strategy for consistency?
 emi80
on 28 Nov 2017
emi80
on 28 Nov 2017
I agree with @ewels that ignored counter should not be incremented when processes are retried.
I agree as well
For the status info I would go for a new field. Maybe it can be called error_strategy for consistency?
The IGNORE status would have been better in term of readability, tho a new field appears to be a more sustainable solution. I would go for error_action because it when it's a dynamic errorStrategy it will container the actual strategy applied.
pditommaso
on 29 Nov 2017
Sounds good! Works for me :)
ewels
on 29 Nov 2017
OK. I've added a new stats field in the metadata object with the following structure: WorkflowStats it should contains all information you need.
It includes also the compute time, that is showed here
Things to do:
- shows a warning when there are ignored task executions
- shows
error_actioncolumn in the tasks table (likely at the right of status column)
All changes are here. I'm working in the issue_534-workflow-stats branch.
I'm leaving it in your hands for the visualisation part. Thanks!
pditommaso
on 30 Nov 2017
Super cool - thanks @pditommaso! Additional CPU time stats are also really nice (and gives a good namespace to add in new features in the future too 😉 )
Will get to the front end as soon - lots on in the next week or two but will try to get to it when I get a chance! (or fancy a break from report writing!)
ewels
on 30 Nov 2017
ps. I guess that all of this is only available after the workflow has finished? I'm wondering whether it's possible to use this to add in a section to MultiQC reports with the same warning...
ewels
on 30 Nov 2017
fancy a break from report writing
Coding is much relaxing and healthy than fika time to have a break 😂
pditommaso
on 30 Nov 2017
I guess that all of this is only available after the workflow has finished? I'm wondering whether it's possible to use this to add in a section to MultiQC reports with the same warning
Main question is how would you include this info in the MultiQC report, as a CLI option ?
pditommaso
on 30 Nov 2017
Probably easiest as a input file, using custom content parsing. This is how we add a section with all of the software versions - see example file here (from the NGI-ChIPseq pipeline).
Could also do it using a MultiQC config file, or purely on the command line in theory, if you're feeling ambitious.
ewels
on 30 Nov 2017
I see. That info should even be available at run time, but I need to think how could be made available to a user task.
pditommaso
on 30 Nov 2017
Have you had any chance to have a look at this? it would be better to close it before starting to work on #547.
pditommaso
on 11 Dec 2017
The WorkflowStats has been merged in the master and it's going to be release with version 0.27.0. However the collected counters are not showed in the execution report.
This feature will be completed with version 0.28.0.
pditommaso
on 20 Dec 2017
eek, sorry for being slow!
ewels
on 20 Dec 2017
No problem. You have requested this enhancement! 😉
pditommaso
on 20 Dec 2017
Hi @pditommaso,
I just had a look at this, but it's always the basic groovy stuff that stumps me. How do I get the workflow stuff into the JSON output? If you could dump it into the report as JSON (either part of the window.data payload, or a new window.anything) then I can whip the front end together quickly enough..
Cheers,
Phil
ewels
on 14 Jan 2018
Sorry, I should habe mentioned that. That info provided by the WorkflowStats class e.g.
workflow.stats.getSucceedCount()
workflow.stats.getFailedCount()
workflow.stats.getCachedCount()
..
also, don't forget that getter methods (ie. method prefixed with get such as getSometing()) can be accessed just as something therefore also the following is valid:
workflow.stats.succeedCount
workflow.stats.failedCount
workflow.stats.cachedCount
..
Ok great, thanks! Do I have to do any import statement to get at workflow.stats? And presumably I need to write some kind of function like this one? Can I just use something like JsonOutput.toJson()?
ewels
on 15 Jan 2018
Why do you need that? It's not enough to render that info in the HTML eg here ?
pditommaso
on 15 Jan 2018
Aha, I can do that directly? Awesome! Yes that’s much better :)
ewels
on 15 Jan 2018
I've update this showing a warning message when one or more tasks were ignored. Also the tasks stats counts are reported at the bottom. Please give a look and feel to propose improvements.
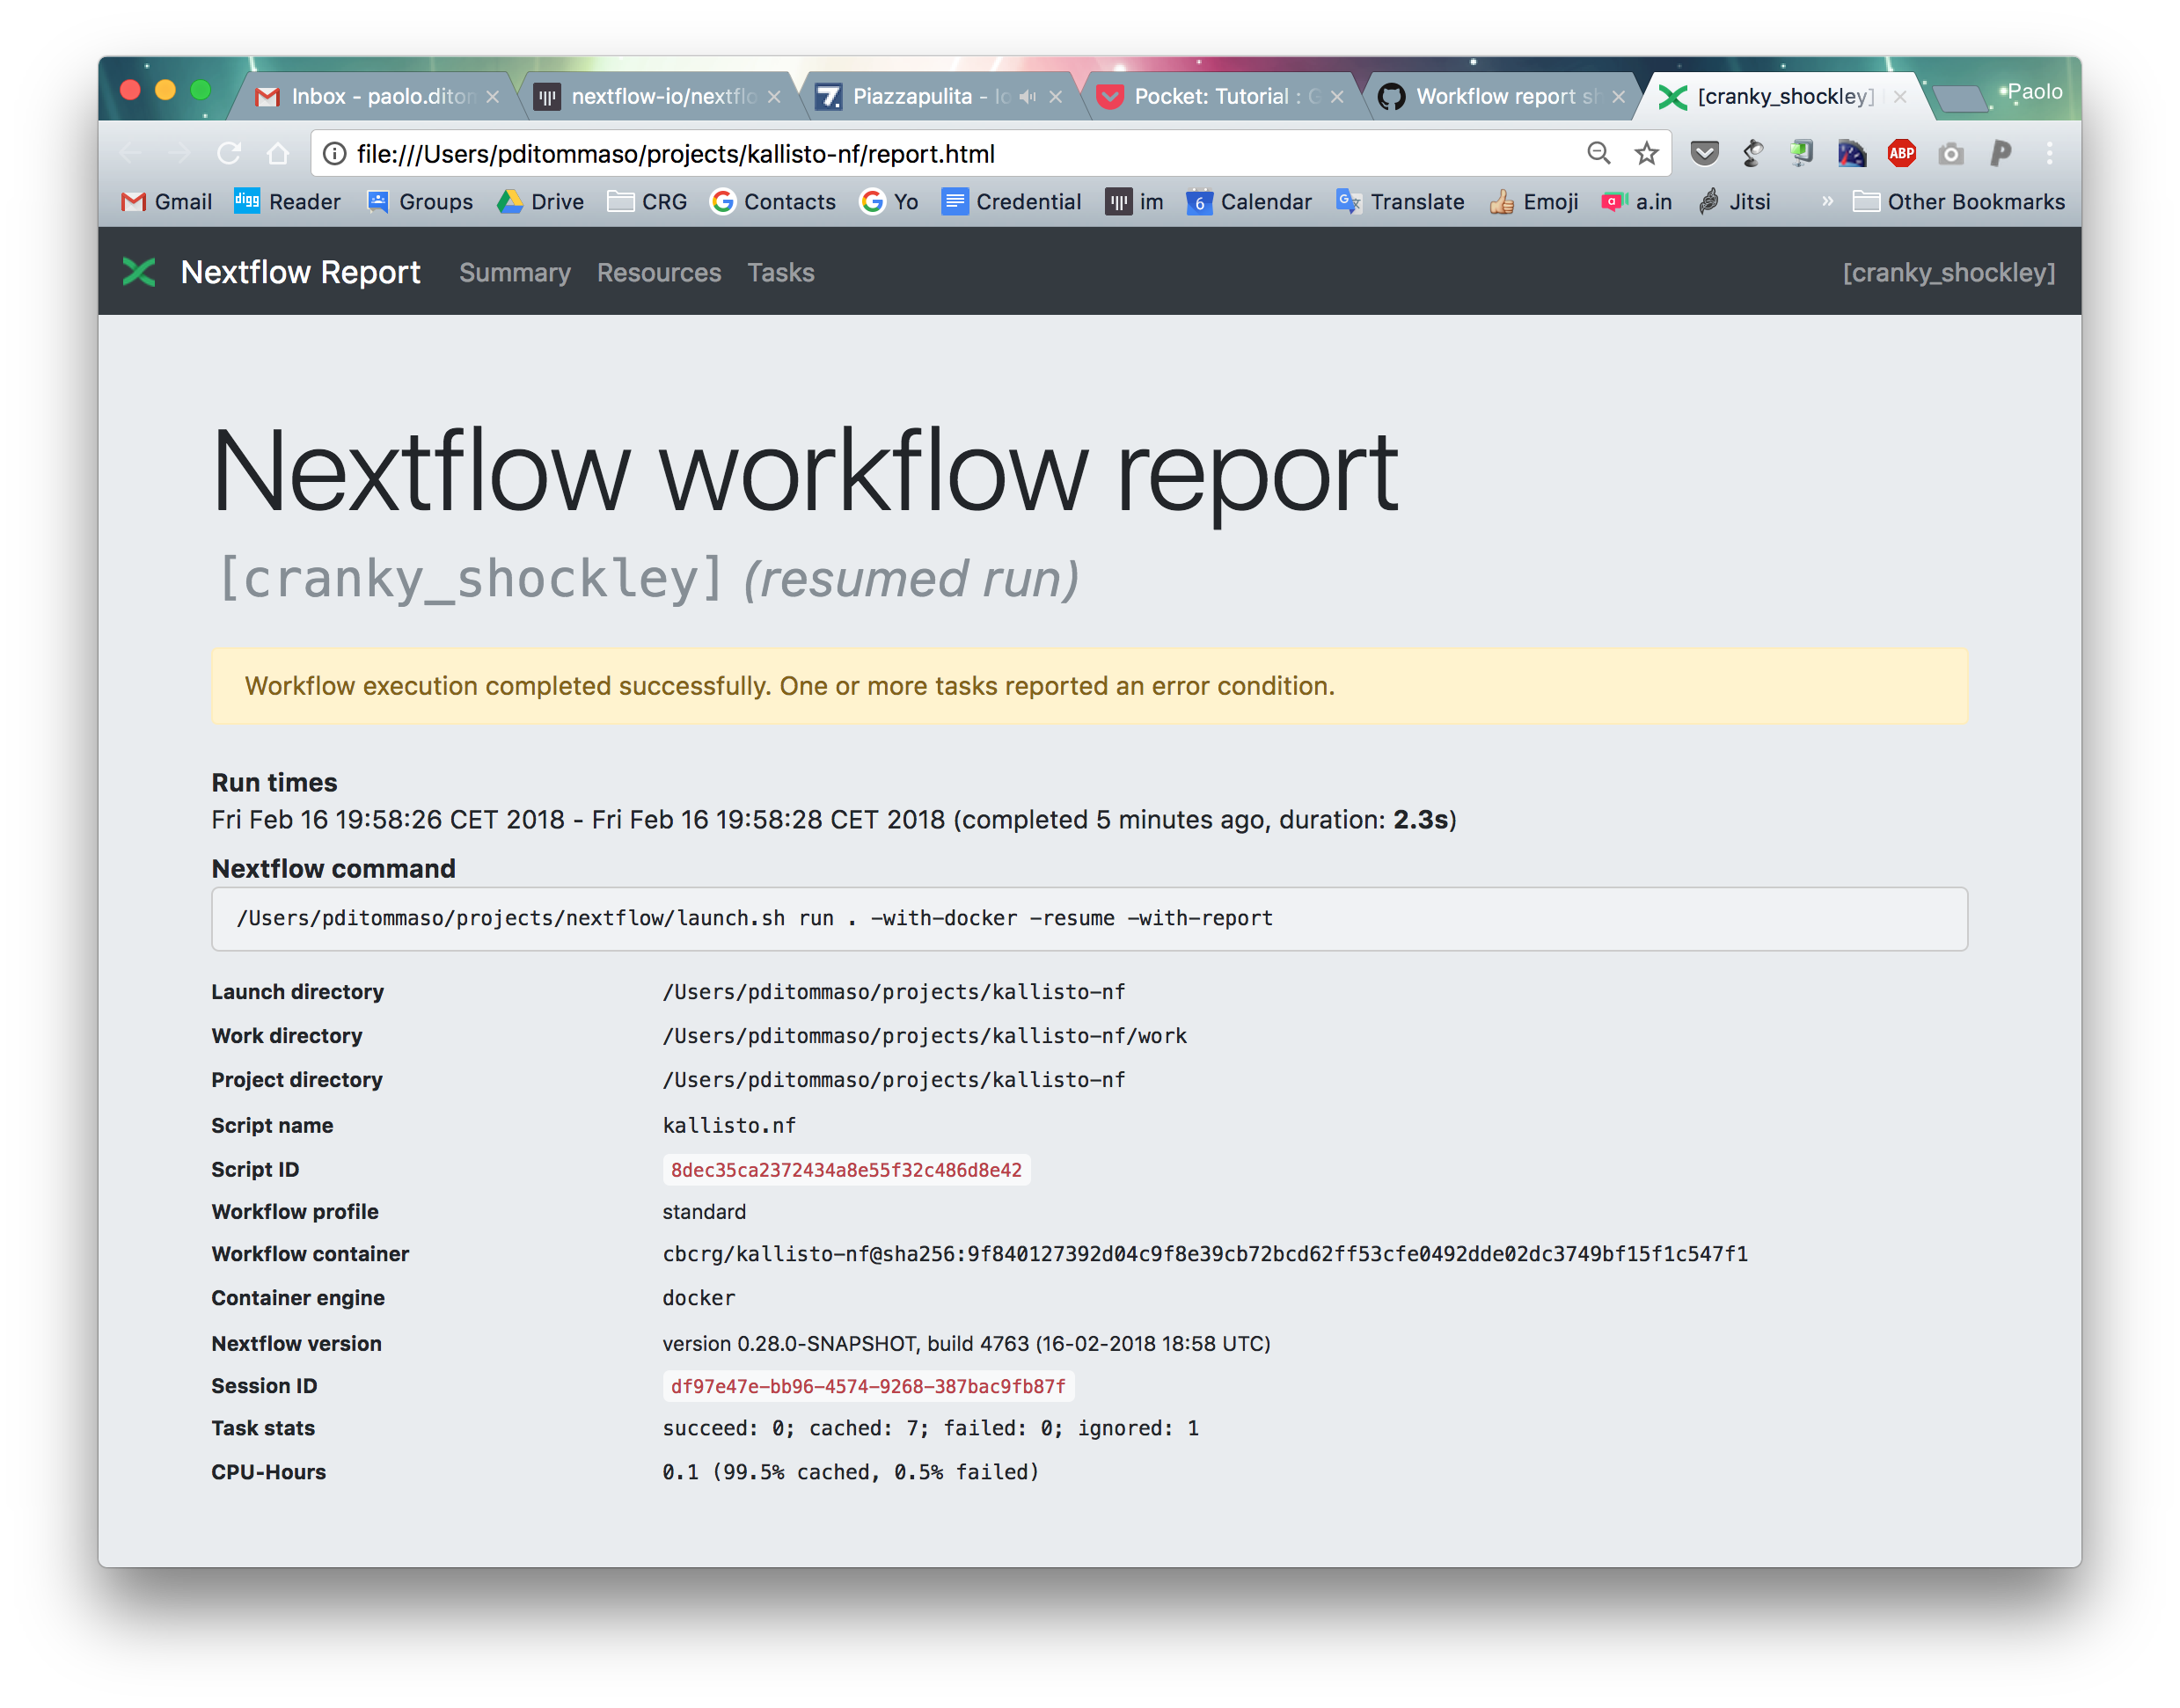
pditommaso
on 16 Feb 2018
reopening this, because the same warning should be displayed in the notification email.
pditommaso
on 27 Feb 2018
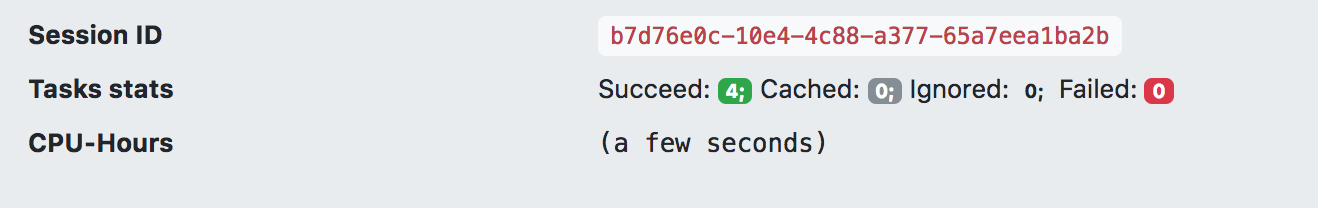
Also, minor minor request if you have the files open: Could the order of the task stats be changed to success > cached > ignored > failed?
Also you could use badges, eg:
Succeeded: <span class="badge badge-success">0</span>;
Cached: <span class="badge badge-secondary">7</span>;
Ignored: <span class="badge badge-warn">0</span>;
Failed: <span class="badge badge-danger">1</span>;
Gives a little more context for fast reading. May look horrible though, so feel free to ignore 😁
NB: Drop the <samp> tags if doing this.
ewels
on 27 Feb 2018
pps. The badge classes won't be available in the email. So you'll have to make the CSS in-line there.
ewels
on 27 Feb 2018
OK, this goes in the RC2
pditommaso
on 27 Feb 2018
The color badges remind me too much the italian flag :)
I think I will only keep the red for the errors
pditommaso
on 27 Feb 2018
I've moved back the CPU-Hours and Tasks stats just after the command line. What do you think ?
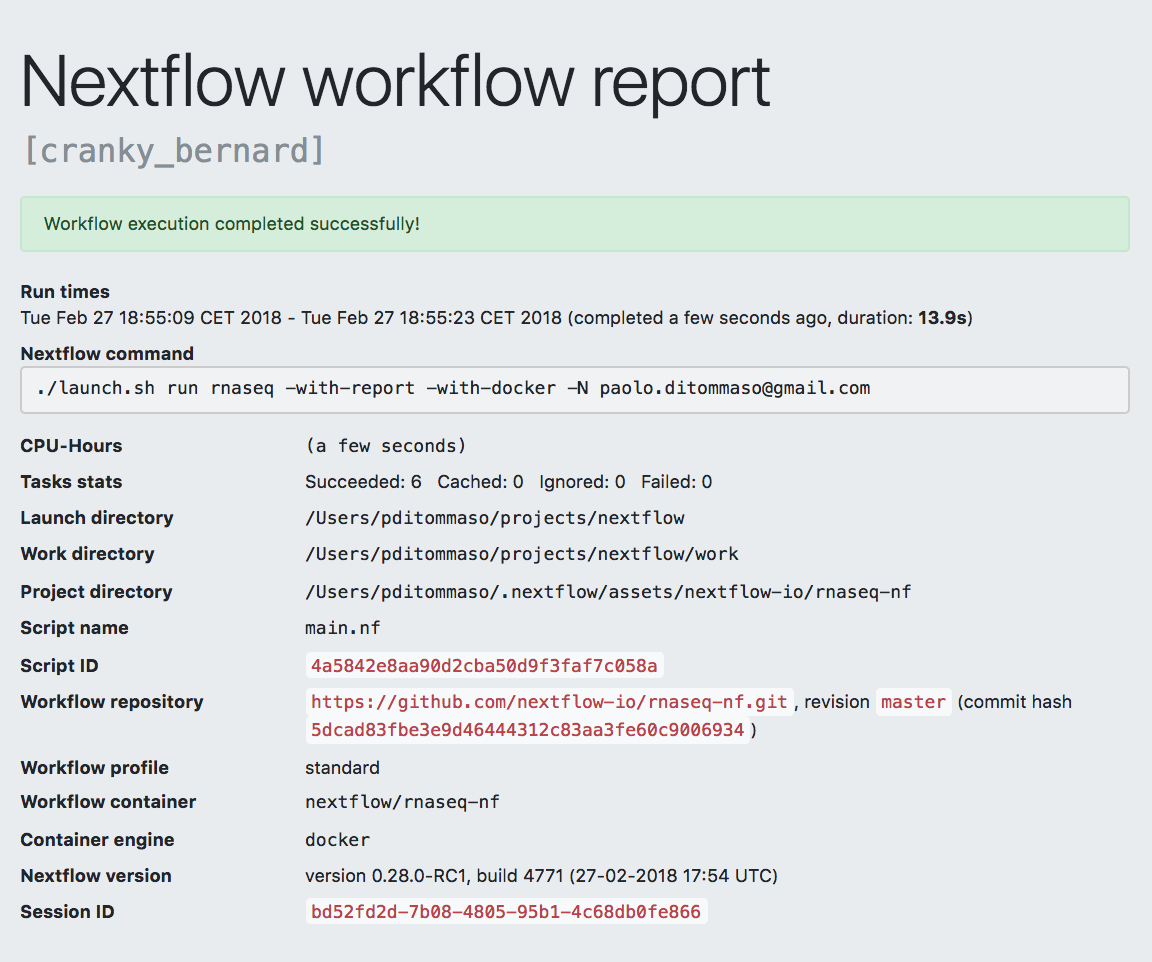
pditommaso
on 27 Feb 2018
You could be really fancy and do a stacked progress bar ;) http://getbootstrap.com/docs/4.0/components/progress/
Note that the ignored one broke, it should be yellow. But yeah I agree that it looks a little odd.
For me this is probably the main thing that I want to see, so I’d be tempted to put it right at the top above run times maybe? :+1:
ewels
on 27 Feb 2018
That's nice! but I think I won't be able to do that, at least for now. Feel free to give a try.
Note that the ignored one broke, it should be yellow. But yeah I agree that it looks a little odd.
Yep, can be a bit confusing all that color, If there are ignored tasks the top box is yellow I think it's enough.
For me this is probably the main thing that I want to see, so I’d be tempted to put it right at the top above run times maybe?
I would agree, but that would break the grid layout, because it would be
Run times
Wed Feb 28 10:03:26 CET 2018 - Wed Feb 28 10:03:26 CET 2018
CPU-Hours
1000 hours
Tasks stats
Succeeded: 6 Cached: 0 Ignored: 0 Failed: 0
Nextflow command
nextflow run ... something
then the table
But yes, having the stacked progress bar, instead in place of the tasks stats number, would be nice and also solve this problem.
pditommaso
on 28 Feb 2018
<div class="progress">
  <div style="width: 70%" class="progress-bar bg-success">7 succeeded</div>
  <div style="width: 10%" class="progress-bar bg-info">1 cached</div>
  <div style="width: 10%" class="progress-bar bg-warning">1 ignored</div>
  <div style="width: 10%" class="progress-bar bg-danger">1 failed</div>
</div>
https://www.bootply.com/R1NMcq11Y8

(crappy printscreen, caught the edges of the screen sorry)
ewels
on 28 Feb 2018
Wow, cool. you are a star! is there any need to import extra css?
pditommaso
on 28 Feb 2018
Not for the report I think - it's using the Bootstrap framework so everything should be included already. Just taking the above example and switching in the counts and the percentages should be enough.
For the HTML email (assuming that it works as I think it does off the top of my head), you can't include CSS files. So all of the styling has to be inline. But this is pretty easy to do with a bit of copy and paste from a browser inspector.. eg:
<div style="font-family: -apple-system,BlinkMacSystemFont,'Segoe UI',Roboto,'Helvetica Neue',Arial,sans-serif,'Apple Color Emoji','Segoe UI Emoji','Segoe UI Symbol'; display: flex; height: 1rem; overflow: hidden; font-size: .75rem; background-color: #e9ecef; border-radius: .25rem; box-sizing: border-box; font-weight: 400; line-height: 1.5; color: #212529; text-align: left;">
  <div style="width: 70%; background-color: #28a745; display: -webkit-box; display: -ms-flexbox; display: flex; -webkit-box-orient: vertical; -webkit-box-direction: normal; -ms-flex-direction: column; flex-direction: column; -webkit-box-pack: center; -ms-flex-pack: center; justify-content: center; color: #fff; text-align: center; transition: width .6s ease;" class="">7 succeeded</div>
  <div style="width: 10%; background-color: #17a2b8; display: -webkit-box; display: -ms-flexbox; display: flex; -webkit-box-orient: vertical; -webkit-box-direction: normal; -ms-flex-direction: column; flex-direction: column; -webkit-box-pack: center; -ms-flex-pack: center; justify-content: center; color: #fff; text-align: center; transition: width .6s ease;">1 cached</div>
  <div style="width: 10%; background-color: #ffc107; display: -webkit-box; display: -ms-flexbox; display: flex; -webkit-box-orient: vertical; -webkit-box-direction: normal; -ms-flex-direction: column; flex-direction: column; -webkit-box-pack: center; -ms-flex-pack: center; justify-content: center; color: #fff; text-align: center; transition: width .6s ease;">1 ignored</div>
  <div style="width: 10%; background-color: #dc3545; display: -webkit-box; display: -ms-flexbox; display: flex; -webkit-box-orient: vertical; -webkit-box-direction: normal; -ms-flex-direction: column; flex-direction: column; -webkit-box-pack: center; -ms-flex-pack: center; justify-content: center; color: #fff; text-align: center; transition: width .6s ease;">1 failed</div>
</div>
Cool, almost there!
pditommaso
on 28 Feb 2018
There could be a problem to show the label when the bar is too narrow. Is it possible to show an hint popping out when moving the mouse over the bar?
pditommaso
on 28 Feb 2018
One more thing is there a class for grey color (for the cached tasks) ?
pditommaso
on 28 Feb 2018
Sure - after a quick play, I think that the best solution is to add the text-truncate class to hide any text that is too long, and then add tooltips
<div class="progress">
  <div style="width: 70%" class="progress-bar bg-success text-truncate" data-toggle="tooltip" data-placement="top" title="70 tasks succeeded">70 succeeded</div>
  <div style="width: 19%" class="progress-bar bg-secondary text-truncate" data-toggle="tooltip" data-placement="top" title="19 tasks cached">19 cached</div>
  <div style="width: 10%" class="progress-bar bg-warning text-truncate" data-toggle="tooltip" data-placement="top" title="10 tasks had warnings">10 warnings</div>
  <div style="width: 1%" class="progress-bar bg-danger text-truncate" data-toggle="tooltip" data-placement="top" title="1 task failed">1 failed</div>
</div>

https://www.bootply.com/c284jeGuKO
One more thing is there a class for
greycolor (for the cached tasks) ?
Sure - bg-secondary. The prefixes for bootstrap are always consistent. See: http://getbootstrap.com/docs/4.0/utilities/colors/#background-color
ewels
on 28 Feb 2018
NB: tooltips won't work in the email again, as we have no javascript there.
It's probably best to make this report only, and just have a text output much like we currently do for the email.
ewels
on 28 Feb 2018
OK, the text-truncate is a big help, thanks.
Need to finish the email styling, I repost the question here: how to you get the css attribute expanded from the browser inspector (chrome)? I'm only able to see their value one-by-one, but I would copy and past the html snippet with the expanded css style attributes as you are suggesting.
pditommaso
on 28 Feb 2018
Discussed on gitter, but for posterity, this is a good inliner tool: https://foundation.zurb.com/emails/inliner-v2.html
ewels
on 28 Feb 2018
(or not, as it apparently doesn't work - so back to manual copy and paste)
ewels
on 28 Feb 2018
So, I gave up with the email. I was not able to center the labels in the bar and IMO all that colours were confusing in the email message.
The html report looks fine. I made the bar a bit ticker and added the bootstrap styled tooltip.
Please have a look to the tooltip messages https://github.com/nextflow-io/nextflow/commit/455fcb4f1cda0f6082ec63836604516089121fee#diff-10e84deb11b0d36efea82b75f490289fR144
The only thing that I'm not happy is that the Task table filter and values selection fields are not aligned, maybe @emi80 can help here.
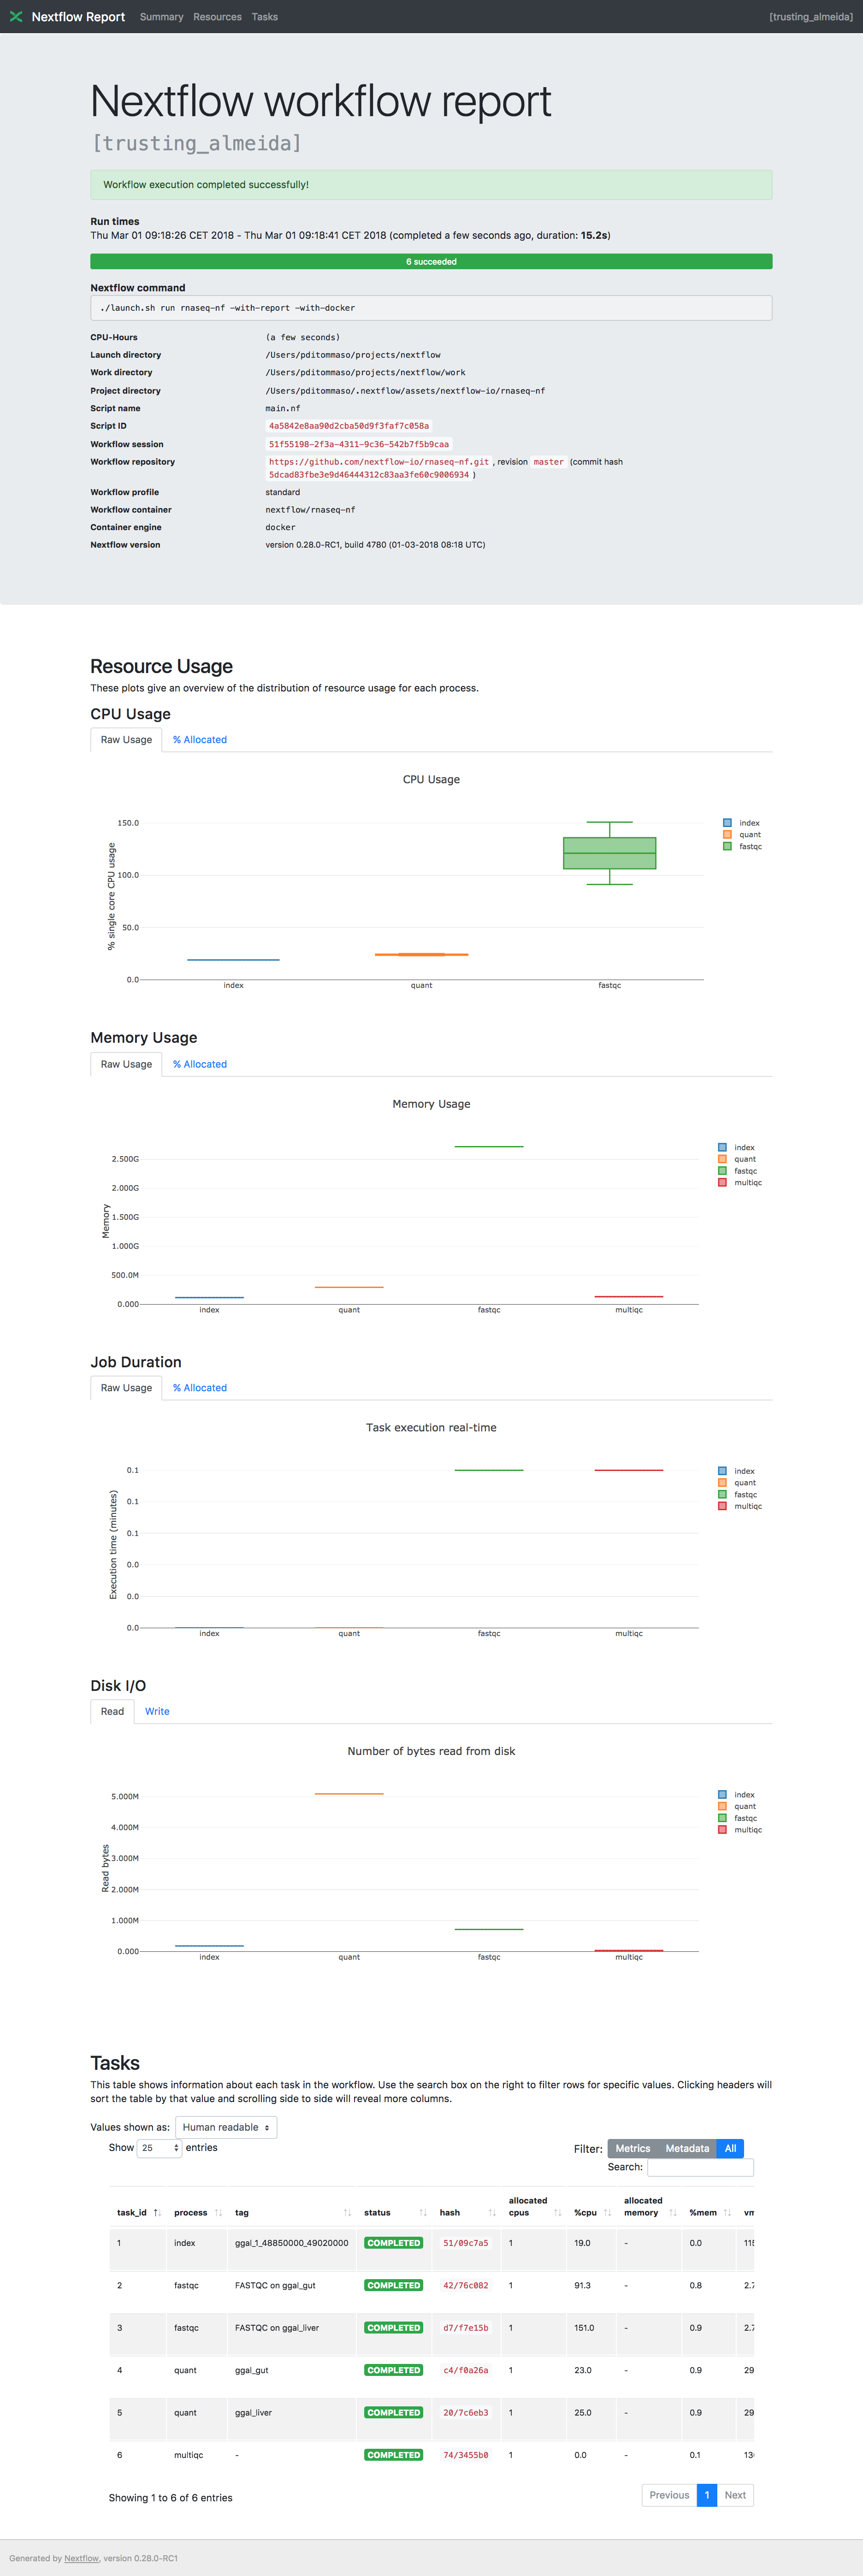
pditommaso
on 1 Mar 2018
Changed few thing in the report CSS. Can you guys have a quick look?
On Thu, Mar 1, 2018 at 9:51 AM, Paolo Di Tommaso notifications@github.com
wrote:
So, I gave up with the email. I was not able to center the labels in the
bar and IMO all that colours were confusing in the email message.The html report looks fine. I made the bar a bit ticker and added the
bootstrap styled tooltip.Please have a look to the tooltip messages 455fcb4#diff-
10e84deb11b0d36efea82b75f490289fR144
https://github.com/nextflow-io/nextflow/commit/455fcb4f1cda0f6082ec63836604516089121fee#diff-10e84deb11b0d36efea82b75f490289fR144The only thing that I'm not happy is that the Task table filter and values
selection fields are not aligned, maybe @emi80 https://github.com/emi80
can help here.[image:
screencapture-file-users-pditommaso-projects-nextflow-report-html-1519892579957]
https://user-images.githubusercontent.com/816968/36835202-c1d2e364-1d35-11e8-83bf-0c98f6f8f1bf.png—
You are receiving this because you were mentioned.
Reply to this email directly, view it on GitHub
https://github.com/nextflow-io/nextflow/issues/534#issuecomment-369519816,
or mute the thread
https://github.com/notifications/unsubscribe-auth/ACof_C1m4LDxFHRtDfCMGZcET6xHiMyqks5tZ7angaJpZM4QqAEh
.
emi80
on 1 Mar 2018
Looks great! Are the dots for the boxplots always hidden now? I thought that was only if there was a huge number of tasks? The progress bar looks brilliant 😀
ewels
on 1 Mar 2018
Are the dots for the boxplots always hidden now?
Yes, that's pity, but having that computing that stuff in the browser is slow even with a few hundreds of tasks (but annoying) and above all it would require to maintain two different javascript implementation to render that chart. That's a bad idea, because it makes difficult to maintain that code and above all the large rendering would never be tested expect in production when you need it, and you know for the murphy low it won't work.
I thunk it's better to keep it simple, at the end the important information is given by the box plot.
pditommaso
on 1 Mar 2018
Fair enough :) Downside is that it's now harder to see which tasks were responsible for pushing up the max (eg. with the hoveron stuff that we were talking about the other day). But I agree that it's simpler this way for sure.
I wonder if we can have a boxplot showing outliers as points? As done on the right hand box plots here. Then we have the best of both worlds - simple plots with only a few points irrespective of how many tasks ran, but with the ability to see which tasks were causing the most problems.
Difficulty is that plot.ly does this for you automatically if given all of the data, which is what we're trying to avoid. All of this would be much easier if there was a groovy / Java plot.ly API and we could render this stuff in Nextflow!
ewels
on 1 Mar 2018
The Java has an excellent javascript engine, unfortunately plotty tries to access in any case DOM objects which are not available in the jvm provided javascript engine.
Exactly which points would you like to show as outliers? I mean it's a matter to have NF that computes these points, then they could be rendered as you are suggesting.
pditommaso
on 1 Mar 2018
aha, I see. I more meant like the plot.ly Python API. There you have functions you call in your code where you already have your data objects, and it returns HTML+javascript snippets to dump into the HTML. Then the HTML itself doesn't contain all the data, only the stuff it needs for the plot.
I guess the outliers are anything that's beyond the whiskers, so it depends on how the whiskers are calculated.
ewels
on 1 Mar 2018
(they're currently min and max, so no outliers. But they could be 1.5x the inter quartile range, or based on the standard deviation, or whatever...)
ewels
on 1 Mar 2018
Exactly. But at this point I would consider this a separate feature.
pditommaso
on 1 Mar 2018
I'm closing this. Feel free to open a separate issue for the improvement you are suggesting.
pditommaso
on 10 Mar 2018
Related issues
 olgabot
·
7Comments
olgabot
·
7Comments
 apeltzer
·
6Comments
apeltzer
·
6Comments
 Z-Zen
·
5Comments
Z-Zen
·
5Comments
 mfoll
·
6Comments
ewels
·
4Comments
mfoll
·
6Comments
ewels
·
4Comments
Most helpful comment
Cool, almost there!