Next-i18next: Add memory leak load testing
As per #450, we need load tests to ensure heap size is stable over hundreds or thousands of requests.
 isaachinman
All 8 comments
Hi! How can I help with this?
 dfvalero
on 16 Aug 2019
dfvalero
on 16 Aug 2019
We need to find a way to:
- Run an npm script, passing in an
--inspectflag, or similar, holding this process open for later assertion - Immediately assert against the memory usage of the process
- Run artillery against a localhost port
- Assert again against the memory usage of the process
- Close the process
isaachinman
on 16 Aug 2019
What I did a while back to profile our application when we had memory leaks in the past was to use https://www.npmjs.com/package/heapdump library.
I took two approaches:
- Take a snapshot of memory when the server starts and one when there is a memory leak
// Start memory reporting block
  if (process.env.NODE_ENV === 'production') {
    heapdump.writeSnapshot(`initial-${Date.now()}.heapsnapshot`)

     memwatch.on('leak', function(info) {
      heapdump.writeSnapshot(`leak-${Date.now()}.heapsnapshot`)

       console.log('-- Memory leak')
      console.log(info)
    })
  }
  // End memory reporting block
Then I would get the snapshot from the server and load on chrome inspector to analyze it.
If I'm not wrong, I think this approach didn't give me anything valuable. So I took a different approach.
- I took a snapshot every 30 minutes, and with that, I had more data to work with:
  // Start memory reporting block
  if (process.env.NODE_ENV === 'production') {
    const initialHeapDumpName = `${Date.now()}.initial.heapsnapshot`
    console.log(`>>> Initial snapshot created with name ${initialHeapDumpName}`)
    heapdump.writeSnapshot(initialHeapDumpName)

    // Take a memory snapshot every 30 minutes
    setInterval(function writeHeapSnapshot() {
      const partialHeapDumpName = `${Date.now()}.interval.heapsnapshot`
      heapdump.writeSnapshot(
        `>>> Partial snapshot created with name ${partialHeapDumpName}`
      )
    }, 1000 * 60 * 30)
  }
  // End memory reporting block
But be aware that while the server is writing the snapshot it blocks the event loop and make your server slow until it finishes the process
 lucasfeliciano
on 29 Aug 2019
lucasfeliciano
on 29 Aug 2019
@lucasfeliciano Nice - interesting stuff. Depending on how we launch the process, it should be as simple as using process.memoryUsage().heapUsed, though, right?
I wonder if there is a util/process-runner that measures heap size over time and allows you to perform assertions. That'd be a really useful package if anyone wants to create and maintain it...
isaachinman
on 30 Aug 2019
@isaachinman If I'm not wrong process.memoryUsage().heapUsed gives us the total amount of memory.
heapdump.writeSnapshot() gives us a snapshot file to load on chrome inspector.
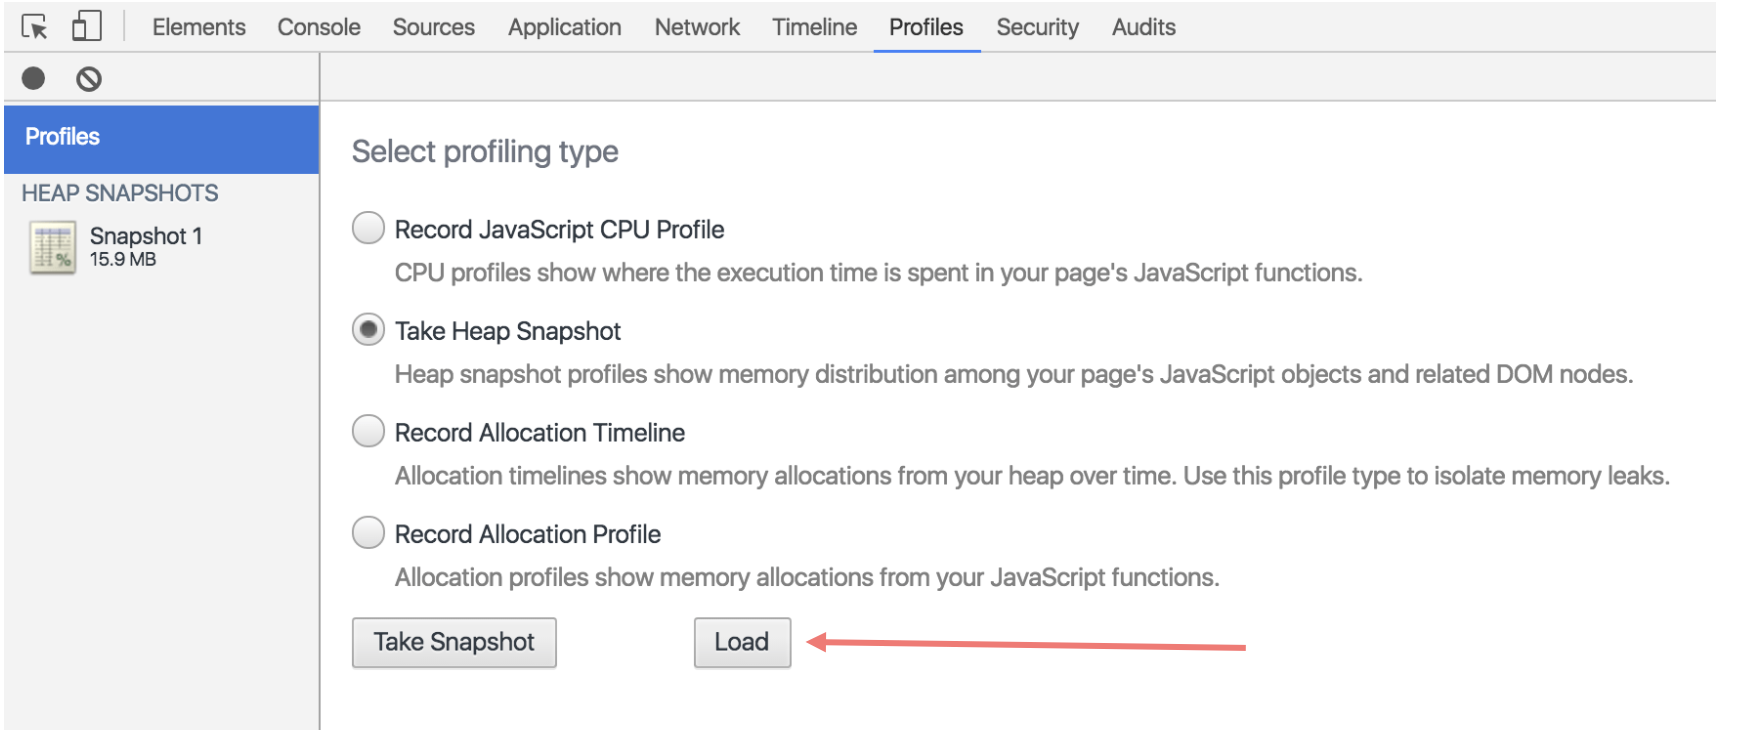
So we can analyze in detail what objects are in the heap.
It is pretty useful!
Check it out: https://developers.google.com/web/tools/chrome-devtools/memory-problems/
lucasfeliciano
on 30 Aug 2019
@lucasfeliciano I'm fully aware of how to analyse via the inspector, but the point is that we need a programmatic way to do this so that it can be run as a blocking step in CI. Is that possible with heap snapshots?
isaachinman
on 30 Aug 2019
We can set a listener using memwatch pacakge which I also used on the snippet above but forgot to mention.
memwatch.on('leak', (info) => {
  console.error('Memory leak detected:\n', info);
});
@lucasfeliciano Interesting! Does memwatch only inspect the process that launched it, or is it also aware of all child processes?
isaachinman
on 3 Sep 2019
Related issues
 sb-bilal-dev
·
6Comments
sb-bilal-dev
·
6Comments
 Jonesus
·
6Comments
Jonesus
·
6Comments
 denny7
·
6Comments
denny7
·
6Comments
 chayakornwc
·
6Comments
chayakornwc
·
6Comments
 HectorLS
·
6Comments
HectorLS
·
6Comments
Most helpful comment
What I did a while back to profile our application when we had memory leaks in the past was to use https://www.npmjs.com/package/heapdump library.
I took two approaches:
Then I would get the snapshot from the server and load on chrome inspector to analyze it.
If I'm not wrong, I think this approach didn't give me anything valuable. So I took a different approach.
But be aware that while the server is writing the snapshot it blocks the event loop and make your server slow until it finishes the process