Netdata: Incorrect metrics after update (1.13.0 to 1.17.1)
Bug report summary
Incorrect metrics after update (1.13 to 1.17)
OS / Environment
Master/slave setup on Ubuntu 16.04.
Netdata version (ouput of netdata -V)
netdata v1.17.1-17-gd5a3e415
Component Name
Web interface, graphs
Steps To Reproduce
Didn't try (can update other servers and see if this happens again).
Expected behavior
Correct metrics.
Long description
Hi!
First, thank you for your great product! It really helps monitoring our servers. The fact that it is free immensely matters for small startups like ours.
Until today we had NetData v1.13.0-8-g483cdc9d running on all our Ubuntu 16.04 servers (1 master, many slaves). I started updating to latest 1.17 using script kickstart (curl -Ss -o kickstart-static64.sh https://my-netdata.io/kickstart-static64.sh, then ./kickstart-static64.sh).
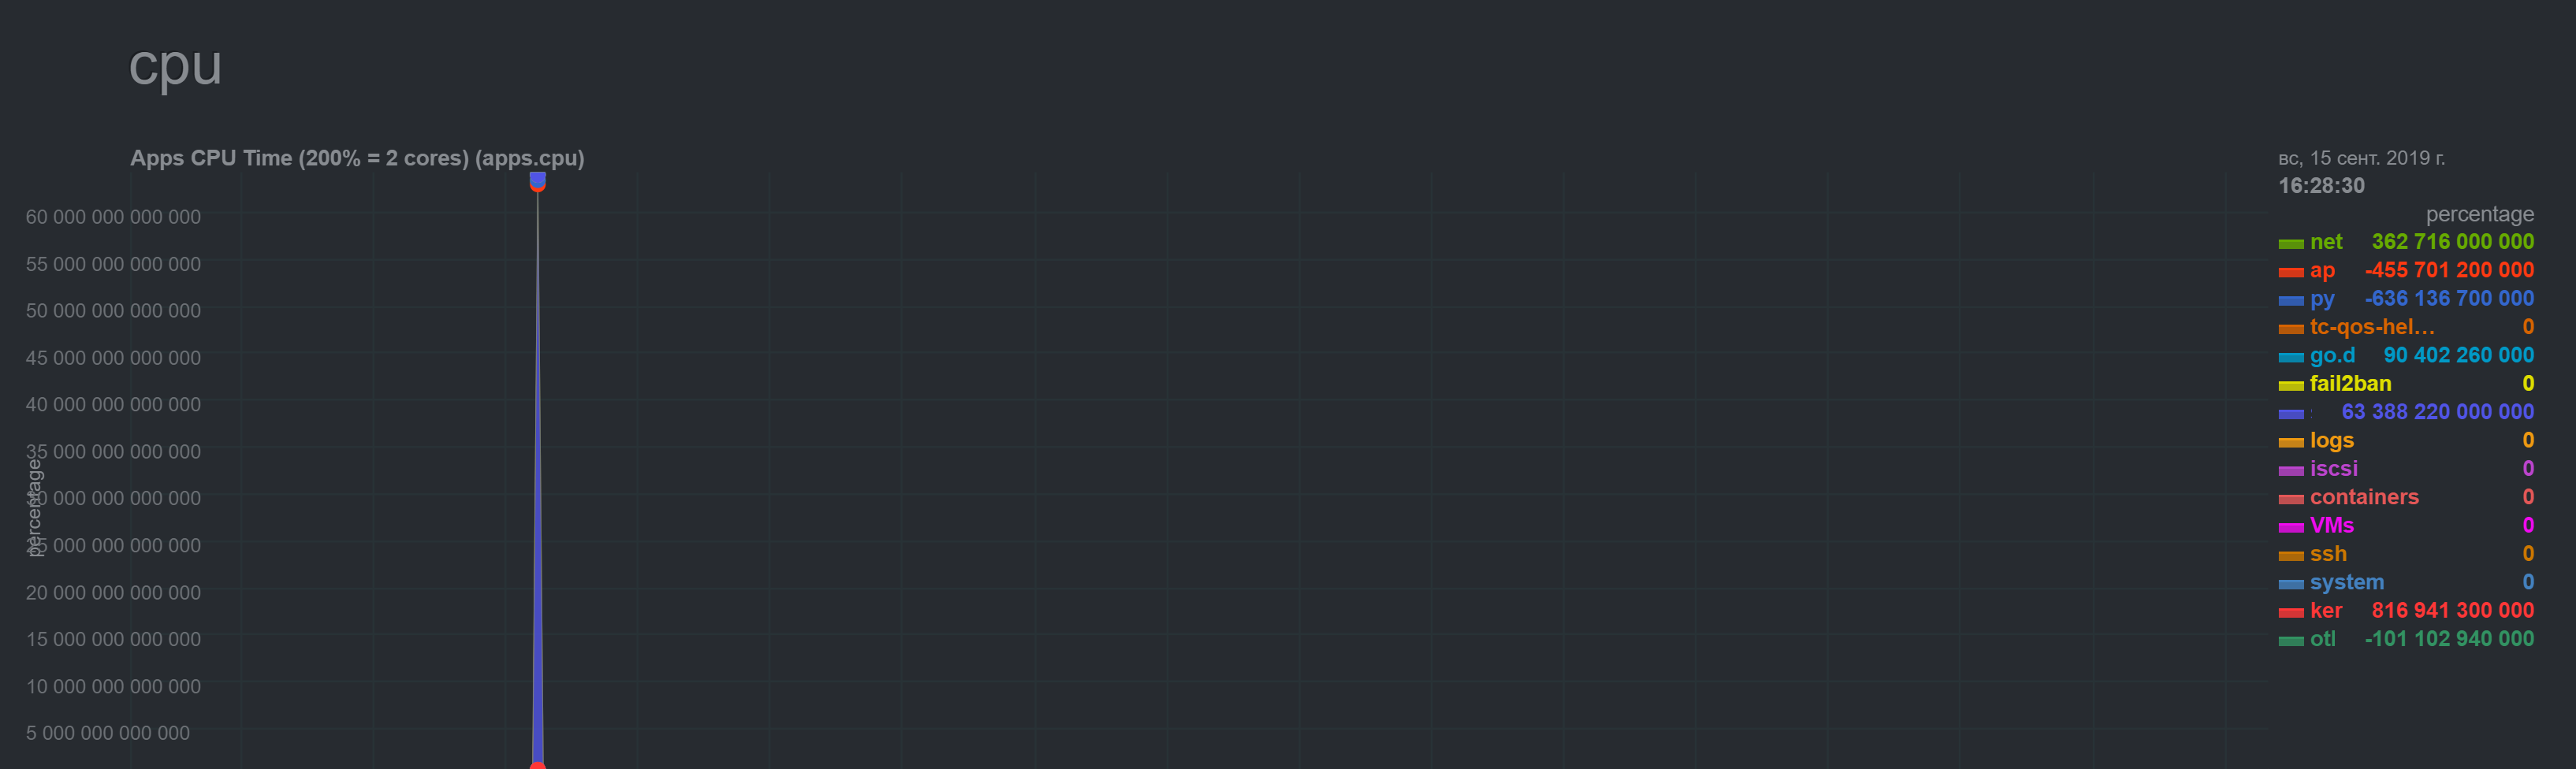
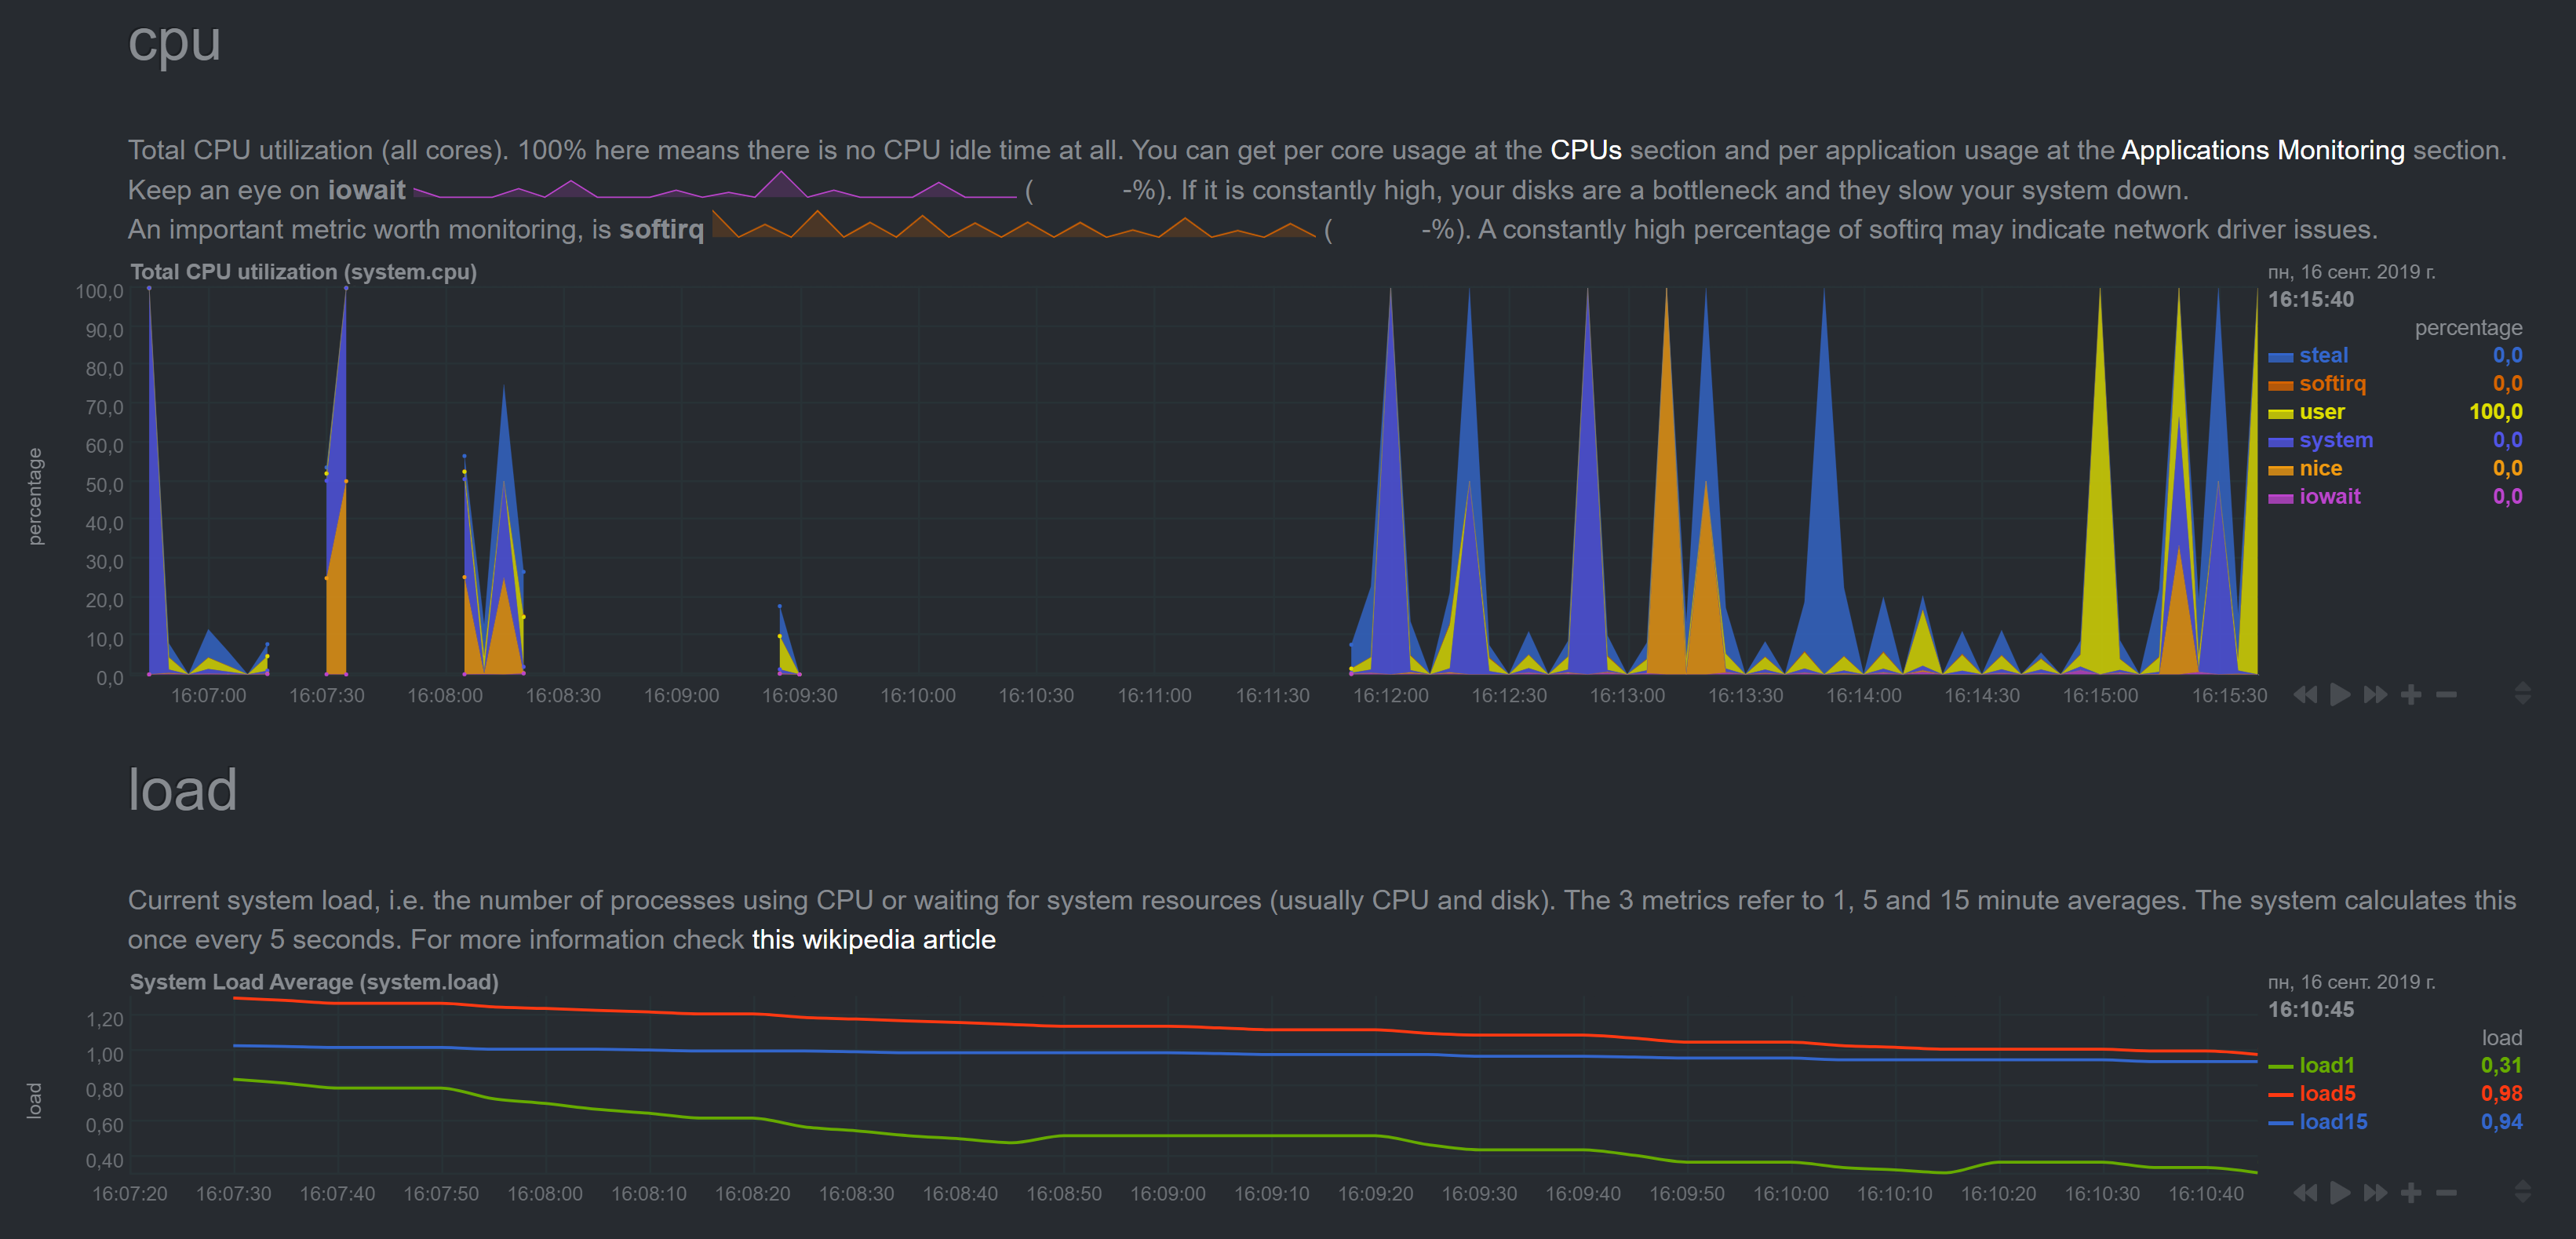
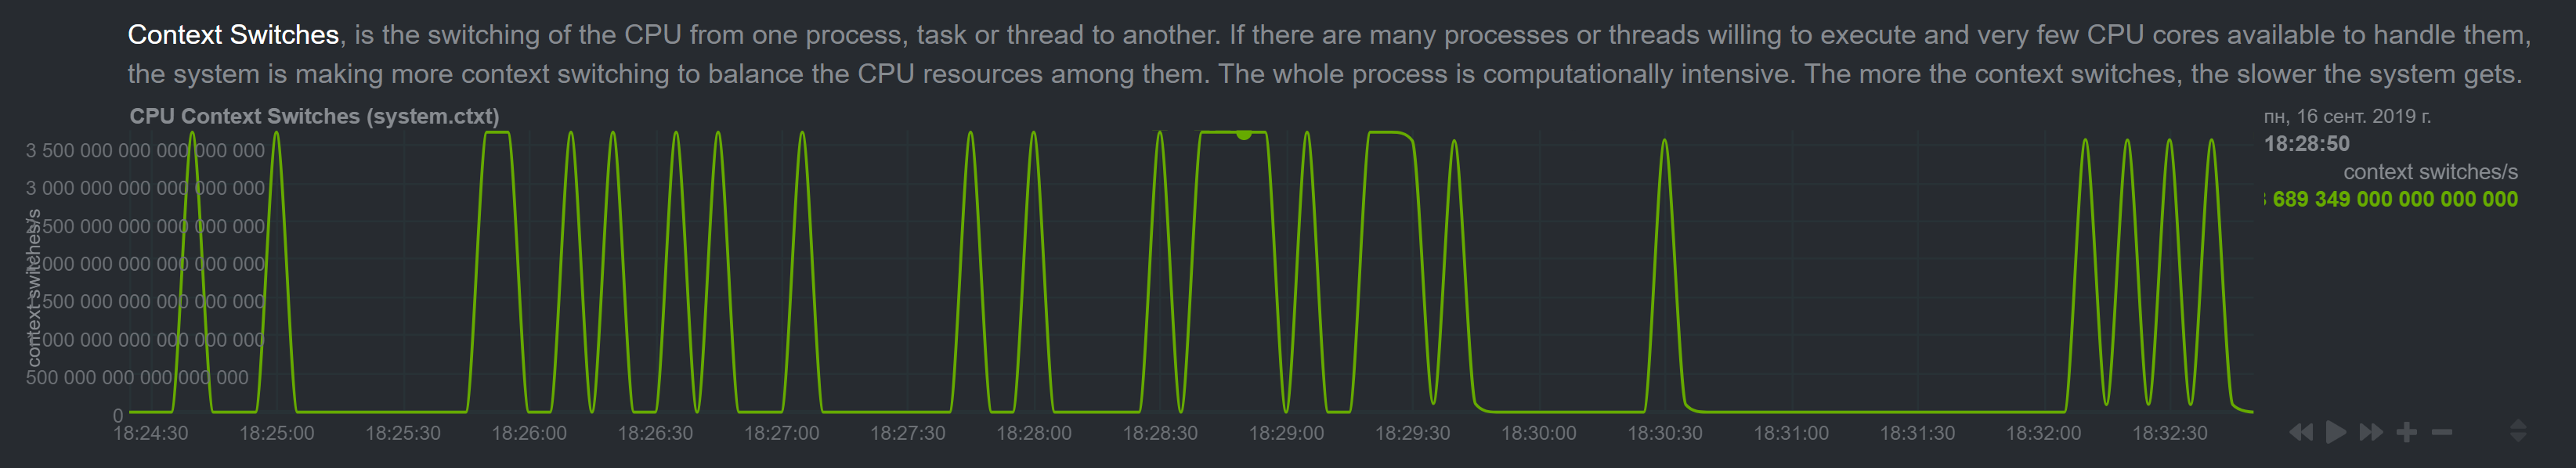
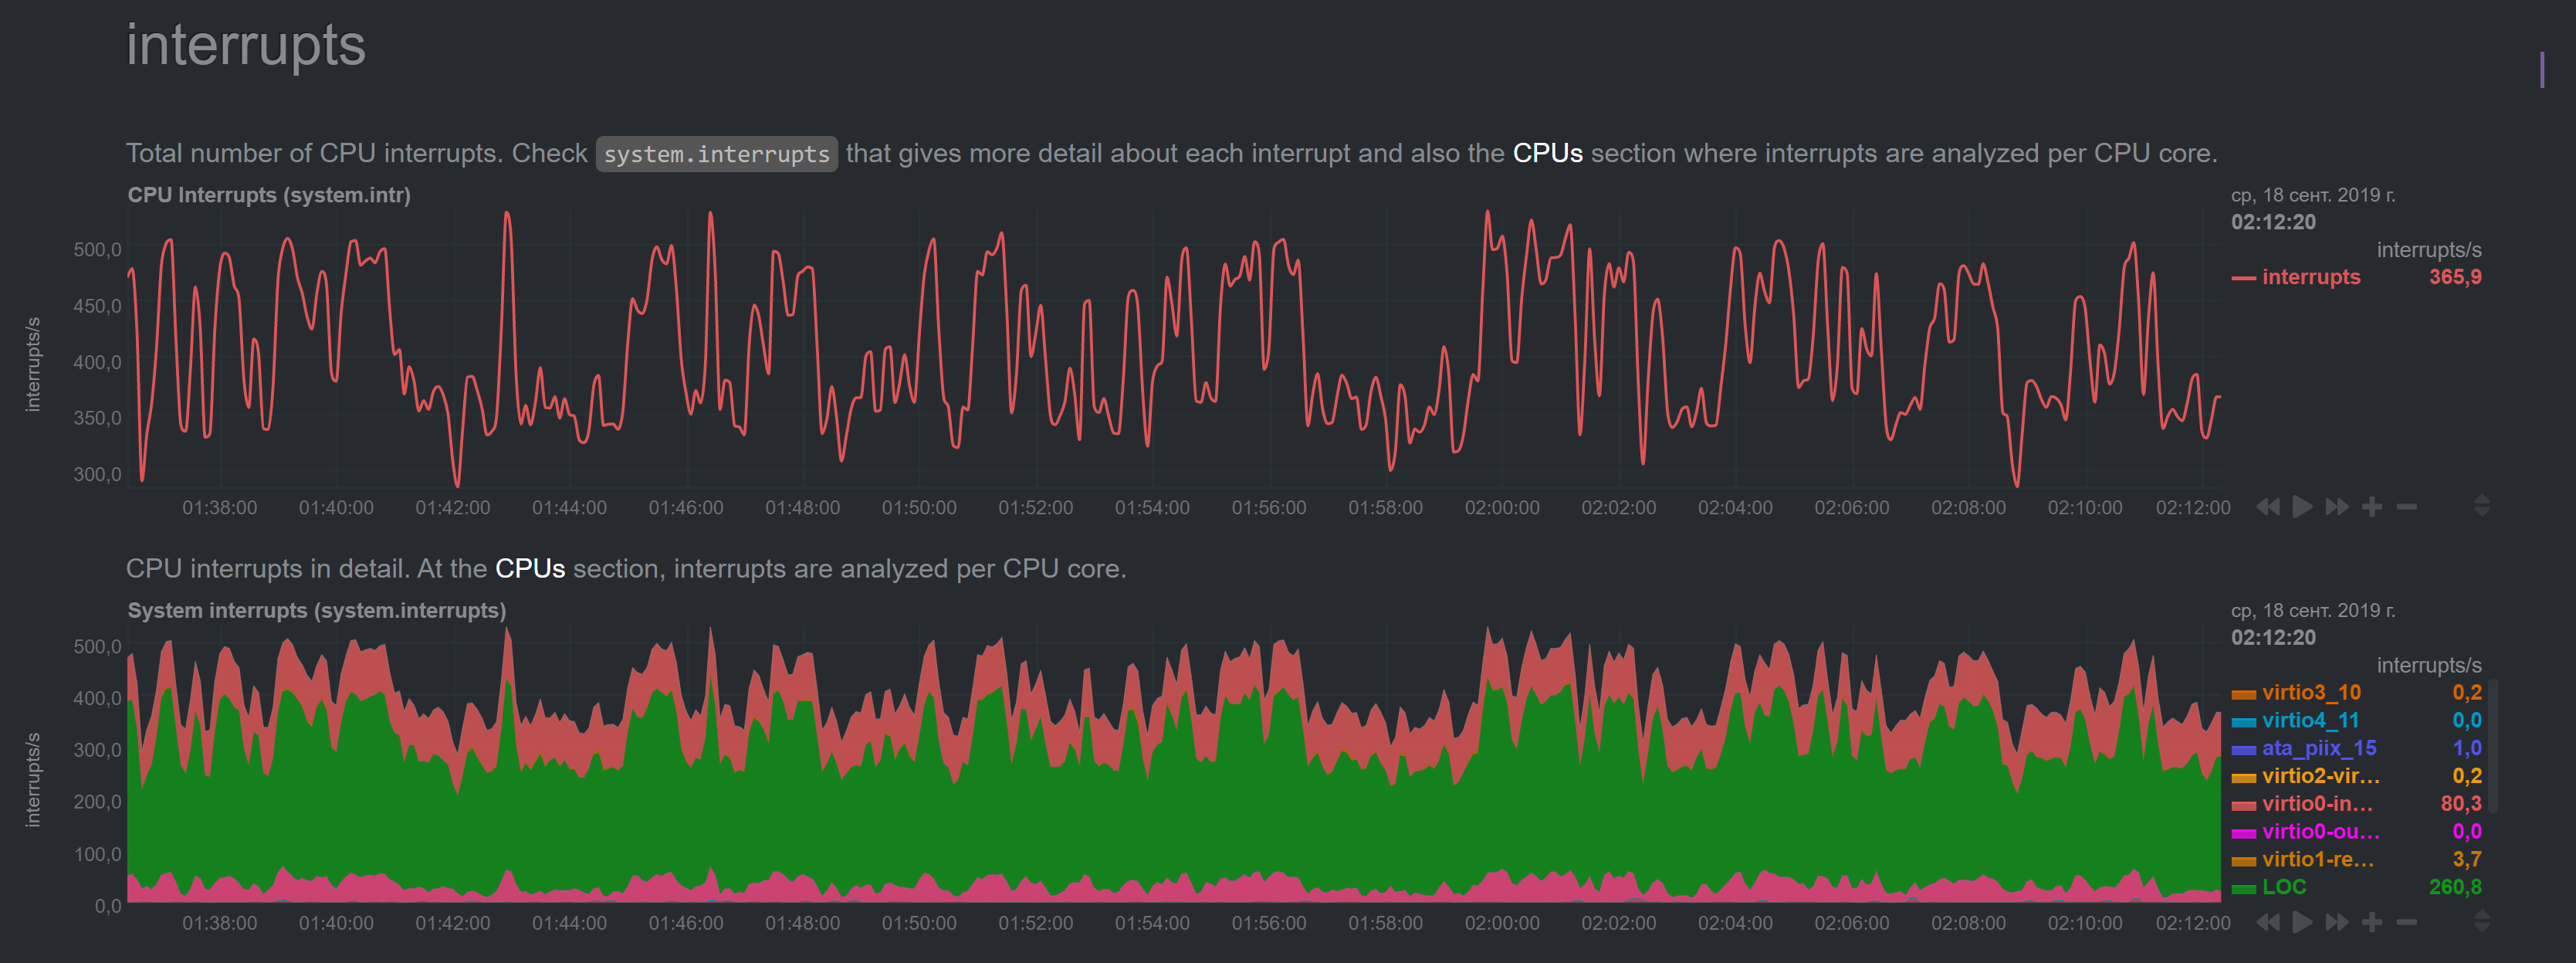
Master server was updated without issues (metrics look ok). But metrics for the next machine started to show insane numbers:
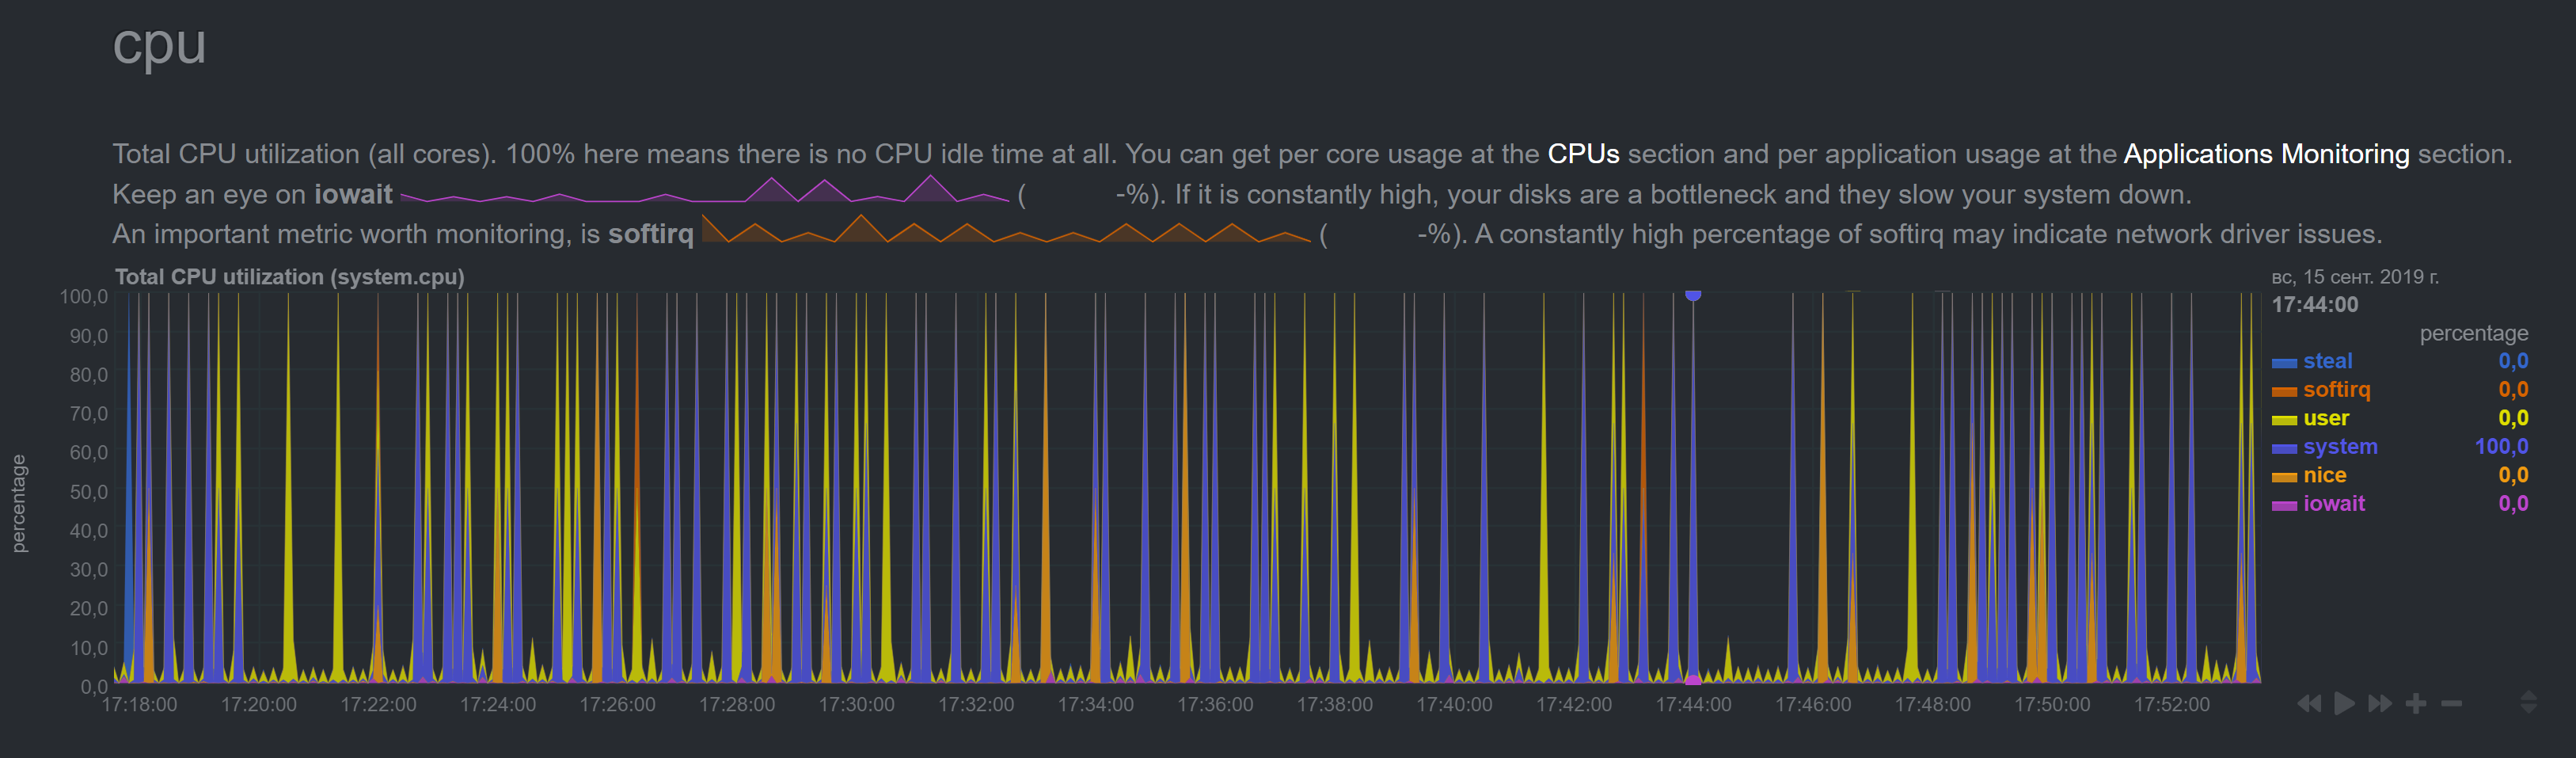
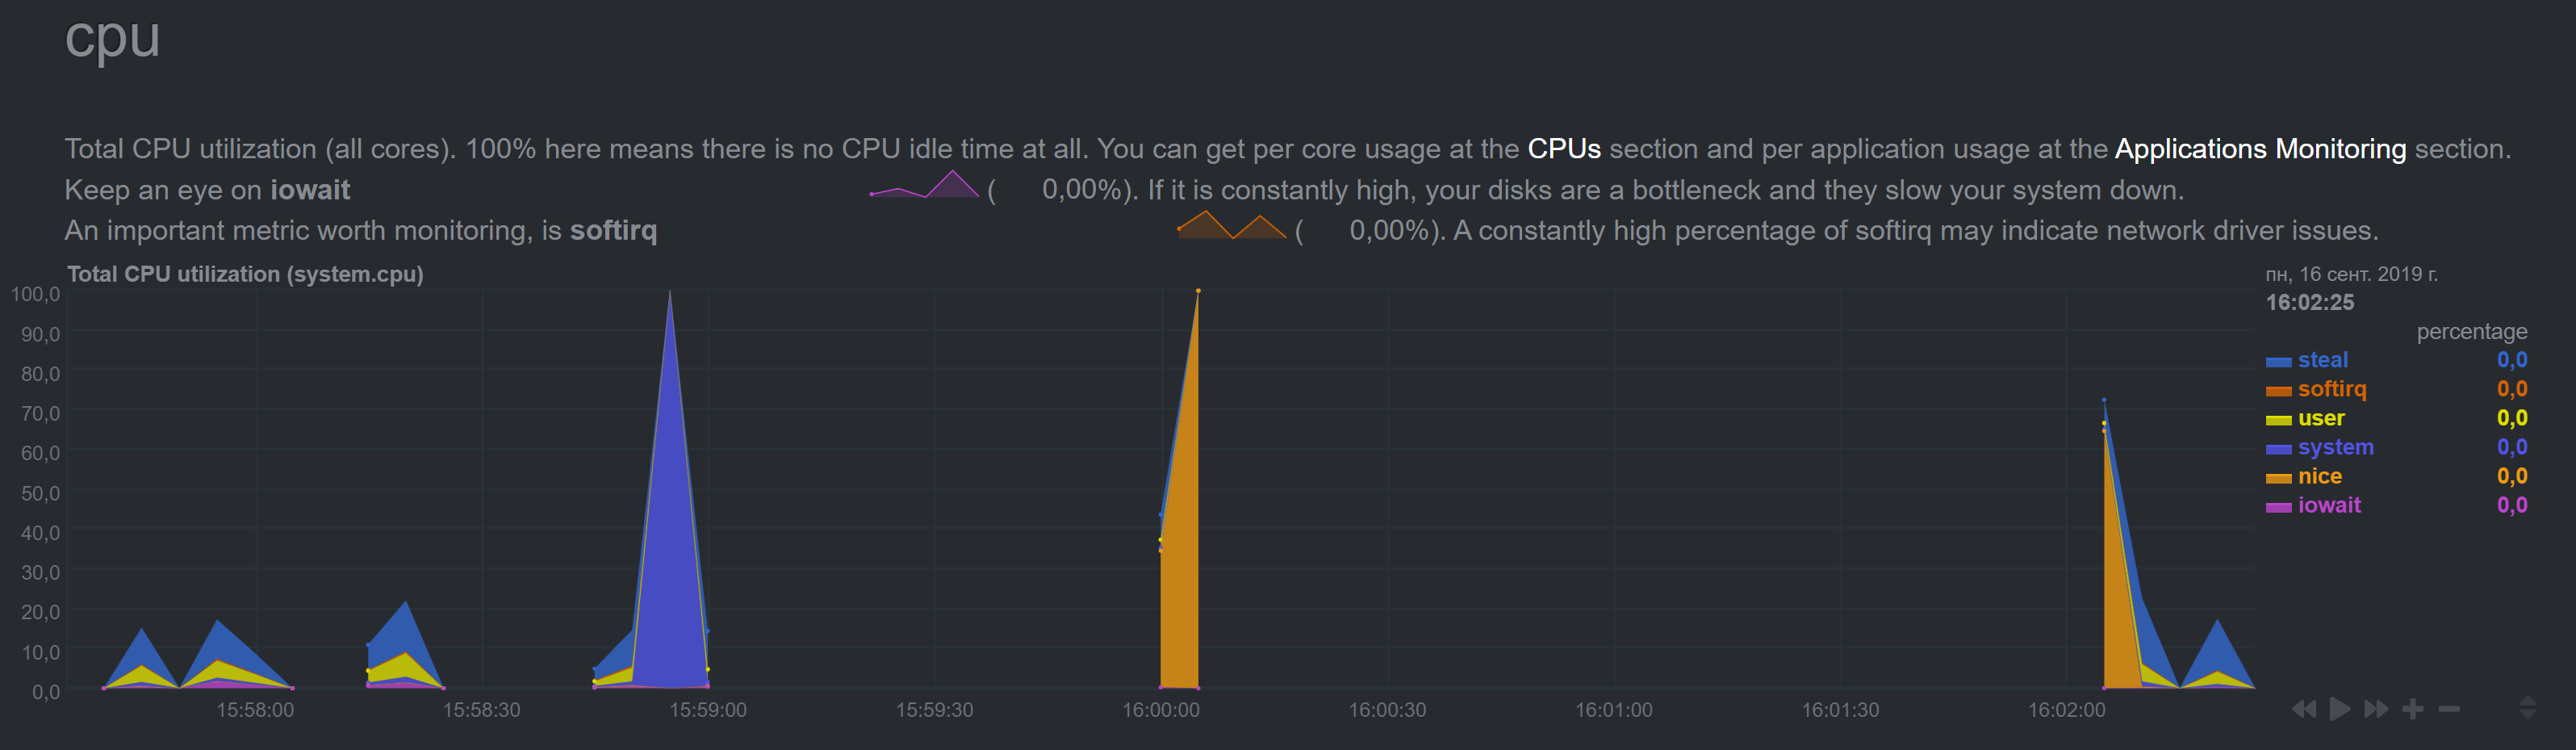
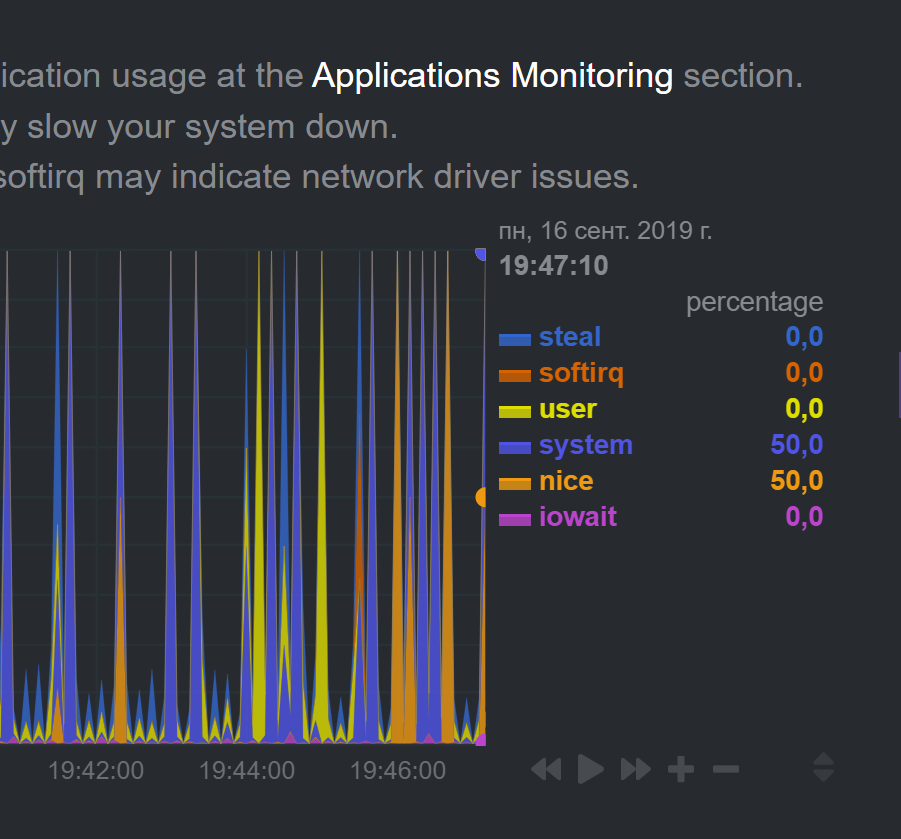
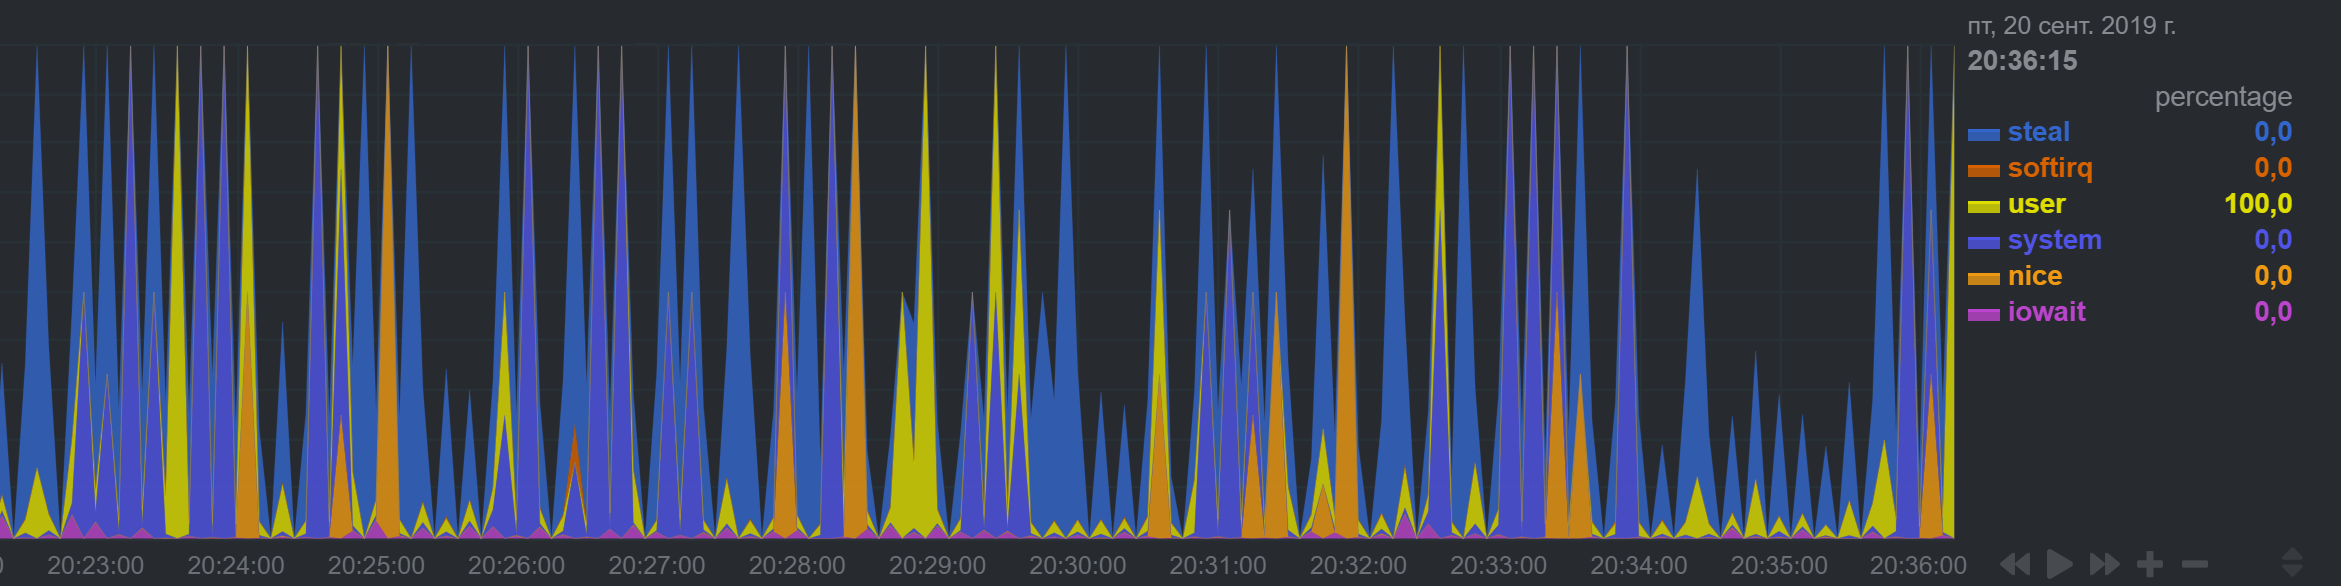
NetData shows regular spikes for CPU which I don't observe in top/htop.
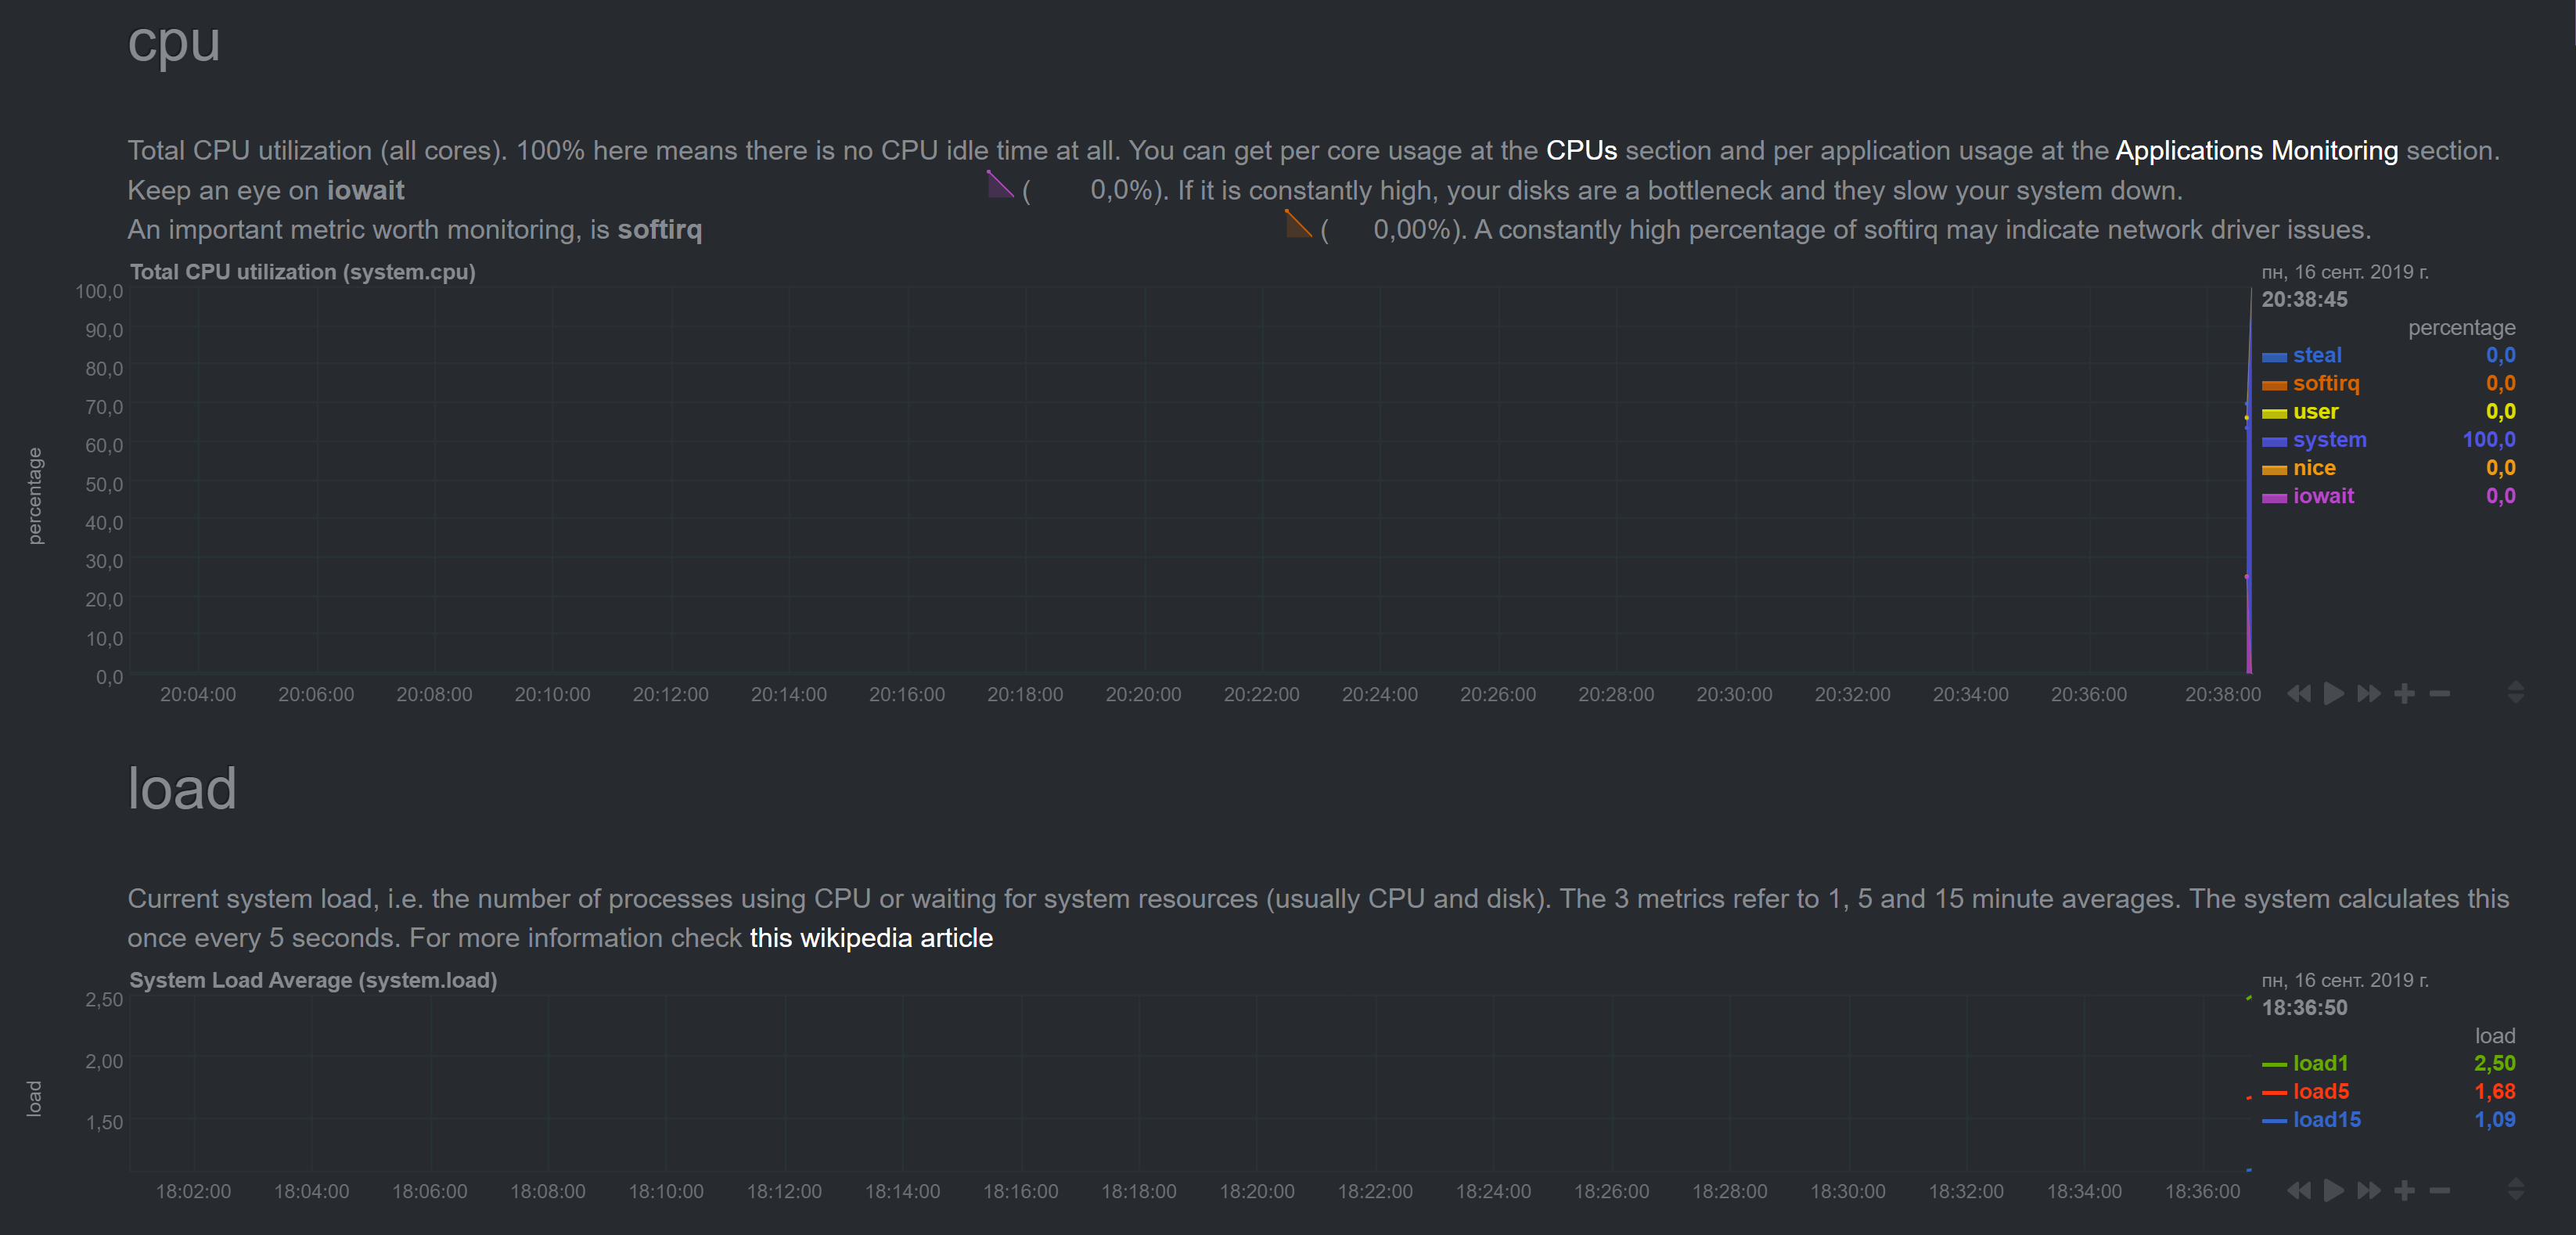
Plus I noticed that the time in graphs went off (it shows +1hr 47mins for some reason, though system 'date' command shows correct time).
I saved netdata snapshot and will happily email it if required.
 noobiek
All 61 comments
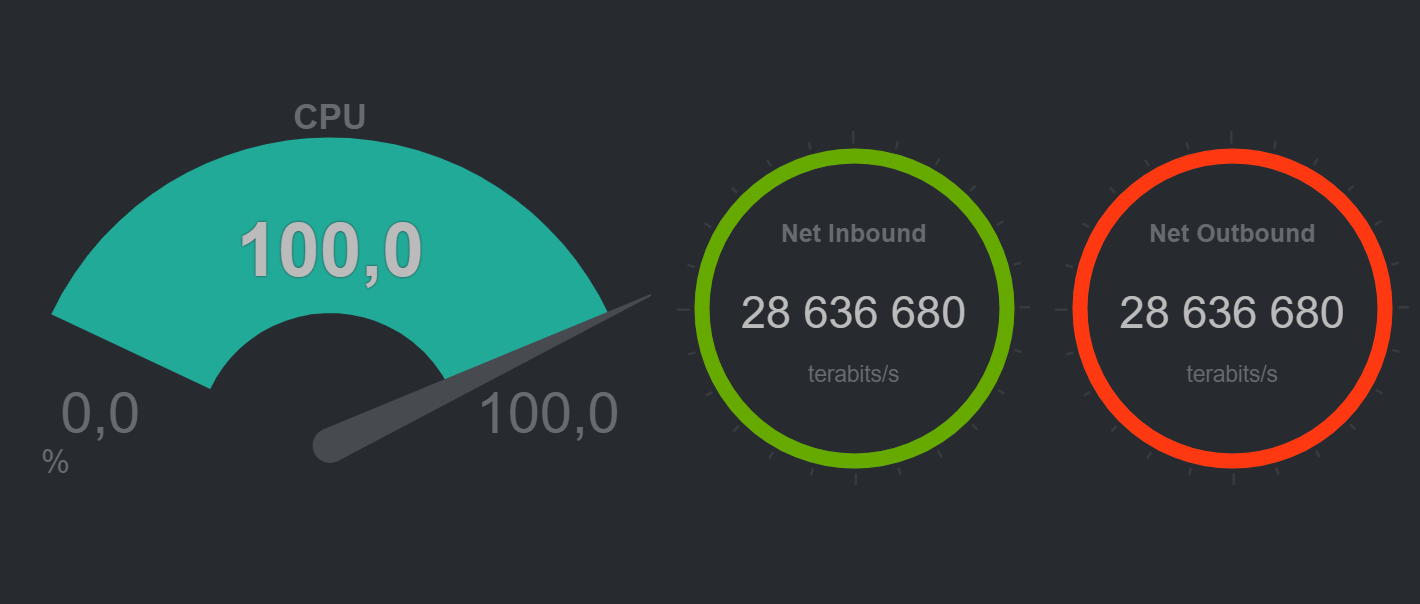
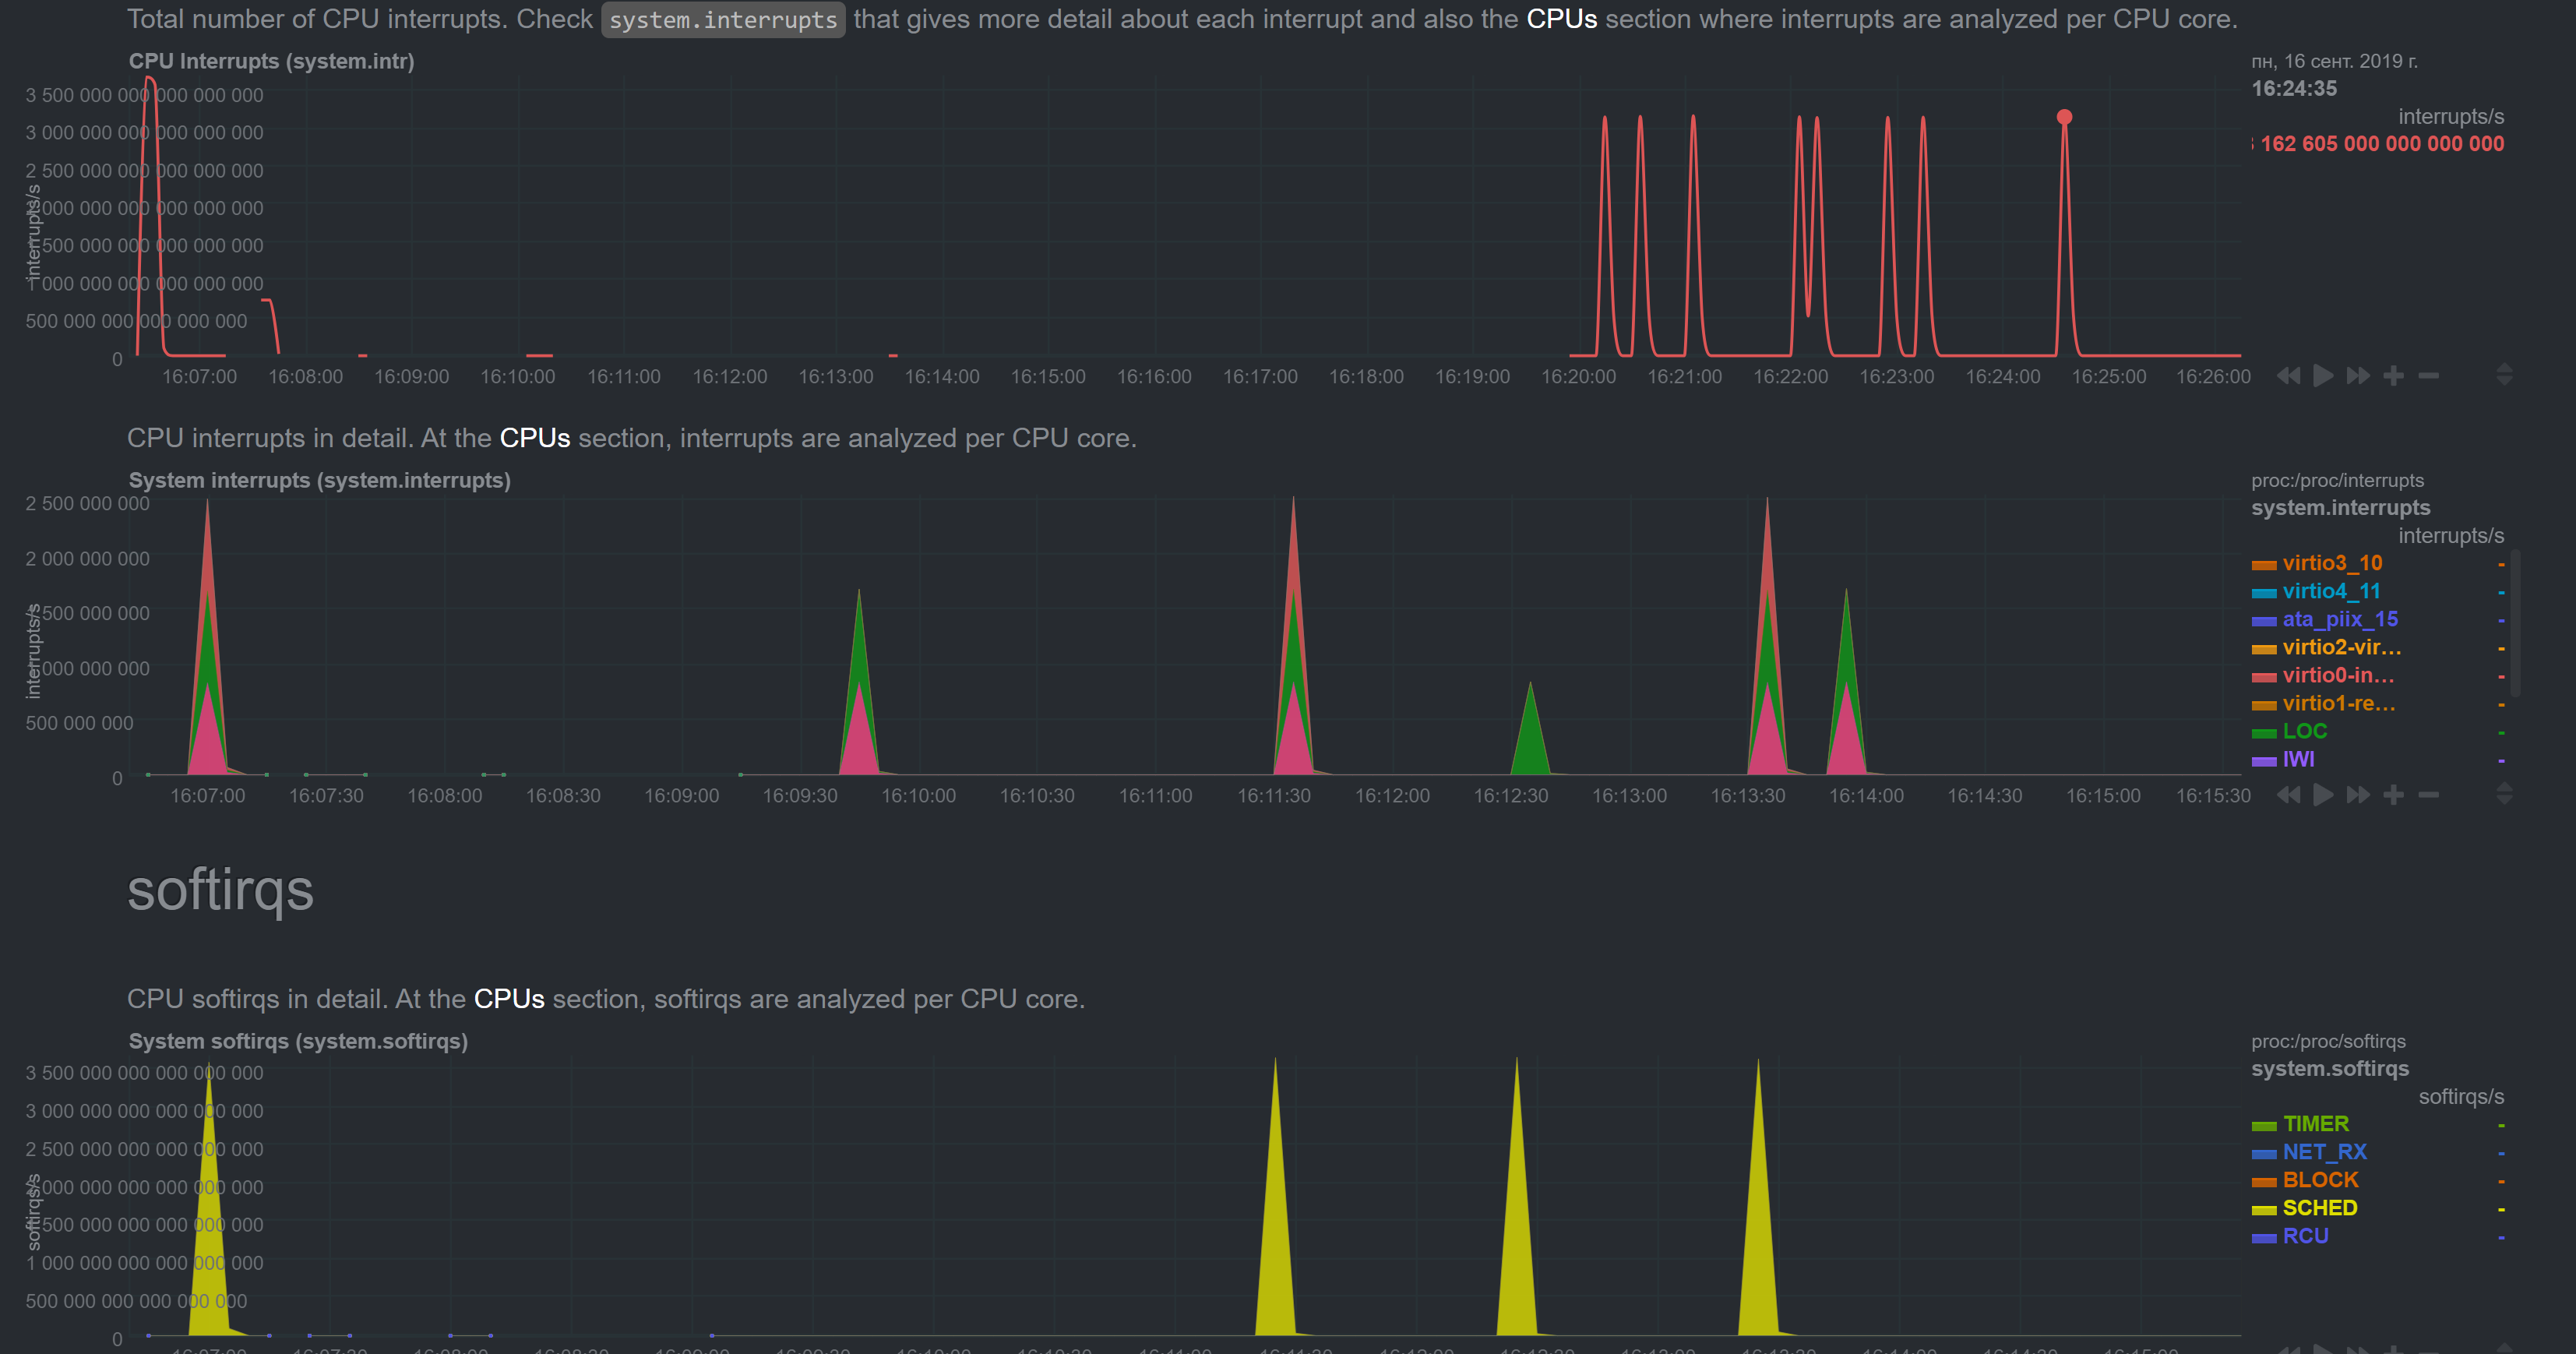
I guess 28 millions terabits per second is also incorrect. :)
noobiek
on 15 Sep 2019
Please send the snapshot to [email protected]
 vlvkobal
on 16 Sep 2019
vlvkobal
on 16 Sep 2019
Hi Vladimir. Done!
noobiek
on 16 Sep 2019
I think you are experiencing the issue described in #4962. Also, look also at #4533 and #4538. Did you have the spikes in charts only once, or are they repeating?
vlvkobal
on 16 Sep 2019
Do you see the same spikes on the slave's dashboard? Have you tried restarting Netdata on the master?
vlvkobal
on 16 Sep 2019
Did you have the spikes in charts only once, or are they repeating?
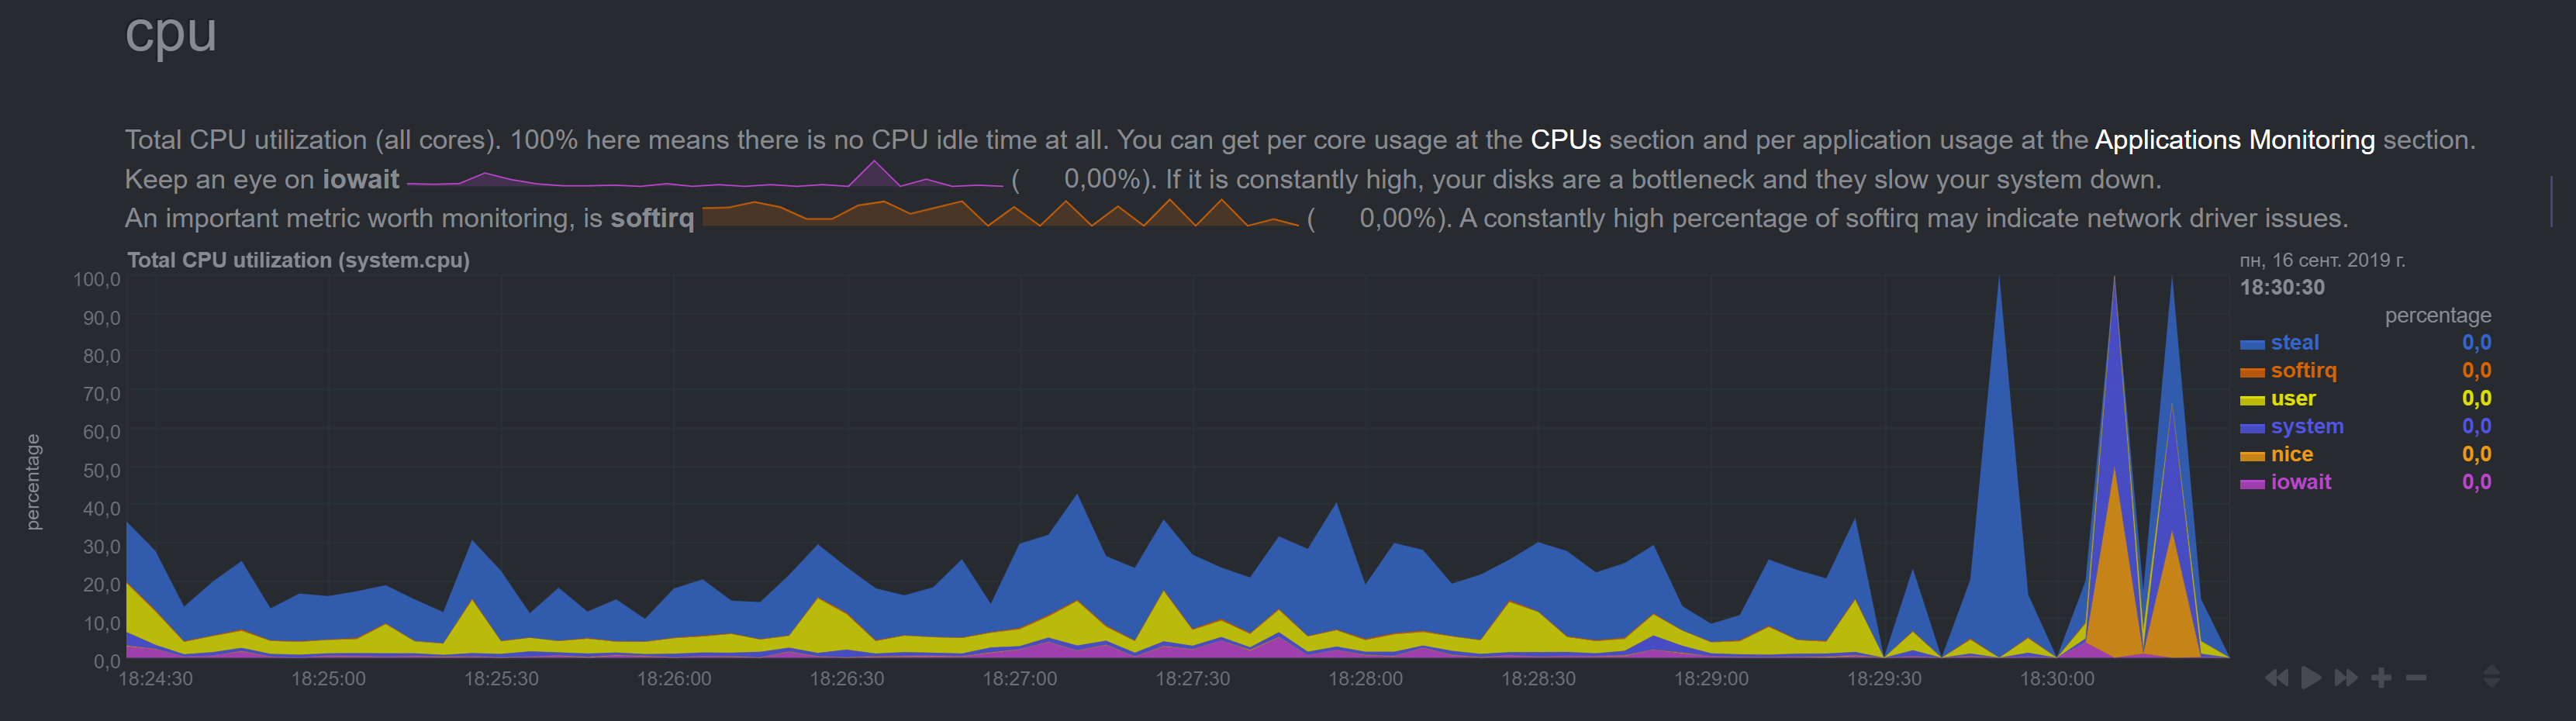
The CPU spikes are constant.
Do you see the same spikes on the slave's dashboard?
Will check and let you know.
Have you tried restarting Netdata on the master?
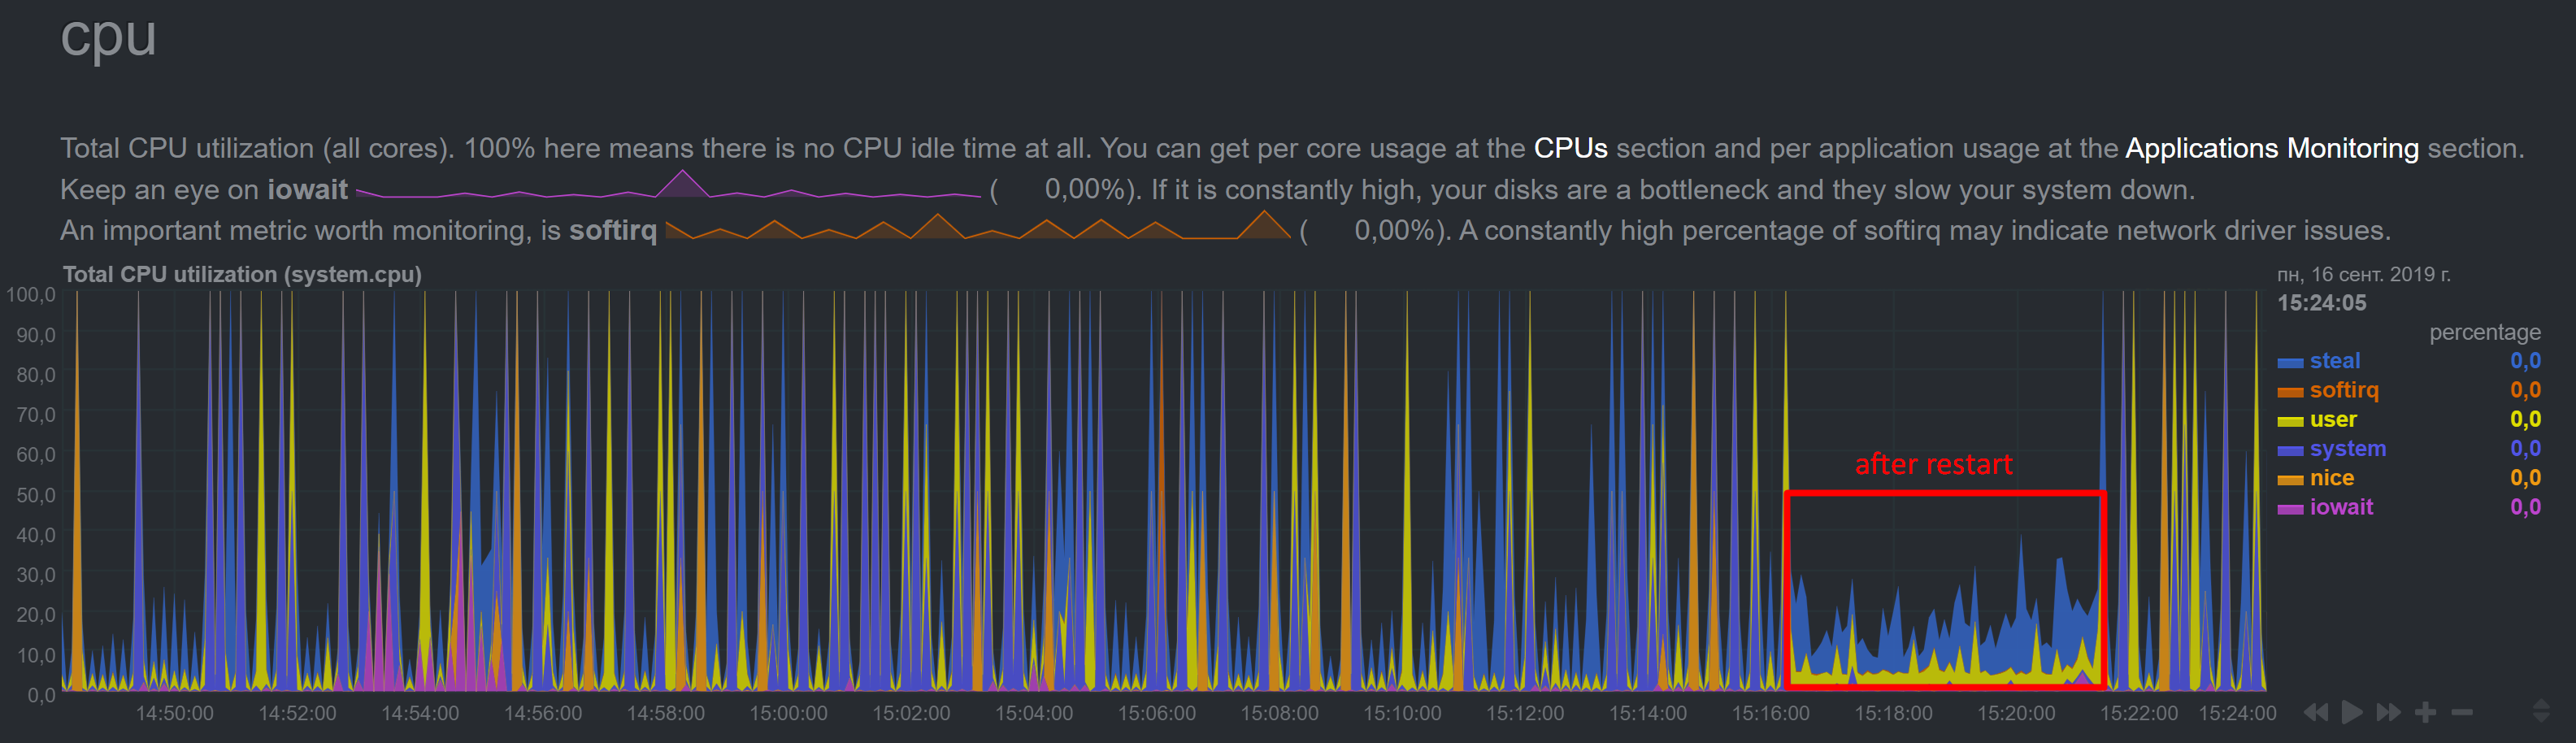
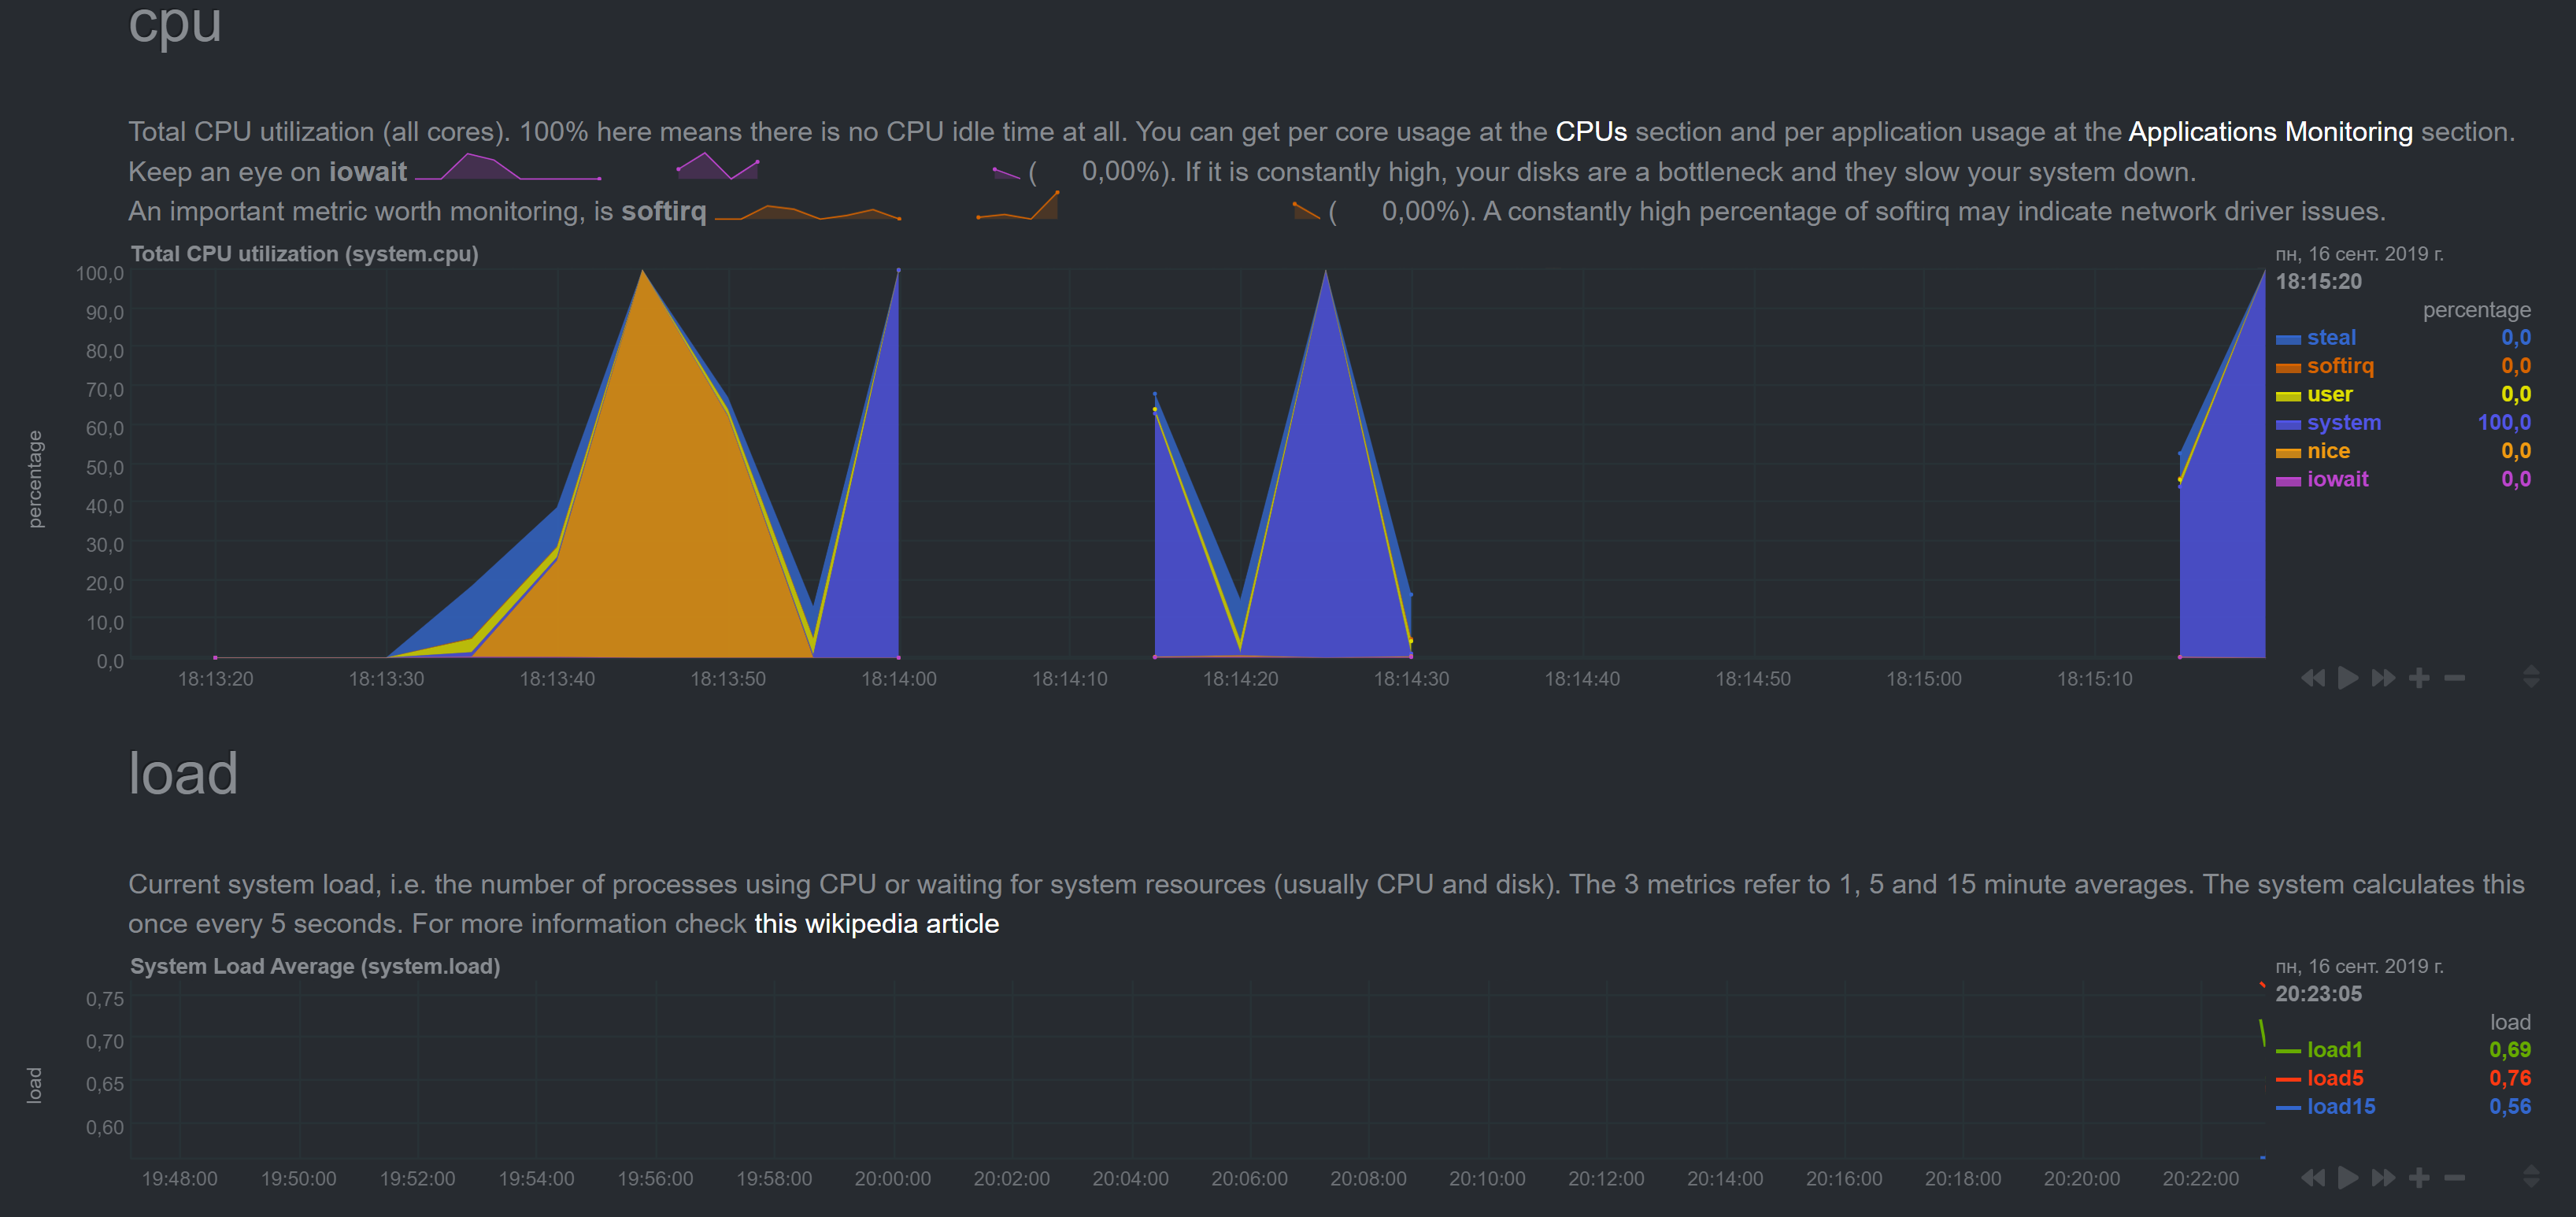
Yes I did yesterday and it did not help. Just now I restarted it again, it took some time, for a few minutes CPU numbers came to norm, but now there are spikes again:
Not sure about case similarities.
4533 shows albeit incorrect but at least sensible bandwidth numbers, and my numbers are millions of terabits. Same with other numbers, for example MariaDB queries per second:
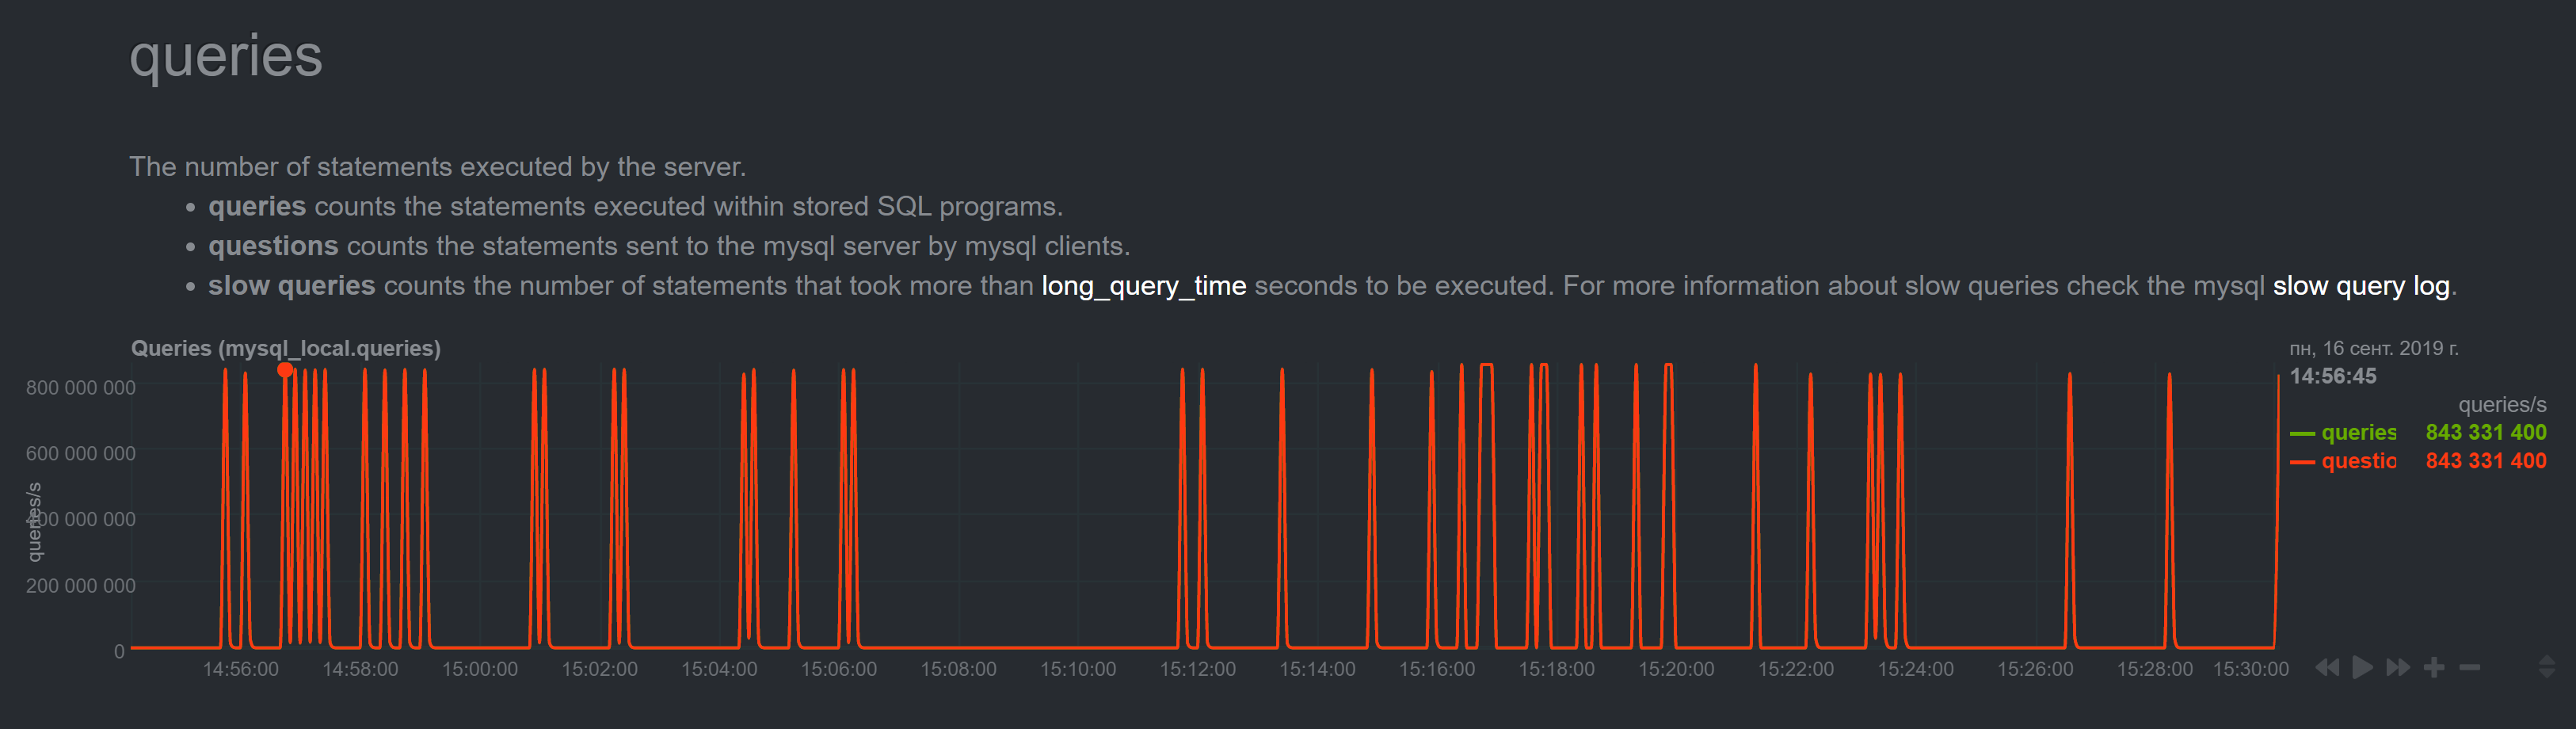
It is just impossible. To me this looks more like some maximum values.
In #4962 I don't see any similar symptoms either.
noobiek
on 16 Sep 2019
~Please run the sudo /usr/libexec/netdata/plugins.d/apps.plugin debug command in a separate terminal and provide it's output when it crashes.~ Sorry, the comment is for another issue.
vlvkobal
on 16 Sep 2019
OK, I enabled Web on slave (disabled streaming, set memory mode to map, enabled wed mode). Slave showed correct data (I checked for a few minutes just in case).
One thing to notice is that for some reason streaming to Master did not stop. I tried both, setting "enabled = no" and commenting "enabled" and "destination" parameters and then restarting netdata (did not try stop/start though). And in fact master started to show sensible data for the time.
After I reenabled streaming (on Slave I disabled Web, set memory mode to none, enabled streaming and uncommeted destination) on master I started to see this:
The picture changes every heartbeat for some time
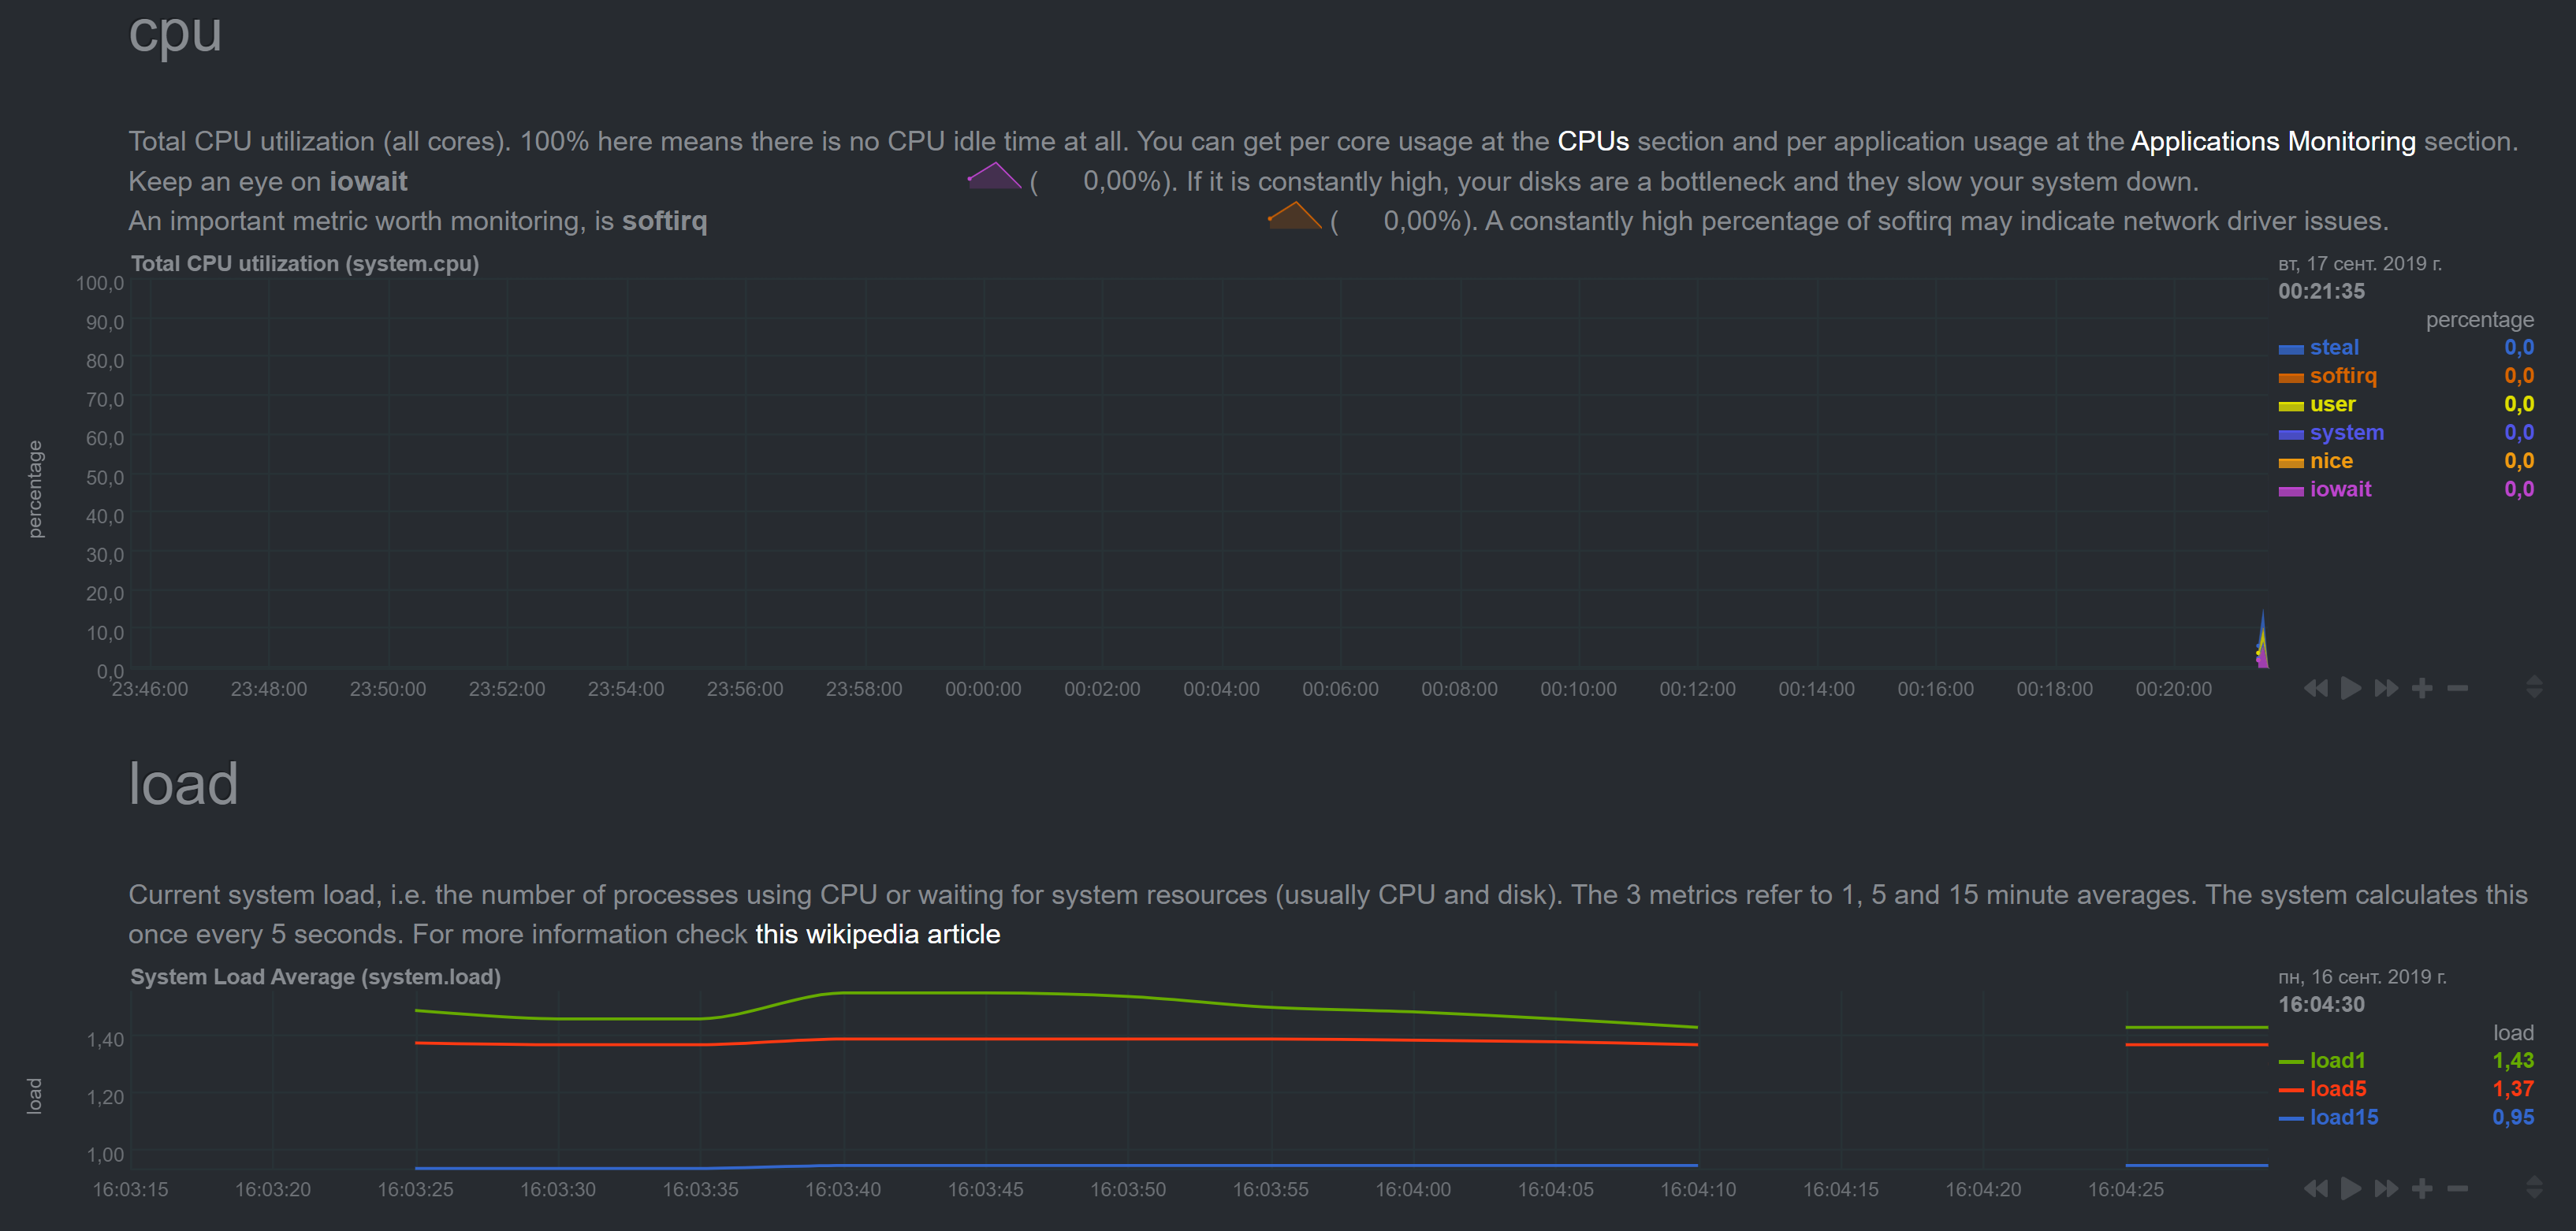
Notice different time on graphs
Finallly it normalized to good old spiking
with insane numbers
noobiek
on 16 Sep 2019
Hi @noobiek ,
Can you send us the messages related to stream from you master and slave?
Best regards!
 thiagoftsm
on 16 Sep 2019
thiagoftsm
on 16 Sep 2019
@thiagoftsm, please, clarify what you need exactly. What "messages"?
noobiek
on 16 Sep 2019
Thiago had in mind error.log messages.
vlvkobal
on 16 Sep 2019
Case you wanna share only messages related to stream you can run the following command:
grep STREAM /var/log/netdata/error.log | less
the output will be more or less this:
2019-09-15 22:43:30: netdata INFO  : STREAM_RECEIVER[poseidon,[192.168.0.28]:43404] : thread created with task id 32054
2019-09-15 22:43:30: netdata INFO  : STREAM_RECEIVER[poseidon,[192.168.0.28]:43404] : set name of thread 32054 to STREAM_RECEIVER
2019-09-15 22:43:30: netdata INFO  : STREAM_RECEIVER[poseidon,[192.168.0.28]:43404] : STREAM poseidon [192.168.0.28]:43404: receive thread created (task id 32054)
2019-09-15 22:43:30: netdata ERROR : STREAM_RECEIVER[poseidon,[192.168.0.28]:43404] : HEALTH [poseidon]: cannot open health file: /var/lib/netdata/xxxxx/health/health-log.db.old (errno 2, No such file or directory)
2019-09-15 22:43:30: netdata INFO  : STREAM_RECEIVER[poseidon,[192.168.0.28]:43404] : Host 'poseidon' (at registry as 'poseidon') with guid 'xxxxxxxx' initialized, os 'linux', timezone '03', tags '', program_name 'netdata', program_version 'v1
.17.0-99-g2e55e393', update every 1, memory mode save, history entries 3996, streaming disabled (to '' with api key ''), health enabled, cache_dir '/var/cache/netdata/xxxxxx', varlib_dir '/var/lib/netdata/xxxxx
', health_log '/var/lib/netdata/xxxxxxx/health/health-log.db', alarms default handler '/usr/libexec/netdata/plugins.d/alarm-notify.sh', alarms default recipient 'root'
2019-09-15 22:43:30: netdata INFO  : STREAM_RECEIVER[poseidon,[192.168.0.28]:43404] : STREAM poseidon [receive from [192.168.0.28]:43404]: client willing to stream metrics for host 'poseidon' with machine_guid 'xxxxxxxx: update every = 1, his
tory = 3996, memory mode = save, health auto, tags ''
logs are at /opt/netdata/netdata-logs/
here is the Slave error.log:
2019-09-16 15:16:11: netdata ERROR : STREAM_SENDER[wtdb1] : STREAM wtdb1 [send to _MASTER_IP_:19999]: failed to send metrics - closing connection - we have sent 991290046 bytes on this connection. (errno 104, Connection reset by peer)
2019-09-16 15:16:11: netdata ERROR : PLUGIN[idlejitter] : STREAM wtdb1 [send]: not ready - discarding collected metrics. (errno 22, Invalid argument)
2019-09-16 15:16:12: netdata INFO  : STREAM_SENDER[wtdb1] : STREAM wtdb1 [send to _MASTER_IP_:19999]: connecting...
2019-09-16 15:16:12: netdata INFO  : STREAM_SENDER[wtdb1] : STREAM wtdb1 [send to _MASTER_IP_:19999]: initializing communication...
2019-09-16 15:16:12: netdata INFO  : STREAM_SENDER[wtdb1] : STREAM wtdb1 [send to _MASTER_IP_:19999]: waiting response from remote netdata...
2019-09-16 15:16:13: netdata INFO  : STREAM_SENDER[wtdb1] : STREAM wtdb1 [send to _MASTER_IP_:19999]: established communication - ready to send metrics...
2019-09-16 15:16:13: netdata ERROR : STREAM_SENDER[wtdb1] : STREAM wtdb1 [send]: discarding 673711 bytes of metrics already in the buffer. (errno 22, Invalid argument)
2019-09-16 15:16:15: netdata INFO  : PLUGIN[tc] : STREAM wtdb1 [send]: sending metrics...
2019-09-16 15:33:47: netdata INFO  : MAIN : STREAM wtdb1 [send]: signaling sending thread to stop...
2019-09-16 15:33:47: netdata INFO  : MAIN : STREAM wtdb1 [send]: waiting for the sending thread to stop...
2019-09-16 15:33:47: netdata INFO  : STREAM_SENDER[wtdb1] : STREAM wtdb1 [send]: sending thread cleans up...
2019-09-16 15:33:47: netdata INFO  : STREAM_SENDER[wtdb1] : STREAM wtdb1 [send]: sending thread now exits.
2019-09-16 15:33:47: netdata INFO  : STREAM_SENDER[wtdb1] : thread with task id 23253 finished
2019-09-16 15:33:47: netdata INFO  : MAIN : STREAM wtdb1 [send]: sending thread has exited.
2019-09-16 15:33:48: netdata ERROR : PLUGIN[tc] : STREAM wtdb1 [send]: not ready - discarding collected metrics. (errno 9, Bad file descriptor)
2019-09-16 15:33:48: netdata INFO  : STREAM_SENDER[wtdb1] : thread created with task id 31393
2019-09-16 15:33:48: netdata INFO  : STREAM_SENDER[wtdb1] : set name of thread 31393 to STREAM_SENDER[w
2019-09-16 15:33:48: netdata INFO  : STREAM_SENDER[wtdb1] : STREAM wtdb1 [send]: thread created (task id 31393)
2019-09-16 15:33:53: netdata INFO  : STREAM_SENDER[wtdb1] : STREAM wtdb1 [send to _MASTER_IP_:19999]: connecting...
2019-09-16 15:33:53: netdata INFO  : STREAM_SENDER[wtdb1] : STREAM wtdb1 [send to _MASTER_IP_:19999]: initializing communication...
2019-09-16 15:33:53: netdata INFO  : STREAM_SENDER[wtdb1] : STREAM wtdb1 [send to _MASTER_IP_:19999]: waiting response from remote netdata...
2019-09-16 15:33:53: netdata INFO  : STREAM_SENDER[wtdb1] : STREAM wtdb1 [send to _MASTER_IP_:19999]: established communication - ready to send metrics...
2019-09-16 15:33:55: netdata INFO  : PLUGIN[tc] : STREAM wtdb1 [send]: sending metrics...
2019-09-16 15:47:15: netdata INFO  : MAIN : STREAM wtdb1 [send]: signaling sending thread to stop...
2019-09-16 15:47:15: netdata INFO  : MAIN : STREAM wtdb1 [send]: waiting for the sending thread to stop...
2019-09-16 15:47:15: netdata INFO  : STREAM_SENDER[wtdb1] : STREAM wtdb1 [send]: sending thread cleans up...
2019-09-16 15:47:15: netdata INFO  : STREAM_SENDER[wtdb1] : STREAM wtdb1 [send]: sending thread now exits.
2019-09-16 15:47:15: netdata INFO  : STREAM_SENDER[wtdb1] : thread with task id 31393 finished
2019-09-16 15:47:15: netdata INFO  : MAIN : STREAM wtdb1 [send]: sending thread has exited.
2019-09-16 15:52:58: netdata ERROR : PLUGIN[tc] : STREAM wtdb1 [send]: not ready - discarding collected metrics. (errno 9, Bad file descriptor)
2019-09-16 15:52:58: netdata INFO  : STREAM_SENDER[wtdb1] : thread created with task id 1456
2019-09-16 15:52:58: netdata INFO  : STREAM_SENDER[wtdb1] : set name of thread 1456 to STREAM_SENDER[w
2019-09-16 15:52:58: netdata INFO  : STREAM_SENDER[wtdb1] : STREAM wtdb1 [send]: thread created (task id 1456)
2019-09-16 15:53:03: netdata INFO  : STREAM_SENDER[wtdb1] : STREAM wtdb1 [send to _MASTER_IP_:19999]: connecting...
2019-09-16 15:53:03: netdata INFO  : STREAM_SENDER[wtdb1] : STREAM wtdb1 [send to _MASTER_IP_:19999]: initializing communication...
2019-09-16 15:53:03: netdata INFO  : STREAM_SENDER[wtdb1] : STREAM wtdb1 [send to _MASTER_IP_:19999]: waiting response from remote netdata...
2019-09-16 15:53:03: netdata INFO  : STREAM_SENDER[wtdb1] : STREAM wtdb1 [send to _MASTER_IP_:19999]: established communication - ready to send metrics...
2019-09-16 15:53:05: netdata INFO  : PLUGIN[tc] : STREAM wtdb1 [send]: sending metrics...
2019-09-16 16:02:00: netdata INFO  : MAIN : STREAM wtdb1 [send]: signaling sending thread to stop...
2019-09-16 16:02:00: netdata INFO  : MAIN : STREAM wtdb1 [send]: waiting for the sending thread to stop...
2019-09-16 16:02:00: netdata INFO  : STREAM_SENDER[wtdb1] : STREAM wtdb1 [send]: sending thread cleans up...
2019-09-16 16:02:00: netdata INFO  : STREAM_SENDER[wtdb1] : STREAM wtdb1 [send]: sending thread now exits.
2019-09-16 16:02:00: netdata INFO  : STREAM_SENDER[wtdb1] : thread with task id 1456 finished
2019-09-16 16:02:00: netdata INFO  : MAIN : STREAM wtdb1 [send]: sending thread has exited.
2019-09-16 16:02:03: netdata ERROR : PLUGIN[tc] : STREAM wtdb1 [send]: not ready - discarding collected metrics. (errno 9, Bad file descriptor)
2019-09-16 16:02:03: netdata INFO  : STREAM_SENDER[wtdb1] : thread created with task id 2274
2019-09-16 16:02:03: netdata INFO  : STREAM_SENDER[wtdb1] : set name of thread 2274 to STREAM_SENDER[w
2019-09-16 16:02:03: netdata INFO  : STREAM_SENDER[wtdb1] : STREAM wtdb1 [send]: thread created (task id 2274)
2019-09-16 16:02:08: netdata INFO  : STREAM_SENDER[wtdb1] : STREAM wtdb1 [send to _MASTER_IP_:19999]: connecting...
2019-09-16 16:02:08: netdata INFO  : STREAM_SENDER[wtdb1] : STREAM wtdb1 [send to _MASTER_IP_:19999]: initializing communication...
2019-09-16 16:02:08: netdata INFO  : STREAM_SENDER[wtdb1] : STREAM wtdb1 [send to _MASTER_IP_:19999]: waiting response from remote netdata...
2019-09-16 16:02:08: netdata INFO  : STREAM_SENDER[wtdb1] : STREAM wtdb1 [send to _MASTER_IP_:19999]: established communication - ready to send metrics...
2019-09-16 16:02:10: netdata INFO  : PLUGIN[tc] : STREAM wtdb1 [send]: sending metrics...
And here is Master error.log last screen (grepped for STREAM and wtdb1 host). As you can see on Master there are no new errors after 14:21:20 (it's Moscow time, by the way).
2019-09-16 14:21:20: netdata INFO  : STREAM_RECEIVER[wtdb1,[_SLAVE_IP_]:45748] : host 'wtdb1', chart apps.processes: took too long to be updated (counter #4119, update #34, 20511.548 secs). Resetting it.
2019-09-16 14:21:20: netdata INFO  : STREAM_RECEIVER[wtdb1,[_SLAVE_IP_]:45748] : host 'wtdb1', chart apps.uptime: took too long to be updated (counter #4119, update #34, 20512.309 secs). Resetting it.
2019-09-16 14:21:20: netdata INFO  : STREAM_RECEIVER[wtdb1,[_SLAVE_IP_]:45748] : host 'wtdb1', chart apps.uptime_min: took too long to be updated (counter #4119, update #34, 20513.196 secs). Resetting it.
2019-09-16 14:21:20: netdata INFO  : STREAM_RECEIVER[wtdb1,[_SLAVE_IP_]:45748] : host 'wtdb1', chart apps.uptime_avg: took too long to be updated (counter #4119, update #34, 20513.568 secs). Resetting it.
2019-09-16 14:21:20: netdata INFO  : STREAM_RECEIVER[wtdb1,[_SLAVE_IP_]:45748] : host 'wtdb1', chart apps.uptime_max: took too long to be updated (counter #4119, update #34, 20514.563 secs). Resetting it.
2019-09-16 14:21:20: netdata INFO  : STREAM_RECEIVER[wtdb1,[_SLAVE_IP_]:45748] : host 'wtdb1', chart apps.mem: took too long to be updated (counter #4122, update #34, 20525.344 secs). Resetting it.
2019-09-16 14:21:20: netdata INFO  : STREAM_RECEIVER[wtdb1,[_SLAVE_IP_]:45748] : host 'wtdb1', chart apps.vmem: took too long to be updated (counter #4122, update #34, 20526.162 secs). Resetting it.
2019-09-16 14:21:20: netdata INFO  : STREAM_RECEIVER[wtdb1,[_SLAVE_IP_]:45748] : host 'wtdb1', chart apps.swap: took too long to be updated (counter #4122, update #34, 20526.992 secs). Resetting it.
2019-09-16 14:21:20: netdata INFO  : STREAM_RECEIVER[wtdb1,[_SLAVE_IP_]:45748] : host 'wtdb1', chart apps.minor_faults: took too long to be updated (counter #4122, update #34, 20527.714 secs). Resetting it.
2019-09-16 14:21:20: netdata INFO  : STREAM_RECEIVER[wtdb1,[_SLAVE_IP_]:45748] : host 'wtdb1', chart apps.major_faults: took too long to be updated (counter #4137, update #34, 20602.990 secs). Resetting it.
2019-09-16 14:21:20: netdata INFO  : STREAM_RECEIVER[wtdb1,[_SLAVE_IP_]:45748] : host 'wtdb1', chart apps.lreads: took too long to be updated (counter #4137, update #34, 20603.514 secs). Resetting it.
2019-09-16 14:21:20: netdata INFO  : STREAM_RECEIVER[wtdb1,[_SLAVE_IP_]:45748] : host 'wtdb1', chart apps.lwrites: took too long to be updated (counter #4137, update #34, 20604.379 secs). Resetting it.
2019-09-16 14:21:20: netdata INFO  : STREAM_RECEIVER[wtdb1,[_SLAVE_IP_]:45748] : host 'wtdb1', chart apps.preads: took too long to be updated (counter #4138, update #34, 20605.610 secs). Resetting it.
2019-09-16 14:21:20: netdata INFO  : STREAM_RECEIVER[wtdb1,[_SLAVE_IP_]:45748] : host 'wtdb1', chart apps.pwrites: took too long to be updated (counter #4138, update #34, 20606.041 secs). Resetting it.
2019-09-16 14:21:20: netdata INFO  : STREAM_RECEIVER[wtdb1,[_SLAVE_IP_]:45748] : host 'wtdb1', chart apps.files: took too long to be updated (counter #4138, update #34, 20606.720 secs). Resetting it.
2019-09-16 14:21:20: netdata INFO  : STREAM_RECEIVER[wtdb1,[_SLAVE_IP_]:45748] : host 'wtdb1', chart apps.sockets: took too long to be updated (counter #4138, update #34, 20607.288 secs). Resetting it.
Thank you by the logs, we are working on them now.
Only more one doubt, in the update that you executed, did you enable the SSL feature?
Best regards.
thiagoftsm
on 16 Sep 2019
I did not specifically enable/disable anything during/before/after the update. Just downloaded fresh kickstart64 and ran it.
noobiek
on 16 Sep 2019
Can you clean up the database on the slave? Stop Netdata, remove /var/cache/netdata, and start Netdata again.
vlvkobal
on 16 Sep 2019
On Ubuntu it installs to /opt/netdata/, so cache is here /opt/netdata/var/cache/netdata/ (just FYI)
Cleaned cache on slave, results are the same:
Should I clean master cache also? Does it store stream cache anywhere?
noobiek
on 16 Sep 2019
If you can, clean the master cache too. Do you have the same time/zone on both the master and the slave? It's strange that every second your master is trying to apply the same update from the slave.
vlvkobal
on 16 Sep 2019
I stopped master's netdata, cleaned cache and started netdata.
Same as before, for a few minutes CPU graph was OK, then it started spiking
Some other graphs (as before) had insane numbers right after restart.
In other words, cache cleaning didn't help. What else can I clean? :)
We can always try clean install Slave netdata and save everyone's time. But I want to help you fix it if its broken (if you want to get to the bottom of this), so let me know if there is anything else I should try or provide you with.
noobiek
on 16 Sep 2019
So, what about the time difference? Are time shifts still present in charts?
Do you have the same time/zone on both the master and the slave?
vlvkobal
on 16 Sep 2019
Another doubt to help us to set an environment that will replicate the problem, the machines that are running 1.13.0 yet, did you use kickstart64.sh to install them?
thiagoftsm
on 16 Sep 2019
Do you have the same time/zone on both the master and the slave?
Timezones are the same. Timeshift is still present - it is now 39 minutes
Another doubt to help us to set an environment that will replicate the problem, the machines that are running 1.13.0 yet, did you use kickstart64.sh to install them?
8 servers are still running 1.13, correct.
2 servers are running 1.17 - 1 Master and 1 Slave. Between these two, Master graphs are correct, and Slave graphs are incorrect.
I can go on and kickstart update one more server and see what happens.
noobiek
on 16 Sep 2019
Master graphs are correct, and Slave graphs are incorrect
Did you mean the opposite?
vlvkobal
on 16 Sep 2019
Did you mean the opposite?
I do not mean _where_ I look at them. I mean server metrics. Slave metrics are incorrect, and Master metrics are correct. I get all the graphs at Master's web-interface, of course.
Sorry if I confued you.
noobiek
on 16 Sep 2019
Got it. Thanks.
vlvkobal
on 16 Sep 2019
@noobiek I am finishing to mount the environment here to replicate the error that you are reporting, but I have another doubt, please, what is the accept a streaming request every second you are using?
thiagoftsm
on 16 Sep 2019
@thiagoftsm I left it unset. So it should be default. For [web] I've only set "allow streaming from".
As a matter of fact I could provide you with ssh to Master and some other Slave (non-critical one) if you need an environment to test.
noobiek
on 16 Sep 2019
Thank you @noobiek , I will do few tests in my own lab, case I am not able to replicate the issue we return to talk about the SSH.
thiagoftsm
on 16 Sep 2019
Sure.
noobiek
on 16 Sep 2019
Hi @noobiek, I could repeat the problem that you reported, I am now investigating it, as soon I have the answer I will write here.
thiagoftsm
on 16 Sep 2019
Great!!! :)
noobiek
on 16 Sep 2019
Hi @noobiek ,
I would like to confirm something with you, yesterday I executed hours of tests and I saw that at least in my side I had the same problems, because I had problems in connection between my master and slaves, so the data could not follow between the two points. Only to confirm that I detect the exact same error, do you have problems in your link between master and slave sometimes?
thiagoftsm
on 17 Sep 2019
Hi @thiagoftsm,
Both servers are in the same datacenter, both are VPS.
How do I diagnose these problems? Ping doesn't show any packets loss.

I do however have this alarm for the v17 Slave:
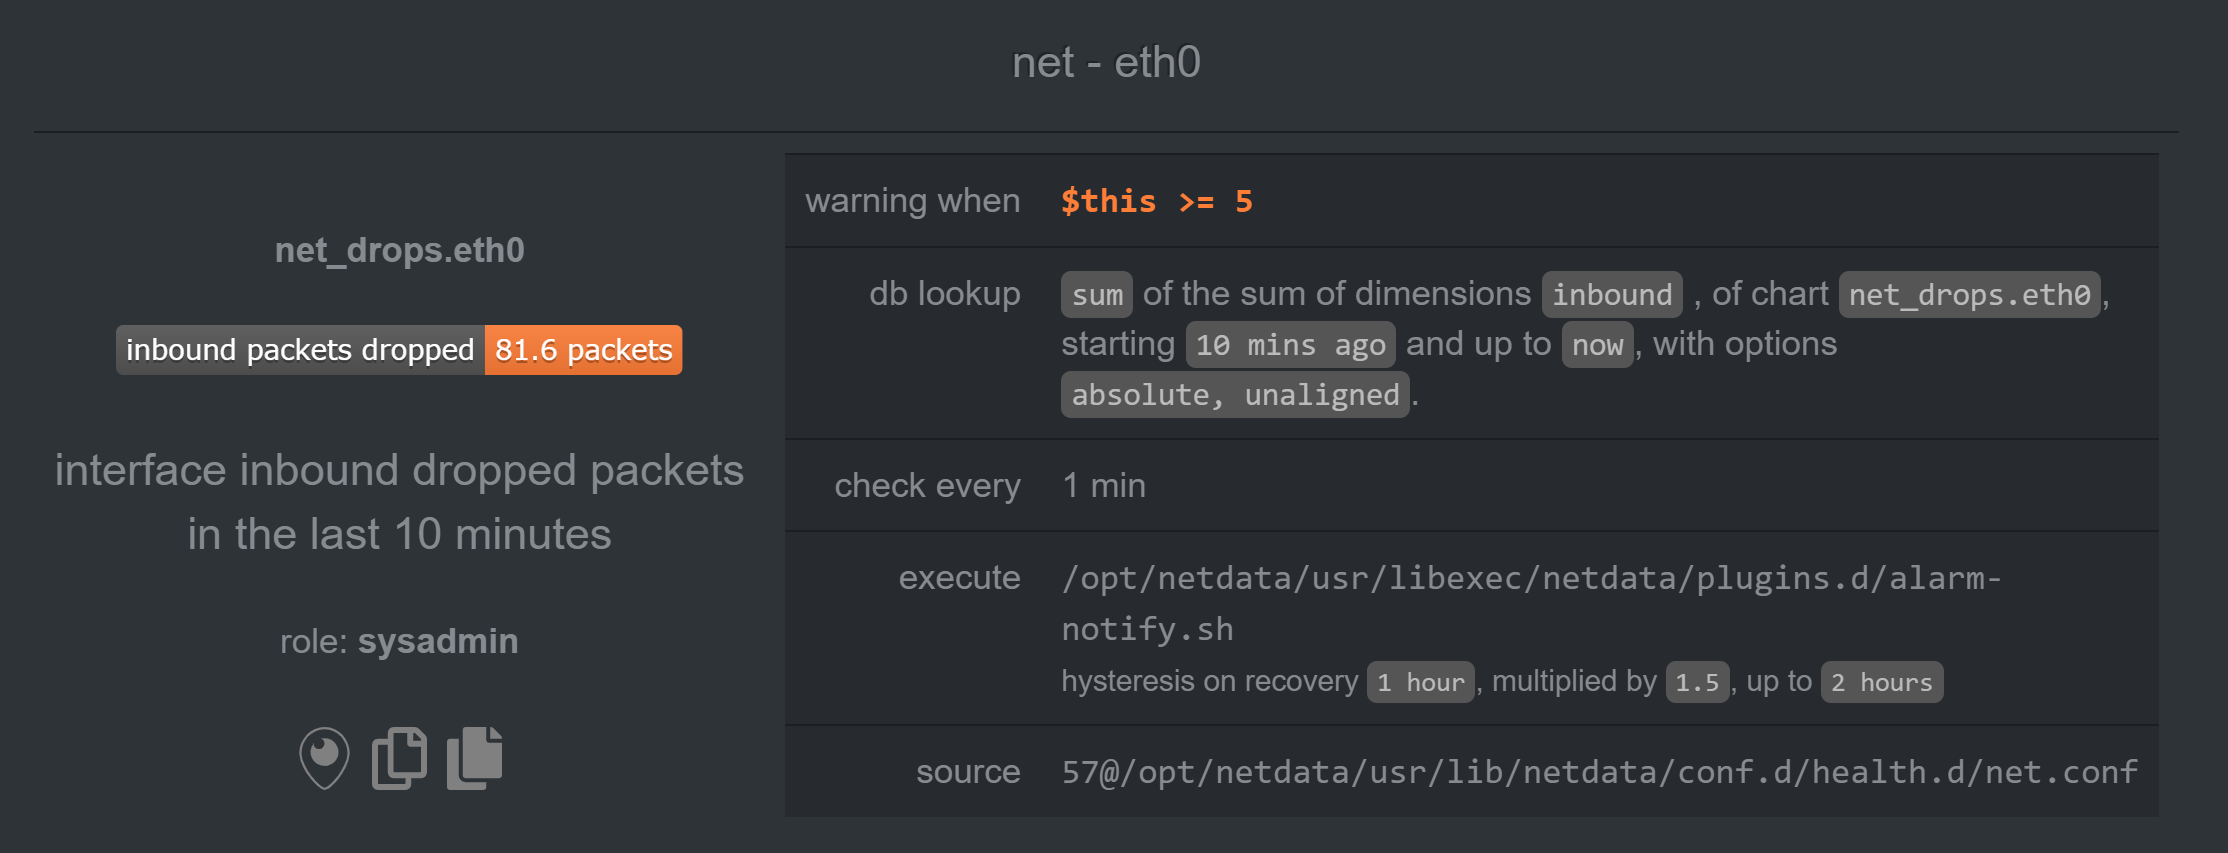
But it is nothing new. I've seen this alarm on v13 and didn't have any problems.
And there are no network alarms for v17 Master.
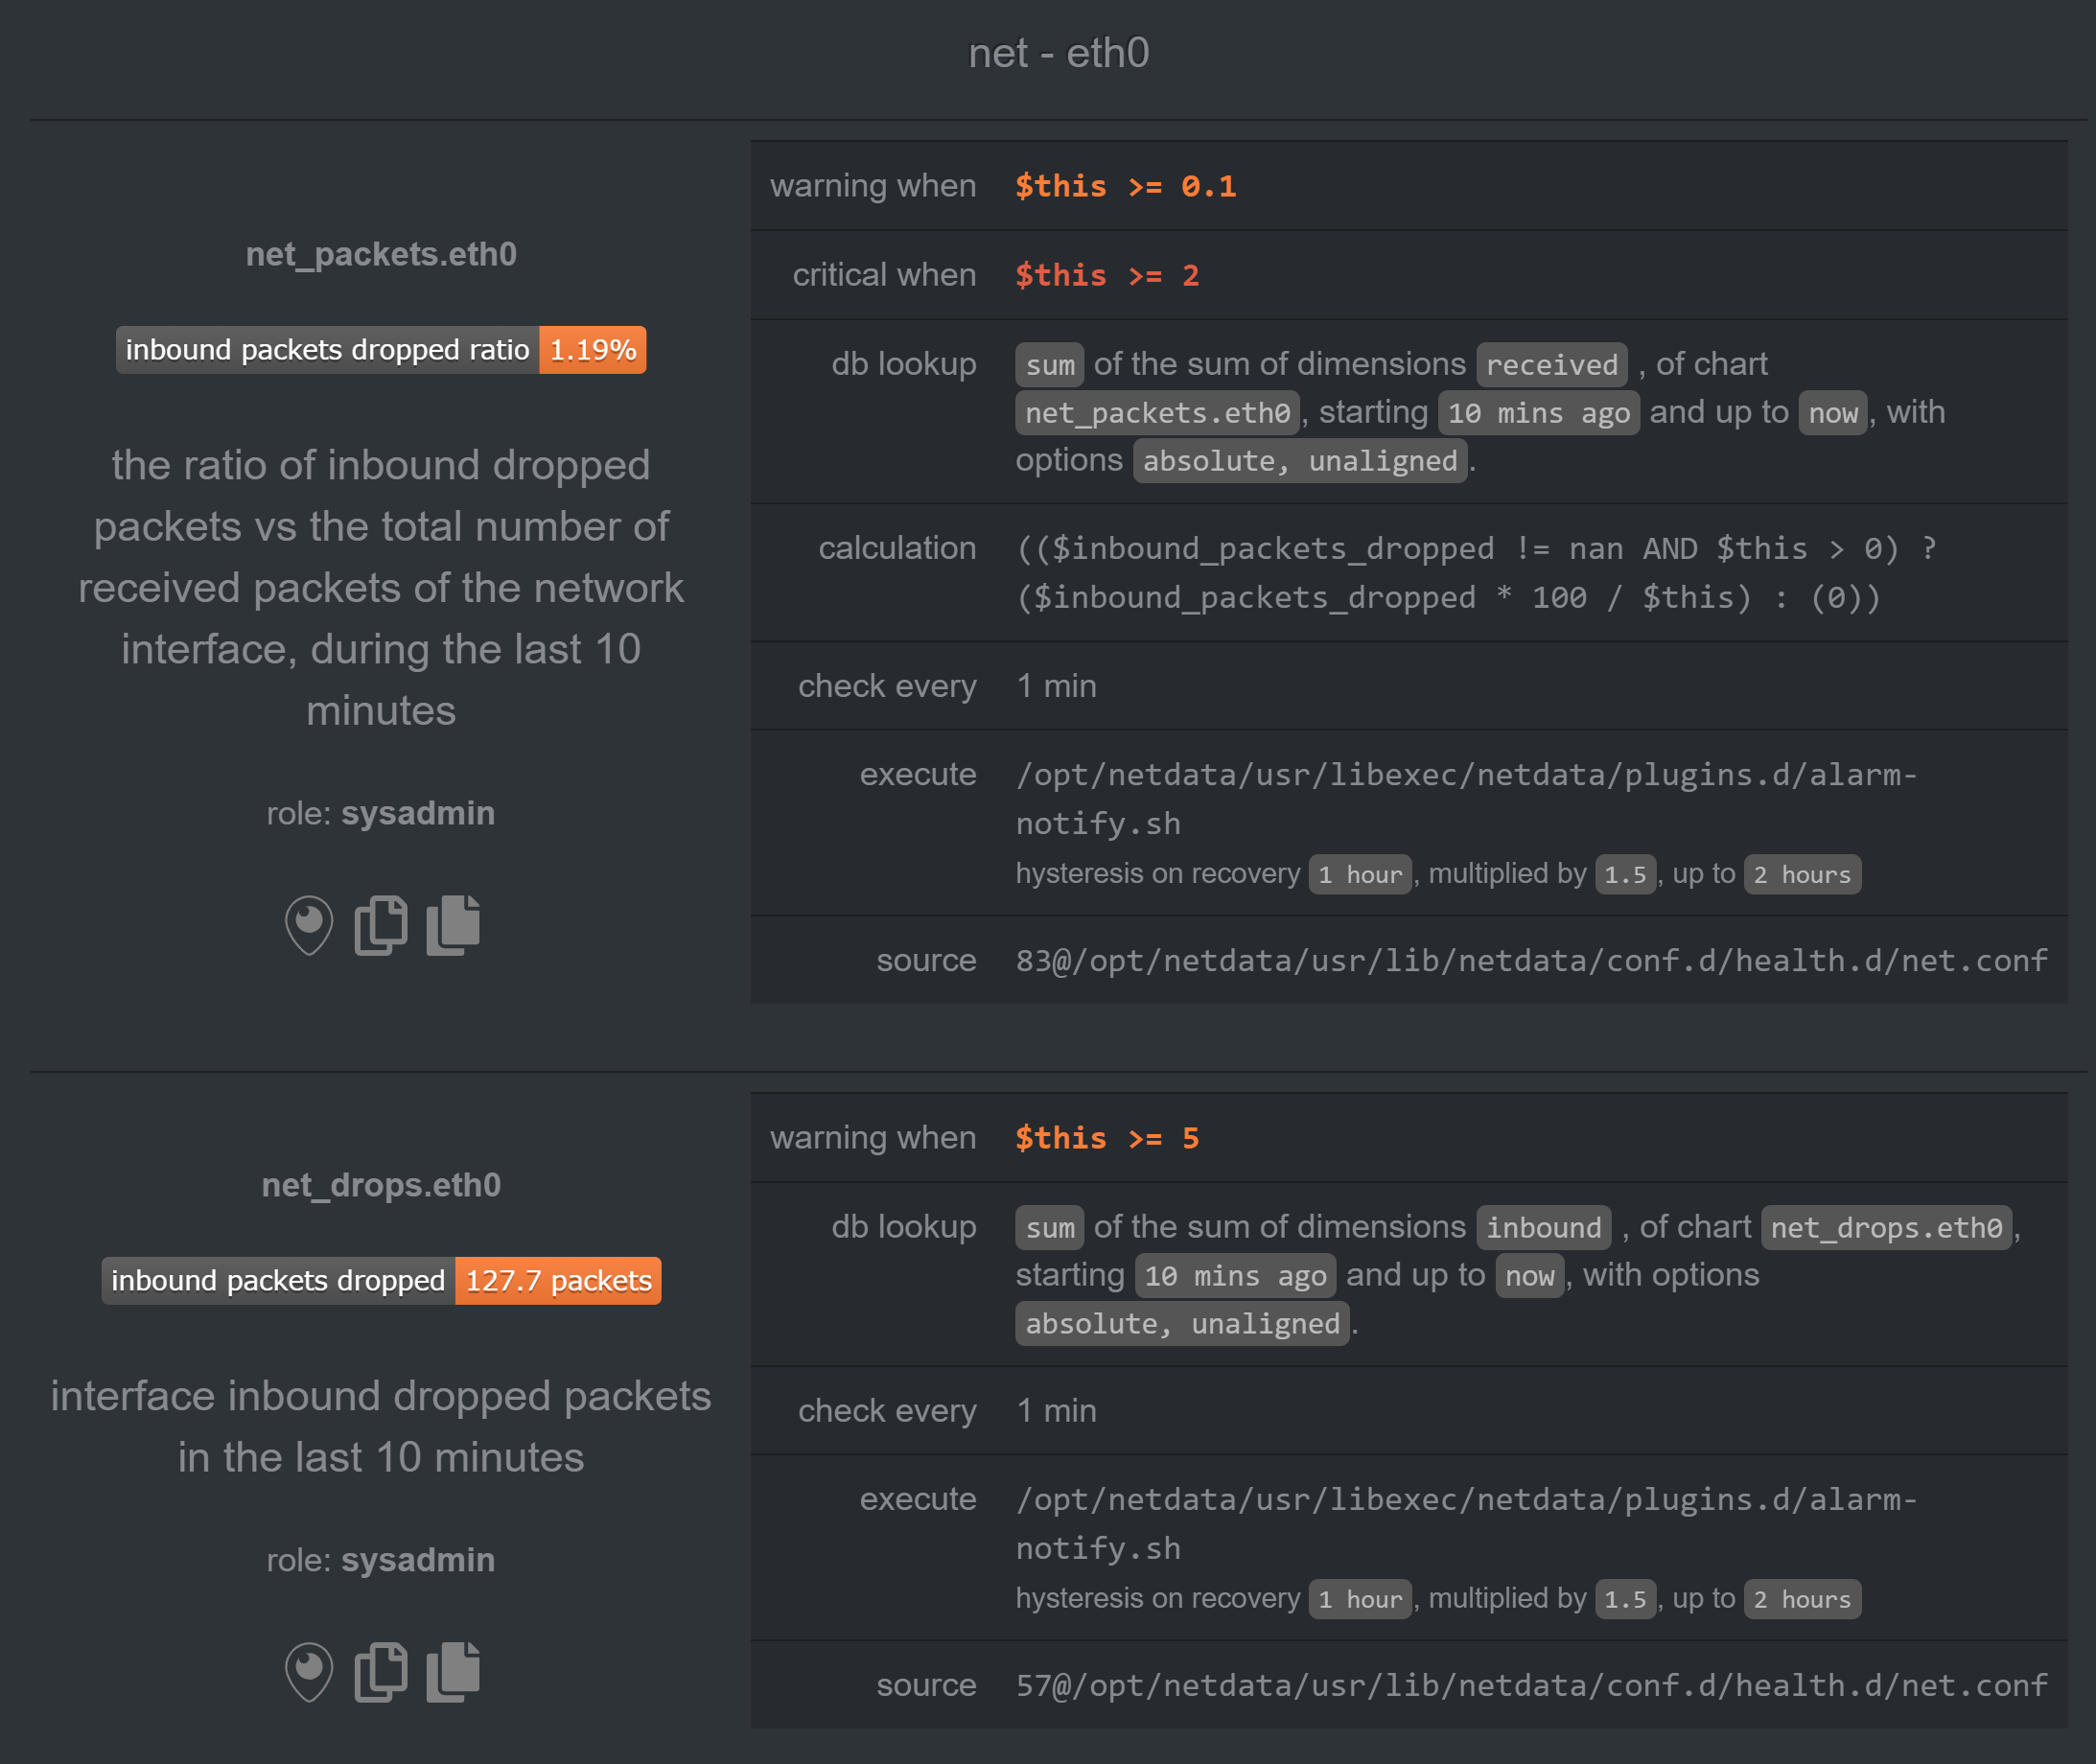
Plus, I currently have another v13 slave with similar alarm and it has all the metrics correct:
noobiek
on 18 Sep 2019
Thank you by the additional information.
Now it is too late in my timezone, so I will work on this again tomorrow, but I at least know who is creating the problem, so I hope to fix this ASAP.
Best regards!
thiagoftsm
on 18 Sep 2019
@thiagoftsm, hi!
Any news?
Thanks!
noobiek
on 20 Sep 2019
Ni @noobiek ,
Sorry by the delay, but I am working in other fronts here on Netdata this week, so I could not bring the final solution yet, next week for sure I will be dedicated to this, but let me bring some updates for you. I executed some tests here as I said for you, and I could find the possible motive for you have this kind of problem, right now I am working not only to fix the problem, but I am also measuring the possibility for we have a kind of alarm when a stream stop to sends message.
In my specific case I verified that 90% of the time this was generated due problem of connection and the other 10% of the time due the fact I was using an old hardware to reproduce the tests, please, can you give us more logs to confirm that in your side you are having only the most common problem that I detected?
thiagoftsm
on 20 Sep 2019
I am not sure I fully understand. Please, advise what tests should I perform on my side?
And what changed between v1.13 and v1.17 so much, that we did not have any problems on v1.13, and now on v1.17 we do?
noobiek
on 20 Sep 2019
You only need to run another grep STREAM error.log on your servers for we check the errors. In my case I let 12 hours running here and thanks this I could identify the two problems that I described.
Between these versions we had a lot changes in our code, but I can say for sure that two areas that are directly related with the error you are having changed, the stream began to accept SSL connections, so it is possible that there was problem when we brought it. Another possibility is some changes that were done in our database and we are storing the data there we are creating this kind of problem.
The SSL side I already investigated and I could not find the error, I saw this first, because I brought this code, the database on the other hand I am studying yet.
thiagoftsm
on 20 Sep 2019
OK! Thanks for the explanation!
And here are the last logs from master:
2019-09-20 17:08:50: netdata INFO  : STREAM_RECEIVER[wtdb1,[_SLAVE_IP_]:50760] : host 'wtdb1', chart users.vmem: took too long to be updated (counter #4040, update #33, 20123.468 secs). Resetting it.
2019-09-20 17:08:50: netdata INFO  : STREAM_RECEIVER[wtdb1,[_SLAVE_IP_]:50760] : host 'wtdb1', chart users.swap: took too long to be updated (counter #4040, update #33, 20121.451 secs). Resetting it.
2019-09-20 17:08:50: netdata INFO  : STREAM_RECEIVER[wtdb1,[_SLAVE_IP_]:50760] : host 'wtdb1', chart users.minor_faults: took too long to be updated (counter #4628, update #33, 23062.040 secs). Resetting it.
2019-09-20 17:08:50: netdata INFO  : STREAM_RECEIVER[wtdb1,[_SLAVE_IP_]:50760] : host 'wtdb1', chart users.files: took too long to be updated (counter #5170, update #33, 25771.948 secs). Resetting it.
2019-09-20 17:08:50: netdata INFO  : STREAM_RECEIVER[wtdb1,[_SLAVE_IP_]:50760] : host 'wtdb1', chart groups.uptime_max: took too long to be updated (counter #5157, update #33, 25709.729 secs). Resetting it.
2019-09-20 17:08:50: netdata INFO  : STREAM_RECEIVER[wtdb1,[_SLAVE_IP_]:50760] : host 'wtdb1', chart groups.major_faults: took too long to be updated (counter #5233, update #33, 26089.334 secs). Resetting it.
2019-09-20 17:08:55: netdata INFO  : STREAM_RECEIVER[wtdb1,[_SLAVE_IP_]:50760] : host 'wtdb1', chart netdata.apps_sizes: took too long to be updated (counter #7768, update #34, 38756.387 secs). Resetting it.
2019-09-20 17:08:55: netdata INFO  : STREAM_RECEIVER[wtdb1,[_SLAVE_IP_]:50760] : host 'wtdb1', chart netdata.apps_fix: took too long to be updated (counter #7767, update #34, 38753.964 secs). Resetting it.
2019-09-20 17:08:55: netdata INFO  : STREAM_RECEIVER[wtdb1,[_SLAVE_IP_]:50760] : host 'wtdb1', chart netdata.apps_children_fix: took too long to be updated (counter #7767, update #34, 38752.334 secs). Resetting it.
2019-09-20 17:08:55: netdata INFO  : STREAM_RECEIVER[wtdb1,[_SLAVE_IP_]:50760] : host 'wtdb1', chart apps.cpu_user: took too long to be updated (counter #5112, update #34, 25478.503 secs). Resetting it.
2019-09-20 17:08:55: netdata INFO  : STREAM_RECEIVER[wtdb1,[_SLAVE_IP_]:50760] : host 'wtdb1', chart apps.cpu_system: took too long to be updated (counter #7253, update #34, 36182.607 secs). Resetting it.
2019-09-20 17:08:55: netdata INFO  : STREAM_RECEIVER[wtdb1,[_SLAVE_IP_]:50760] : host 'wtdb1', chart apps.threads: took too long to be updated (counter #7251, update #34, 36171.513 secs). Resetting it.
2019-09-20 17:08:55: netdata INFO  : STREAM_RECEIVER[wtdb1,[_SLAVE_IP_]:50760] : host 'wtdb1', chart apps.processes: took too long to be updated (counter #7248, update #34, 36155.913 secs). Resetting it.
2019-09-20 17:08:55: netdata INFO  : STREAM_RECEIVER[wtdb1,[_SLAVE_IP_]:50760] : host 'wtdb1', chart apps.uptime: took too long to be updated (counter #7147, update #34, 35654.363 secs). Resetting it.
2019-09-20 17:08:55: netdata INFO  : STREAM_RECEIVER[wtdb1,[_SLAVE_IP_]:50760] : host 'wtdb1', chart apps.mem: took too long to be updated (counter #7114, update #34, 35488.808 secs). Resetting it.
2019-09-20 17:08:55: netdata INFO  : STREAM_RECEIVER[wtdb1,[_SLAVE_IP_]:50760] : host 'wtdb1', chart apps.swap: took too long to be updated (counter #7082, update #34, 35327.840 secs). Resetting it.
2019-09-20 17:08:55: netdata INFO  : STREAM_RECEIVER[wtdb1,[_SLAVE_IP_]:50760] : host 'wtdb1', chart apps.minor_faults: took too long to be updated (counter #4862, update #34, 24227.685 secs). Resetting it.
2019-09-20 17:08:55: netdata INFO  : STREAM_RECEIVER[wtdb1,[_SLAVE_IP_]:50760] : host 'wtdb1', chart apps.preads: took too long to be updated (counter #7071, update #34, 35271.644 secs). Resetting it.
2019-09-20 17:08:55: netdata INFO  : STREAM_RECEIVER[wtdb1,[_SLAVE_IP_]:50760] : host 'wtdb1', chart apps.pipes: took too long to be updated (counter #5567, update #35, 27745.420 secs). Resetting it.
2019-09-20 17:08:55: netdata INFO  : STREAM_RECEIVER[wtdb1,[_SLAVE_IP_]:50760] : host 'wtdb1', chart users.cpu_system: took too long to be updated (counter #4652, update #34, 23175.504 secs). Resetting it.
2019-09-20 17:08:55: netdata INFO  : STREAM_RECEIVER[wtdb1,[_SLAVE_IP_]:50760] : host 'wtdb1', chart users.threads: took too long to be updated (counter #7050, update #34, 35168.879 secs). Resetting it.
2019-09-20 17:08:55: netdata INFO  : STREAM_RECEIVER[wtdb1,[_SLAVE_IP_]:50760] : host 'wtdb1', chart users.processes: took too long to be updated (counter #7045, update #34, 35144.540 secs). Resetting it.
2019-09-20 17:08:55: netdata INFO  : STREAM_RECEIVER[wtdb1,[_SLAVE_IP_]:50760] : host 'wtdb1', chart users.uptime_min: took too long to be updated (counter #7172, update #34, 35779.833 secs). Resetting it.
2019-09-20 17:08:55: netdata INFO  : STREAM_RECEIVER[wtdb1,[_SLAVE_IP_]:50760] : host 'wtdb1', chart users.uptime_avg: took too long to be updated (counter #7172, update #34, 35777.255 secs). Resetting it.
2019-09-20 17:08:55: netdata INFO  : STREAM_RECEIVER[wtdb1,[_SLAVE_IP_]:50760] : host 'wtdb1', chart users.uptime_max: took too long to be updated (counter #7091, update #34, 35374.622 secs). Resetting it.
2019-09-20 17:08:55: netdata INFO  : STREAM_RECEIVER[wtdb1,[_SLAVE_IP_]:50760] : host 'wtdb1', chart users.major_faults: took too long to be updated (counter #7002, update #34, 34929.610 secs). Resetting it.
2019-09-20 17:08:55: netdata INFO  : STREAM_RECEIVER[wtdb1,[_SLAVE_IP_]:50760] : host 'wtdb1', chart users.lreads: took too long to be updated (counter #7000, update #34, 34919.640 secs). Resetting it.
2019-09-20 17:08:55: netdata INFO  : STREAM_RECEIVER[wtdb1,[_SLAVE_IP_]:50760] : host 'wtdb1', chart users.lwrites: took too long to be updated (counter #7000, update #34, 34916.276 secs). Resetting it.
2019-09-20 17:08:55: netdata INFO  : STREAM_RECEIVER[wtdb1,[_SLAVE_IP_]:50760] : host 'wtdb1', chart users.pwrites: took too long to be updated (counter #7127, update #34, 35553.074 secs). Resetting it.
2019-09-20 17:08:55: netdata INFO  : STREAM_RECEIVER[wtdb1,[_SLAVE_IP_]:50760] : host 'wtdb1', chart users.sockets: took too long to be updated (counter #6998, update #34, 34908.170 secs). Resetting it.
2019-09-20 17:08:55: netdata INFO  : STREAM_RECEIVER[wtdb1,[_SLAVE_IP_]:50760] : host 'wtdb1', chart users.pipes: took too long to be updated (counter #6990, update #34, 34865.371 secs). Resetting it.
2019-09-20 17:08:55: netdata INFO  : STREAM_RECEIVER[wtdb1,[_SLAVE_IP_]:50760] : host 'wtdb1', chart groups.cpu: took too long to be updated (counter #6989, update #34, 34863.069 secs). Resetting it.
2019-09-20 17:08:55: netdata INFO  : STREAM_RECEIVER[wtdb1,[_SLAVE_IP_]:50760] : host 'wtdb1', chart groups.cpu_user: took too long to be updated (counter #6989, update #34, 34860.466 secs). Resetting it.
2019-09-20 17:08:55: netdata INFO  : STREAM_RECEIVER[wtdb1,[_SLAVE_IP_]:50760] : host 'wtdb1', chart groups.cpu_system: took too long to be updated (counter #6988, update #34, 34858.502 secs). Resetting it.
2019-09-20 17:08:55: netdata INFO  : STREAM_RECEIVER[wtdb1,[_SLAVE_IP_]:50760] : host 'wtdb1', chart groups.threads: took too long to be updated (counter #6988, update #34, 34856.621 secs). Resetting it.
2019-09-20 17:08:55: netdata INFO  : STREAM_RECEIVER[wtdb1,[_SLAVE_IP_]:50760] : host 'wtdb1', chart groups.processes: took too long to be updated (counter #6984, update #34, 34836.179 secs). Resetting it.
2019-09-20 17:08:55: netdata INFO  : STREAM_RECEIVER[wtdb1,[_SLAVE_IP_]:50760] : host 'wtdb1', chart groups.uptime: took too long to be updated (counter #6983, update #34, 34834.167 secs). Resetting it.
2019-09-20 17:08:55: netdata INFO  : STREAM_RECEIVER[wtdb1,[_SLAVE_IP_]:50760] : host 'wtdb1', chart groups.uptime_avg: took too long to be updated (counter #7111, update #34, 35470.542 secs). Resetting it.
2019-09-20 17:08:55: netdata INFO  : STREAM_RECEIVER[wtdb1,[_SLAVE_IP_]:50760] : host 'wtdb1', chart groups.mem: took too long to be updated (counter #6982, update #34, 34825.732 secs). Resetting it.
2019-09-20 17:08:55: netdata INFO  : STREAM_RECEIVER[wtdb1,[_SLAVE_IP_]:50760] : host 'wtdb1', chart groups.vmem: took too long to be updated (counter #6978, update #34, 34807.693 secs). Resetting it.
2019-09-20 17:08:55: netdata INFO  : STREAM_RECEIVER[wtdb1,[_SLAVE_IP_]:50760] : host 'wtdb1', chart groups.swap: took too long to be updated (counter #6982, update #34, 34825.769 secs). Resetting it.
2019-09-20 17:08:55: netdata INFO  : STREAM_RECEIVER[wtdb1,[_SLAVE_IP_]:50760] : host 'wtdb1', chart groups.minor_faults: took too long to be updated (counter #6981, update #34, 34823.008 secs). Resetting it.
2019-09-20 17:08:55: netdata INFO  : STREAM_RECEIVER[wtdb1,[_SLAVE_IP_]:50760] : host 'wtdb1', chart groups.lreads: took too long to be updated (counter #7104, update #34, 35439.126 secs). Resetting it.
2019-09-20 17:08:55: netdata INFO  : STREAM_RECEIVER[wtdb1,[_SLAVE_IP_]:50760] : host 'wtdb1', chart groups.lwrites: took too long to be updated (counter #7089, update #34, 35363.977 secs). Resetting it.
2019-09-20 17:08:55: netdata INFO  : STREAM_RECEIVER[wtdb1,[_SLAVE_IP_]:50760] : host 'wtdb1', chart groups.preads: took too long to be updated (counter #7089, update #34, 35361.761 secs). Resetting it.
2019-09-20 17:08:55: netdata INFO  : STREAM_RECEIVER[wtdb1,[_SLAVE_IP_]:50760] : host 'wtdb1', chart groups.pwrites: took too long to be updated (counter #7089, update #34, 35359.900 secs). Resetting it.
2019-09-20 17:08:55: netdata INFO  : STREAM_RECEIVER[wtdb1,[_SLAVE_IP_]:50760] : host 'wtdb1', chart groups.files: took too long to be updated (counter #7088, update #34, 35357.411 secs). Resetting it.
2019-09-20 17:08:55: netdata INFO  : STREAM_RECEIVER[wtdb1,[_SLAVE_IP_]:50760] : host 'wtdb1', chart groups.sockets: took too long to be updated (counter #7091, update #34, 35374.493 secs). Resetting it.
It is possible that memory mode = map is too heavy on your systems? Do you have a lot of free memory and swap space in the master server? How big is your history in the master netdata server? If you don't need a lot of history you can use something like memory mode = save that should fit in memory.
If you need a lot of history you could try the new memory mode = dbengine that will not thrash the master server's disk and memory.
You can try setting memory mode = dbengine in the master server and restart the netdata service to take effect.
 mfundul
on 20 Sep 2019
mfundul
on 20 Sep 2019
Hi @noobiek ,
In your case you are having only one problem, this is what I wanted to know. Thank you.
Please, check what @mfundul said, because it is another possible problem in your case, as I described before.
thiagoftsm
on 20 Sep 2019
Thanks for the ideas!
I've set memory mode = dbengine but it did not help. The symptoms are still the same. :(
noobiek
on 20 Sep 2019
Thanks for the ideas!
I've setmemory mode = dbenginebut it did not help. The symptoms are still the same. :(
Did you set it in the master netdata host?
Did you reset the master netdata host service?
What's the output of free -m in your master netdata host?
mfundul
on 20 Sep 2019
@noobiek also important, you must do that in stream.conf as well as in netdata.conf.
mfundul
on 20 Sep 2019
Did you set it in the master netdata host?
Yes.
Did you reset the master netdata host service?
Yes.
What's the output of free -m in your master netdata host?

also important, you must do that in stream.conf as well as in netdata.conf.
Nice detail! 👍 But still...
noobiek
on 20 Sep 2019
Hi!
Here is a new one:
Master stopped receiving stream data from half of slaves. And of course "I didn't touch anything!" (apart from memory mode = dbengine on Master) :)
Here are last logs from aforementioned v17 Slave
2019-09-25 12:09:19: netdata INFO  : STREAM_SENDER[wtdb1] : STREAM wtdb1 [send to _MASTER_IP_:19999]: connecting...
2019-09-25 12:09:19: netdata INFO  : STREAM_SENDER[wtdb1] : STREAM wtdb1 [send to _MASTER_IP_:19999]: initializing communication...
2019-09-25 12:09:19: netdata INFO  : STREAM_SENDER[wtdb1] : STREAM wtdb1 [send to _MASTER_IP_:19999]: waiting response from remote netdata...
2019-09-25 12:09:19: netdata ERROR : STREAM_SENDER[wtdb1] : STREAM wtdb1 [send to _MASTER_IP_:19999]: server is not replying properly (is it a netdata?).
2019-09-25 12:09:24: netdata INFO  : STREAM_SENDER[wtdb1] : STREAM wtdb1 [send to _MASTER_IP_:19999]: connecting...
2019-09-25 12:09:24: netdata INFO  : STREAM_SENDER[wtdb1] : STREAM wtdb1 [send to _MASTER_IP_:19999]: initializing communication...
2019-09-25 12:09:24: netdata INFO  : STREAM_SENDER[wtdb1] : STREAM wtdb1 [send to _MASTER_IP_:19999]: waiting response from remote netdata...
2019-09-25 12:09:24: netdata ERROR : STREAM_SENDER[wtdb1] : STREAM wtdb1 [send to _MASTER_IP_:19999]: server is not replying properly (is it a netdata?).
2019-09-25 12:09:29: netdata INFO  : STREAM_SENDER[wtdb1] : STREAM wtdb1 [send to _MASTER_IP_:19999]: connecting...
2019-09-25 12:09:29: netdata INFO  : STREAM_SENDER[wtdb1] : STREAM wtdb1 [send to _MASTER_IP_:19999]: initializing communication...
2019-09-25 12:09:29: netdata INFO  : STREAM_SENDER[wtdb1] : STREAM wtdb1 [send to _MASTER_IP_:19999]: waiting response from remote netdata...
2019-09-25 12:09:29: netdata ERROR : STREAM_SENDER[wtdb1] : STREAM wtdb1 [send to _MASTER_IP_:19999]: server is not replying properly (is it a netdata?).
2019-09-25 12:09:34: netdata INFO  : STREAM_SENDER[wtdb1] : STREAM wtdb1 [send to _MASTER_IP_:19999]: connecting...
2019-09-25 12:09:34: netdata INFO  : STREAM_SENDER[wtdb1] : STREAM wtdb1 [send to _MASTER_IP_:19999]: initializing communication...
2019-09-25 12:09:34: netdata INFO  : STREAM_SENDER[wtdb1] : STREAM wtdb1 [send to _MASTER_IP_:19999]: waiting response from remote netdata...
2019-09-25 12:09:34: netdata ERROR : STREAM_SENDER[wtdb1] : STREAM wtdb1 [send to _MASTER_IP_:19999]: server is not replying properly (is it a netdata?).
And same from one of the missing v13 Slaves:
2019-09-25 12:09:22: netdata INFO  : STREAM_SENDER[wtapp1] : STREAM wtapp1 [send to _MASTER_IP_:19999]: connecting...
2019-09-25 12:09:22: netdata INFO  : STREAM_SENDER[wtapp1] : STREAM wtapp1 [send to _MASTER_IP_:19999]: initializing communication...
2019-09-25 12:09:22: netdata INFO  : STREAM_SENDER[wtapp1] : STREAM wtapp1 [send to _MASTER_IP_:19999]: waiting response from remote netdata...
2019-09-25 12:09:22: netdata ERROR : STREAM_SENDER[wtapp1] : STREAM wtapp1 [send to _MASTER_IP_:19999]: server is not replying properly (is it a netdata?).
2019-09-25 12:09:27: netdata INFO  : STREAM_SENDER[wtapp1] : STREAM wtapp1 [send to _MASTER_IP_:19999]: connecting...
2019-09-25 12:09:27: netdata INFO  : STREAM_SENDER[wtapp1] : STREAM wtapp1 [send to _MASTER_IP_:19999]: initializing communication...
2019-09-25 12:09:27: netdata INFO  : STREAM_SENDER[wtapp1] : STREAM wtapp1 [send to _MASTER_IP_:19999]: waiting response from remote netdata...
2019-09-25 12:09:27: netdata ERROR : STREAM_SENDER[wtapp1] : STREAM wtapp1 [send to _MASTER_IP_:19999]: server is not replying properly (is it a netdata?).
2019-09-25 12:09:32: netdata INFO  : STREAM_SENDER[wtapp1] : STREAM wtapp1 [send to _MASTER_IP_:19999]: connecting...
2019-09-25 12:09:32: netdata INFO  : STREAM_SENDER[wtapp1] : STREAM wtapp1 [send to _MASTER_IP_:19999]: initializing communication...
2019-09-25 12:09:32: netdata INFO  : STREAM_SENDER[wtapp1] : STREAM wtapp1 [send to _MASTER_IP_:19999]: waiting response from remote netdata...
2019-09-25 12:09:32: netdata ERROR : STREAM_SENDER[wtapp1] : STREAM wtapp1 [send to _MASTER_IP_:19999]: server is not replying properly (is it a netdata?).
2019-09-25 12:09:37: netdata INFO  : STREAM_SENDER[wtapp1] : STREAM wtapp1 [send to _MASTER_IP_:19999]: connecting...
2019-09-25 12:09:37: netdata INFO  : STREAM_SENDER[wtapp1] : STREAM wtapp1 [send to _MASTER_IP_:19999]: initializing communication...
2019-09-25 12:09:37: netdata INFO  : STREAM_SENDER[wtapp1] : STREAM wtapp1 [send to _MASTER_IP_:19999]: waiting response from remote netdata...
2019-09-25 12:09:37: netdata ERROR : STREAM_SENDER[wtapp1] : STREAM wtapp1 [send to _MASTER_IP_:19999]: server is not replying properly (is it a netdata?).
Then I restarted netdata v17 Master and list of available slaves changed. Some became available again, others became unavailable.
Should I start a new issue?
Thanks!
noobiek
on 25 Sep 2019
Thanks @noobiek , I will dedicate my day to this, it is not necessary to open another, it was already opened the tick #6946 for this.
thiagoftsm
on 25 Sep 2019
OK, let me know, if you need anything from my side.
So far nothing changed in my configs since original issue. I still have one v17 Master, one v17 Slave and several v13 Slaves.
noobiek
on 25 Sep 2019
@noobiek as I said yesterday, I am working to fix all problems related to stream and I saw a common pattern in my side on the master, please, can you confirm that you are also having in your master the message multiple streaming connections for the same host detected?
Best regards.
thiagoftsm
on 26 Sep 2019
Do you mean in error log?
noobiek
on 26 Sep 2019
Here's what I have for STREAM in error.log of Master for one of the "missing" Slaves:
2019-09-26 20:06:06: netdata INFO  : STREAM_RECEIVER[searchslave1,[_SLAVE_IP_]:36114] : thread created with task id 7862
2019-09-26 20:06:06: netdata INFO  : STREAM_RECEIVER[searchslave1,[_SLAVE_IP_]:36114] : set name of thread 7862 to STREAM_RECEIVER
2019-09-26 20:06:06: netdata INFO  : STREAM_RECEIVER[searchslave1,[_SLAVE_IP_]:36114] : STREAM searchslave1 [_SLAVE_IP_]:36114: receive thread created (task id 7862)
2019-09-26 20:06:06: netdata ERROR : STREAM_RECEIVER[searchslave1,[_SLAVE_IP_]:36114] : Exceeded the budget of available file descriptors (300/256), cannot create new dbengine instance. (errno 17, File exists)
2019-09-26 20:06:06: netdata ERROR : STREAM_RECEIVER[searchslave1,[_SLAVE_IP_]:36114] : Host 'searchslave1': cannot initialize host with machine guid '2d97bade-4b11-11e9-b7ad-00505699aefc'. Failed to initialize DB engine at '/opt/netdata/var/cache/netdata/2d97bade-4b11-11e9-b7ad-00505699aefc'.
2019-09-26 20:06:06: netdata INFO  : STREAM_RECEIVER[searchslave1,[_SLAVE_IP_]:36114] : Freeing all memory for host 'searchslave1'...
2019-09-26 20:06:06: netdata ERROR : STREAM_RECEIVER[searchslave1,[_SLAVE_IP_]:36114] : RRDHOST 'searchslave1' removed from index, deleted the wrong entry. (errno 22, Invalid argument)
2019-09-26 20:06:06: netdata ERROR : STREAM_RECEIVER[searchslave1,[_SLAVE_IP_]:36114] : Request to free RRDHOST 'searchslave1': cannot find it
2019-09-26 20:06:06: netdata INFO  : STREAM_RECEIVER[searchslave1,[_SLAVE_IP_]:36114] : SYSTEM_INFO: free 0x7f00b6da9fc0
2019-09-26 20:06:06: netdata ERROR : STREAM_RECEIVER[searchslave1,[_SLAVE_IP_]:36114] : STREAM searchslave1 [receive from [_SLAVE_IP_]:36114]: failed to find/create host structure. (errno 22, Invalid argument)
2019-09-26 20:06:06: netdata INFO  : STREAM_RECEIVER[searchslave1,[_SLAVE_IP_]:36114] : STREAM searchslave1 [receive from [_SLAVE_IP_]:36114]: receive thread ended (task id 7862)
2019-09-26 20:06:06: netdata INFO  : STREAM_RECEIVER[searchslave1,[_SLAVE_IP_]:36114] : thread with task id 7862 finished
Should I increase this
dbengine disk space = 256
?
noobiek
on 26 Sep 2019
I guess I should apologize here. I didn't quite catch the importance of file descriptors for dbengine mode explained on this page - https://docs.netdata.cloud/database/engine/
Now I've set descriptors limit to 65000 and all slaves are visible again.
v13 Slaves began updating correctly, new data appeared.
And v17 Slave (with incorrect metrics) new data were not appearing. There were no errors in logs.
I stopped Master service. Cleaned all cache. Started Master service. Slave v17 data now stream again.
So far metrics are correct. But it happened before that for 2-5 minutes after restart metrics were correct. So I'll wait for 5 minutes and let you know how things go.
noobiek
on 26 Sep 2019
Hi @noobiek ,
Do not worry, you did not create any problem, it is our mission to deliver the best software possible and thanks your report, I am reviewing the whole stream to be sure that we are not having problems.
I will wait your feedback to be sure that the error that you reported is not present, but I will continue debugging any way.
Thanks for your report!
Best regards.
thiagoftsm
on 26 Sep 2019
@thiagoftsm
So, we are 25 minutes since reboot, and the metrics are still correct!
As you remember, we did clean cache before and it did not help.
So what changed (and apparently helped) is
- Switched v17 Master to dbengine
- Changed v17 Master file descriptors param in systemd service override
- Restarted v17 Slave netdata service
- Cleaned v17 Master cache and restarted netdata service
I'll try to update some other v13 Slave now and see what happens. I'll let you know.
noobiek
on 26 Sep 2019
@thiagoftsm
So, we are 25 minutes since reboot, and the metrics are still correct!
As you remember, we did clean cache before and it did not help.
So what changed (and apparently helped) is1. Switched v17 Master to dbengine 2. Changed v17 Master file descriptors param in systemd service override 3. Restarted v17 Slave netdata service 4. Cleaned v17 Master cache and restarted netdata serviceI'll try to update some other v13 Slave now and see what happens. I'll let you know.
So maybe it was memory mode = map being too heavy after all.
mfundul
on 26 Sep 2019
Well, there was some unsued memory still. Plus I did not have any issues on v13.
And I guess it would be user friendly to see some notifications of such cases in Web UI. :-P
Edit: 11 minutes after upgrading another v13 to v1.17.1-111-g01d78bd3 - everything is OK.
noobiek
on 26 Sep 2019
I am glad with how the things are going now.
I will talk with our Documentation guys about your request! ;)
I will give a suggestion now, let us keep this ticket open at least until next Monday, in my vision, it is a good idea we allow your servers to stay a long time running for we confirm that we do not have any problem.
thiagoftsm
on 26 Sep 2019
Sure, I'll post an update on Monday then.
Thanks!
noobiek
on 26 Sep 2019
Hi @thiagoftsm
So far all metrics are showing without issues on 2 v17 Slaves (old and new) and all other v13 Slaves.
I'll go on with upgrades now. We may close this issue, I guess. If I face anything new - I'll either open this issue or start a new one.
Thank you for your help again! :)
noobiek
on 30 Sep 2019
Thank you very much @noobiek, we are glad that everything is going fine now in your side.
Case you wanna wait the end of update to close the issue, be free to do this.
It was a pleasure to help you! :)
thiagoftsm
on 30 Sep 2019
I upgraded all slaves to v17 now. So far all good!
noobiek
on 30 Sep 2019
Related issues
 askd77
·
71Comments
askd77
·
71Comments
 breed808
·
59Comments
breed808
·
59Comments
 luvpreetsingh
·
67Comments
luvpreetsingh
·
67Comments
 ldelossa
·
107Comments
ldelossa
·
107Comments
 kevincaradant
·
55Comments
kevincaradant
·
55Comments
Most helpful comment
Hi @noobiek, I could repeat the problem that you reported, I am now investigating it, as soon I have the answer I will write here.