Nativescript: Memory Leak on iOS since tns-ios 3.0.0
Tell us about the problem
The image below is this app (shown on the left) going back and forth between a homepage and a page with a listview. Back-navigation doesn't clear the memory of the listview (inspecting the heap it mostly looks like retained labels, but I find it very hard to interpret):

Note this is a screenshot of the app after going back and forth exactly 172 times (as shown in the app's screenshot), and the blue graph on the right is Xcode reporting the heap size over time. As you can see it's growing with every visit of the listview.
Q. Dude, this is artificial!
A. While this may seem very artificial, I actually created this app to demonstrate a problem I saw in a real app. The app crashes after about 20 minutes of usage on an iPad Air (1GB RAM). It has lots more graphics and styling than this demo, so I had to add a lot of labels and automated navigation to reach the same level of memory pressure my app has. The problem with both apps is exactly the same: memory is retained. Forever. Until the app crashes.
Which platform(s) does your issue occur on?
iOS (didn't check Android)
Please provide the following version numbers that your issue occurs with:
- CLI: 3.1.0
- Cross-platform modules: 3.1.0
- Runtime(s): tns-ios 3.0.0 and 3.1.0 (same issue)
- Plugin(s): n/a
Please tell us how to recreate the issue in as much detail as possible.
Follow the instruction in the "Fully automated {N} Out Of Memory Crash App". It's based on this template.
I hope this app will help in identifying and verifying possible solutions. I've tried a few my own, but there are a few internal classes in the runtime I can't inspect so my hands are a bit tied in this case.
Thanks for any feedback you have in advance,
Eddy
 EddyVerbruggen
All 17 comments
I just tested the demo app with this tns-ios line changed to 2.5.0 and that produced a nice flat memory graph - so the issue was introduced with 3.0.0.
Here's tns-ios 2.5.0 after 100 loops and GC (tns-ios 3.0.0 and 3.1.0 consume 430 MB after GC):

Also tested tns-ios 2.5.1 which produces a similar nice flat graph. So the problem was introduced between 2.5.1 and 3.0.0.
EddyVerbruggen
on 4 Jul 2017
I am facing very the same problem as described above.
Target milestone is 3.2 which is planned for August - too long for me, is it possible to fix it before, I see it as a high priority bug.
Is downgrade to 2.5.x recommended workaround?
Any other suggestions?
 pawel-filuciak
on 14 Jul 2017
pawel-filuciak
on 14 Jul 2017
It is easily reproduced with this project:
https://github.com/EddyVerbruggen/nativescript-ios-out-of-memory
You can track leaked native objects following:
Start the debugging in Xcode and transfer to instruments, in “All Heap & Anonymous VM” at the bottom there is a “Mark Generation” you can click it, then “Loop 10x” then click “Collect Garbage” then again “Mark Generation” this leaves about 15Mb growth in gen2. 7MiB CFString (immutable) and & 7MiB in malloc_zone_malloc that is in UINavigationBar popNavigationItem then CALayer setAffineTransform.
 PanayotCankov
on 24 Jul 2017
PanayotCankov
on 24 Jul 2017
Just to add: I'm receiving more and more crash reports from beta testers through TestFlight. Until now it only happens on older devices with 1 GB RAM (iPad 3 for instance). Perhaps only once on an iPhone 7, but the TestFlight crash reports are often pretty useless.
This particular app is meant to be used and depends on going back and forth between (long) lists a lot so it's quite sensitive to this issue.
Eddy,
PanayotCankov
on 24 Jul 2017
Any update on this issue? We are also running into a similar issue with our production app using NativeScript. Our app will continue to allocate memory; starting at ~150mb to well over 500mb within minutes of navigating throughout the application.
 sean-perkins
on 31 Jul 2017
sean-perkins
on 31 Jul 2017
+1
 patrickpereira
on 1 Aug 2017
patrickpereira
on 1 Aug 2017
+1 from https://github.com/NativeScript/NativeScript/issues/4700 and from t1125793
 NickIliev
on 18 Aug 2017
NickIliev
on 18 Aug 2017
+1
 triniwiz
on 20 Aug 2017
triniwiz
on 20 Aug 2017
+1
 zf8848
on 20 Aug 2017
zf8848
on 20 Aug 2017
I found a memory leak in the iOS Runtime introduced in 3.0. This PR fixes the leak and makes the Xcode memory debugger to print no errors in a blank application.
However, some leaks are still reported in the Leak tool in instruments. After inspecting the call stack when the leaked memory is allocated, it seems that the Xcode Instruments consider the memory allocated here and here as leaked. Actually, this memory is owned by the FFICall instance and is deallocated in its destructor. However, most of the FFICall objects are never destructed (which is expected and desired behavior) and the memory is never deallocated (which is expected, too). It seems that this makes the Instruments to treat the memory as leaked, even if actually it is not.
Initially, I thought that the usage of new is what makes the Instruments tools to treat the memory as leaked, but even after refactoring the code to avoid the usage of new operator and replacing it with unique_ptr and std::vector objects saved as an instance variable (following the RAII technique), the allocations are still treated as memory leaks.
P.S.: I haven't investigated the tns-core-modules and the example app for existing memory leaks in their codebase. My main focus was the iOS Runtime.
 ivanbuhov
on 25 Aug 2017
ivanbuhov
on 25 Aug 2017
@ivanbuhov That's great news! I will be more than happy to run the example app (and my real app which suffers from this issue) with your PR included. Is there a way for me to "easily" grab a patched version?
EddyVerbruggen
on 25 Aug 2017
@EddyVerbruggen just install tns platform add ios@next or use next without @ in the package.json
 hshristov
on 25 Aug 2017
hshristov
on 25 Aug 2017
@ivanbuhov Tears of joy in my eyes - this seems to fix it indeed!
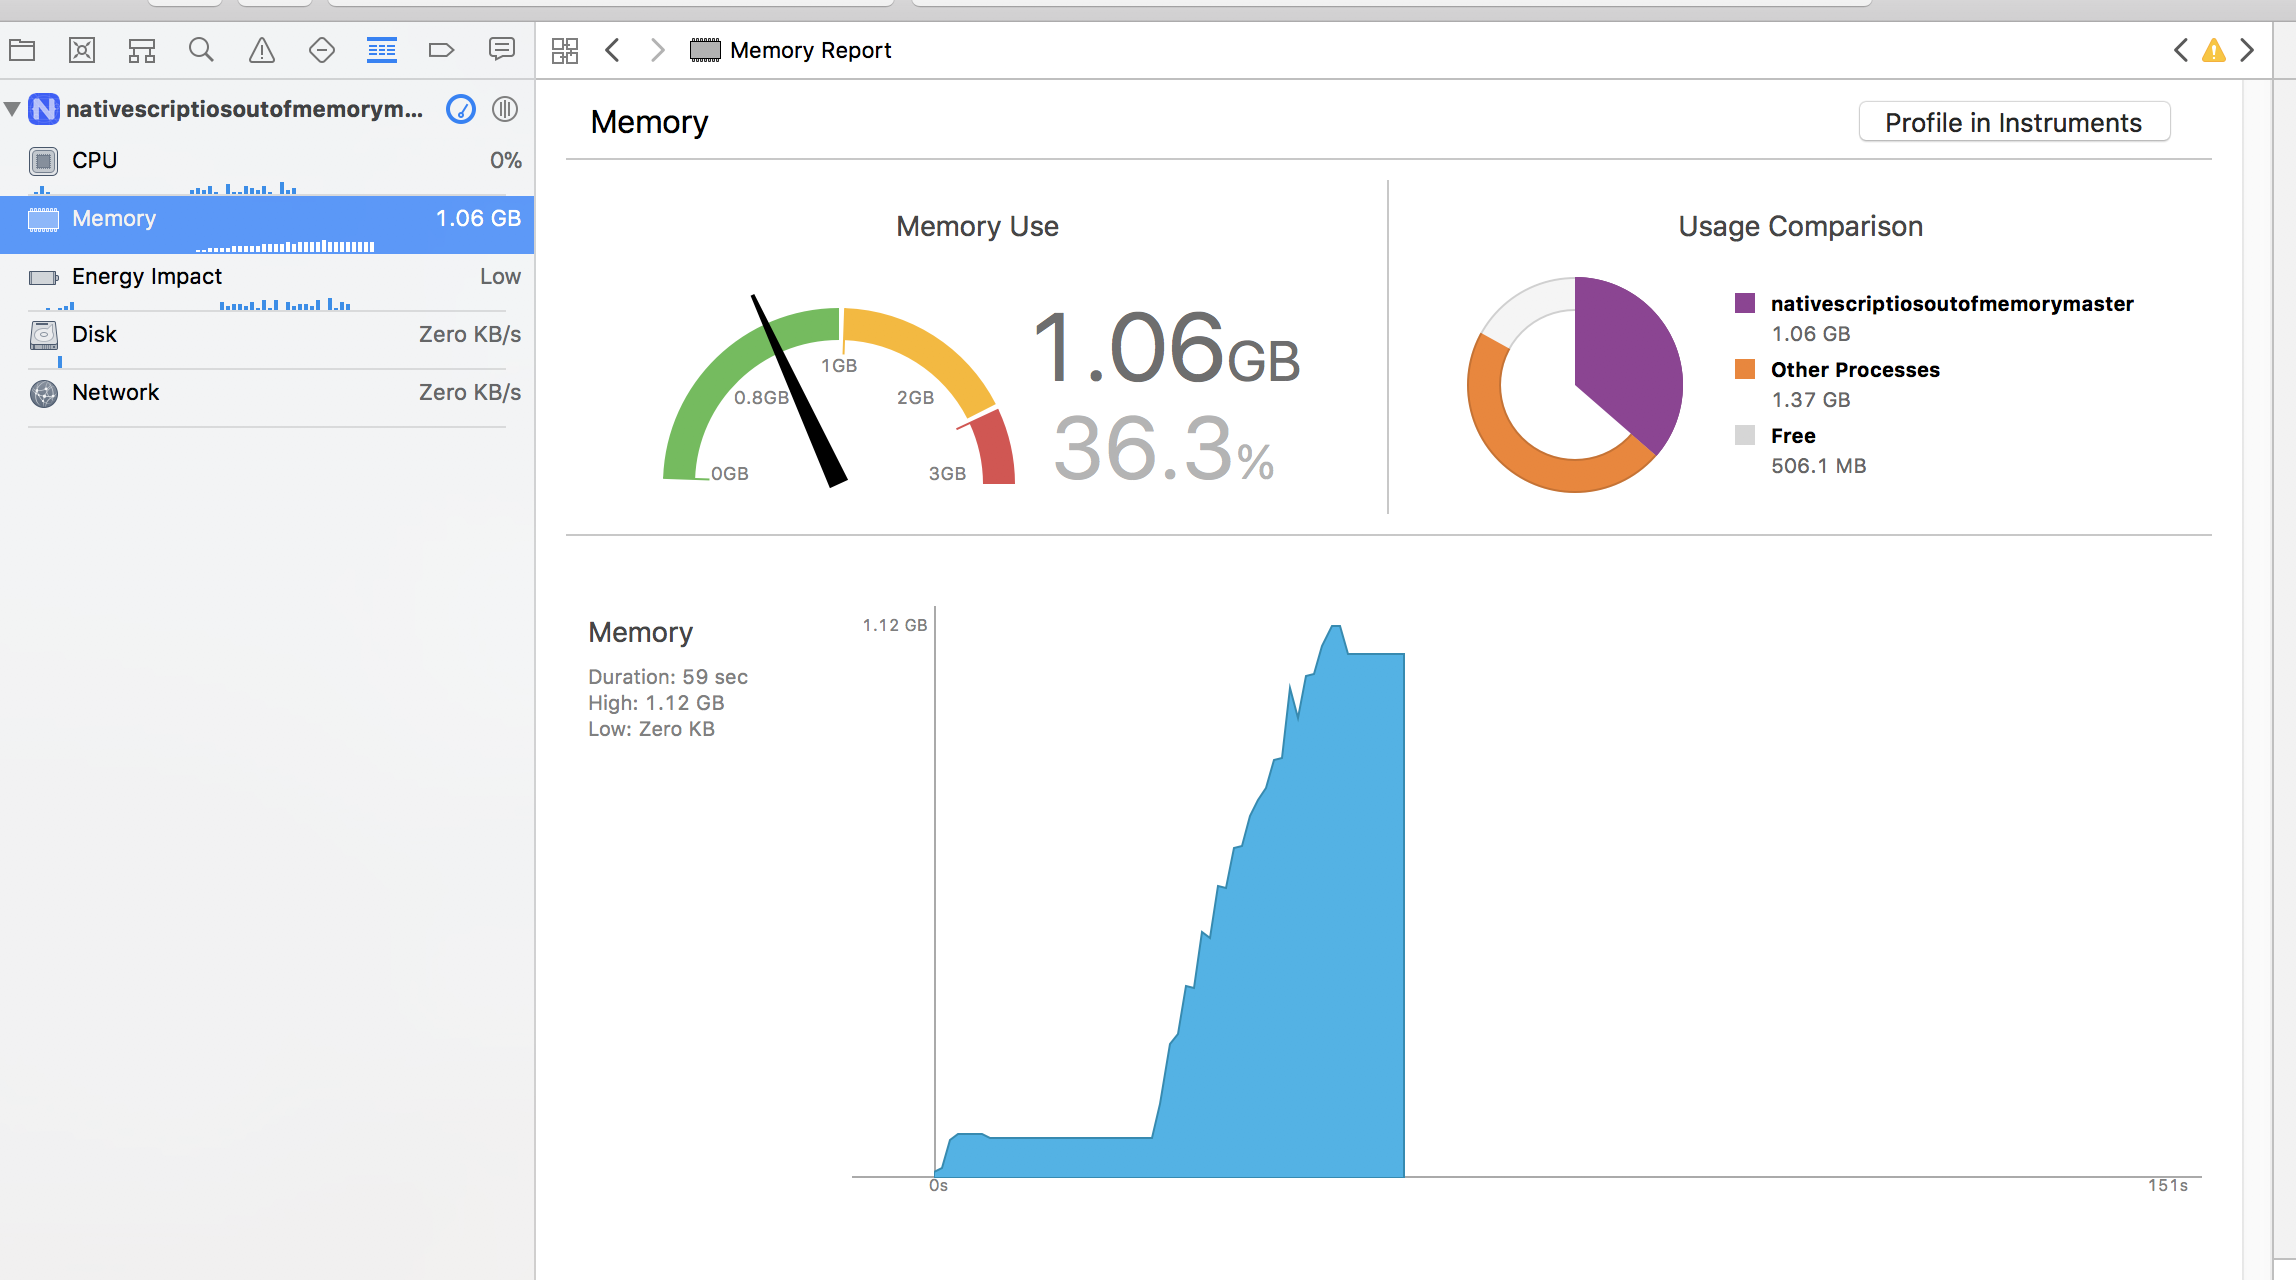
My test app (linked from the first comment) is an Angular app that loads an extreme amount of <Label>s in a <ListView>. Then goes back and reloads that list. 250x. The issue was (likely) the labels being retained and was also reproducable in a non-Angular app with RadListView.
To verify the fix I just ran tns-ios 3.1.0 on my iPhone 5s and 459 MB was retained after 250 loops and a call to GC(). At about 430 MB the console stared showing memory warning. Another 50-ish loops and it would have crashed the app:

Then I did this to get your fix:
tns platform remove ios
tns platform add ios@next
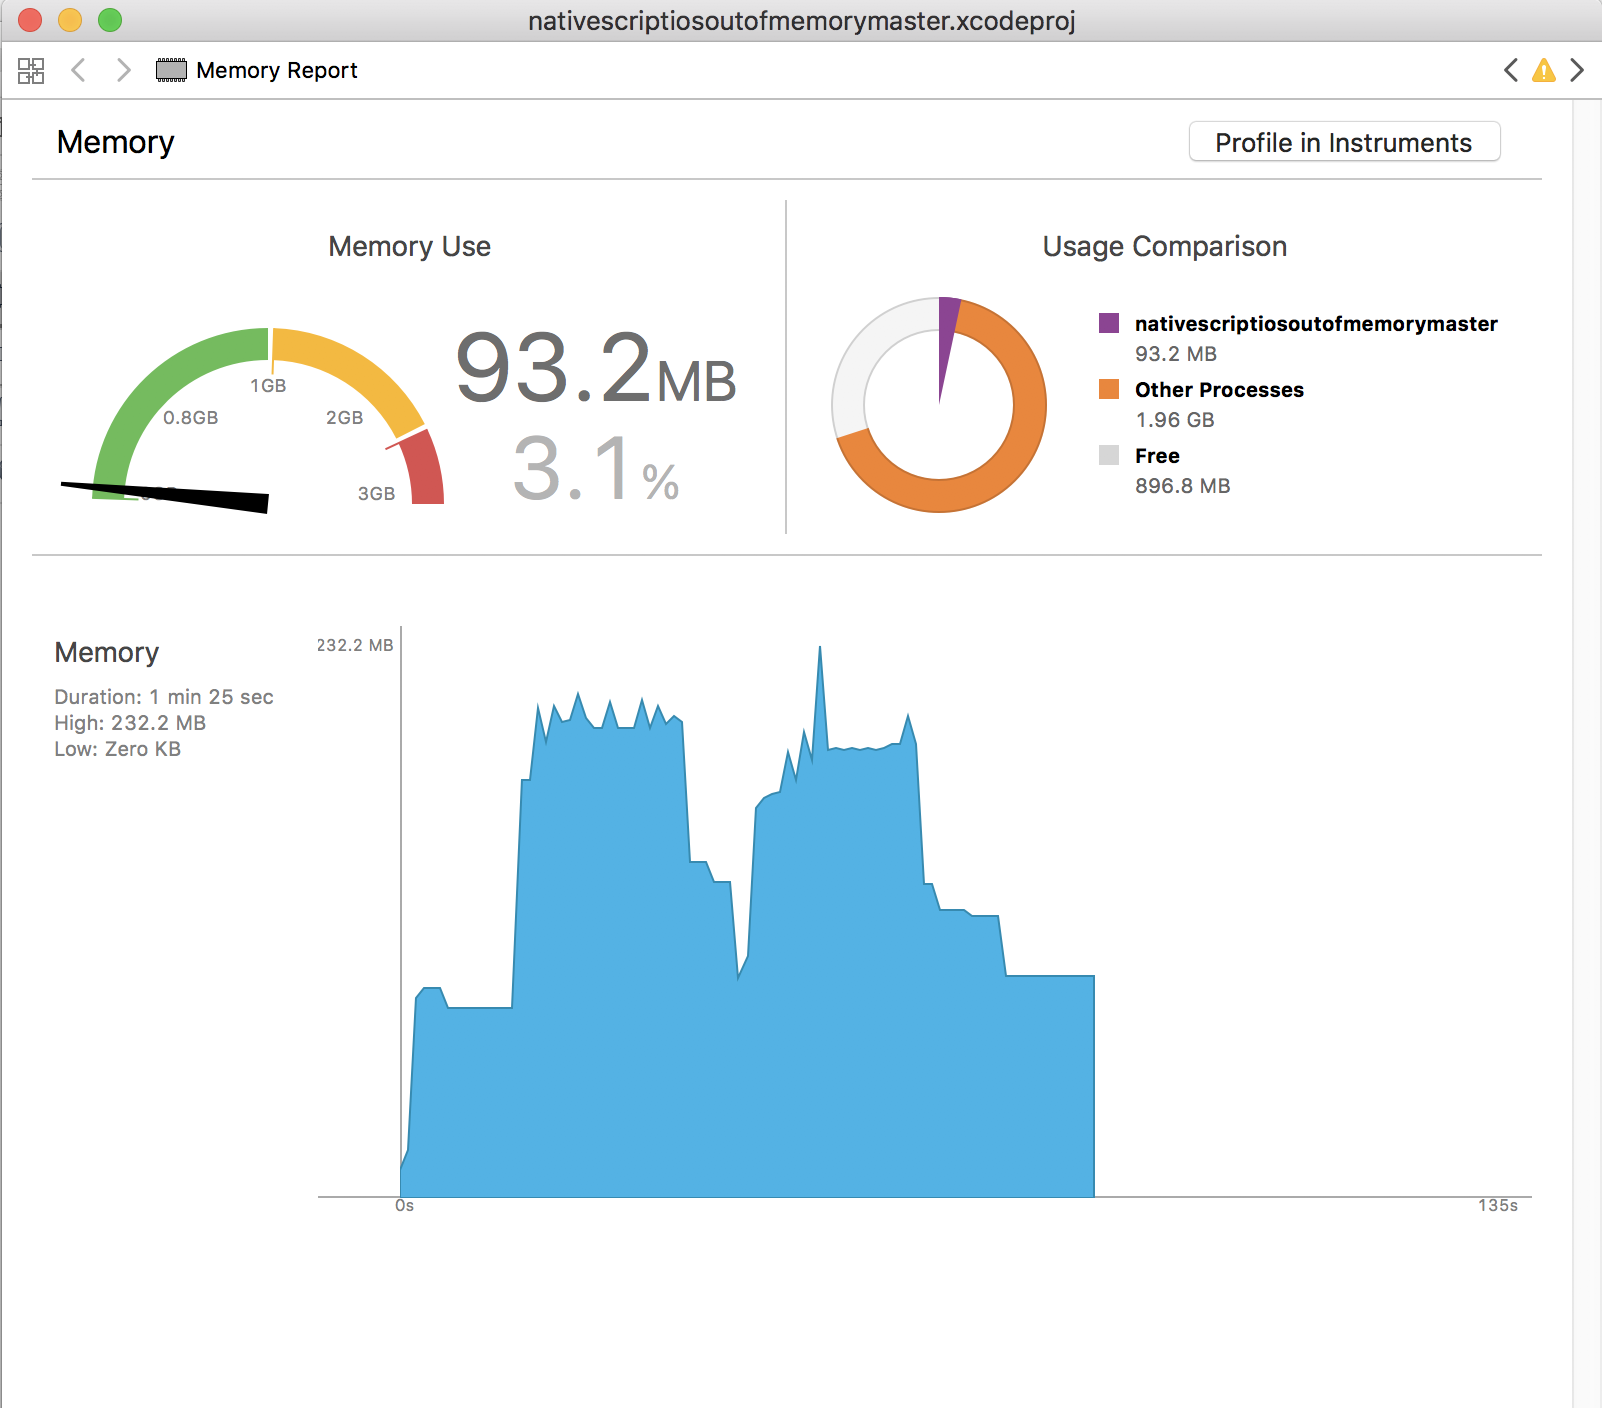
Next I rebooted my iPhone to make sure I had the same baseline and ran it again. Behold:

The app never peaked above 180 MB and after GC() it only retained 94 MB of memory (only a little more than when I started the app). This seems even better than my 2.5.0 testresult, but that's not the important point here ;)
THANK YOU!
EddyVerbruggen
on 25 Aug 2017
Great news 😃
triniwiz
on 25 Aug 2017
This is awesome :tada:
 NathanWalker
on 26 Aug 2017
NathanWalker
on 26 Aug 2017
@ivanbuhov should be reopened for ns-angular starting from v5.0.0
really critical issue a lot of memory leaks on ios that cause crash, i have run "Loop 10x" once on device (iPhone 7 Plus)
version 4.2.0 works perfect
 reposooo
on 22 Nov 2018
reposooo
on 22 Nov 2018
This thread has been automatically locked since there has not been any recent activity after it was closed. Please open a new issue for related bugs.
![lock[bot] picture](https://avatars1.githubusercontent.com/in/6672?v=4&s=40) lock[bot]
on 22 Nov 2019
lock[bot]
on 22 Nov 2019
Related issues
 dhanalakshmitawwa
·
3Comments
dhanalakshmitawwa
·
3Comments
 nirsalon
·
3Comments
nirsalon
·
3Comments
 guillaume-roy
·
3Comments
guillaume-roy
·
3Comments
 rLoka
·
3Comments
rLoka
·
3Comments
 tsonevn
·
3Comments
tsonevn
·
3Comments
Most helpful comment
@ivanbuhov Tears of joy in my eyes - this seems to fix it indeed!
My test app (linked from the first comment) is an Angular app that loads an extreme amount of
<Label>s in a<ListView>. Then goes back and reloads that list. 250x. The issue was (likely) the labels being retained and was also reproducable in a non-Angular app with RadListView.To verify the fix I just ran tns-ios 3.1.0 on my iPhone 5s and 459 MB was retained after 250 loops and a call to
GC(). At about 430 MB the console stared showing memory warning. Another 50-ish loops and it would have crashed the app:Then I did this to get your fix:
Next I rebooted my iPhone to make sure I had the same baseline and ran it again. Behold:
The app never peaked above 180 MB and after
GC()it only retained 94 MB of memory (only a little more than when I started the app). This seems even better than my 2.5.0 testresult, but that's not the important point here ;)THANK YOU!