Nativescript-ui-feedback: [Bug] Chart - setting 'minimum' > 0 on LinearAxis will hide the x-axis labels on iOS
Setting the minimum property of a LinearAxis to a value > 0 will hide the labels on the x-axis as those are drawn off canvas.
Which platform(s) does your issue occur on?
- iOS
Versions
- Progress NativeScript UI version: 2.0.1
- CLI: 3.0.1
- Cross-platform modules: 3.0.0
- Runtime(s): 3.0.0
Please tell us how to recreate the issue in as much detail as possible.
Add a graph like this to an Angular app (not that this is Angular related):
  <RadCartesianChart tkExampleTitle tkToggleNavButton>
    <DateTimeCategoricalAxis tkCartesianHorizontalAxis dateFormat="dd/MM"></DateTimeCategoricalAxis>
    <LinearAxis minimum="74" maximum="90" tkCartesianVerticalAxis></LinearAxis>
    <LineSeries tkCartesianSeries [items]="categoricalSource" categoryProperty="Date" valueProperty="Weight"></LineSeries>
  </RadCartesianChart>
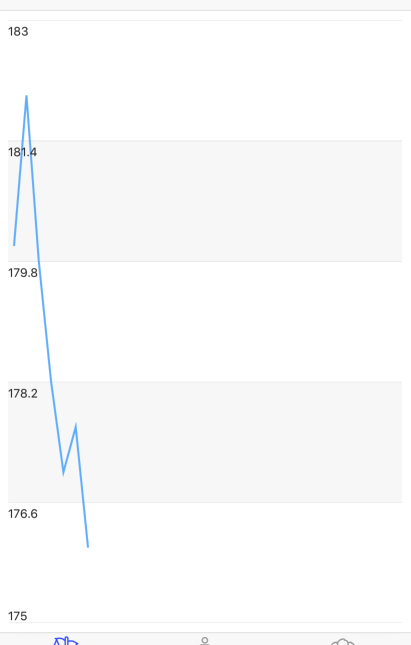
With the minimum set to 74, the value 0 is not drawn, so the labels of the x-axis (dates in this case) are not shown (image on the left, on the right is after my change, below).

What's the cause?
Check nativescript-telerik-ui-pro/chart/visualization/views/chart-axis.ios.js (I don't have access to the TypeScript sources). The function LinearAxis.prototype.onMinimumChanged never updates the offset / baseline properties which is where the x-axis labels are rendered. So on a local copy I've changed it to this to make the labels appear nicely (not sure you need to change both, this just worked on the first try so I didn't look back):
    LinearAxis.prototype.onMinimumChanged = function (oldValue, newValue) {
        if (!isNaN(+newValue)) {
            if (this.ios.range) {
                this.ios.range.minimum = newValue;
            }
            else {
                this.ios.range = TKRange.rangeWithMinimumAndMaximum(newValue, newValue * 2);
            }

            this.ios.offset = newValue; // added this
            this.ios.baseline = newValue; // .. and this

            this.update();
        }
    };
 EddyVerbruggen
All 12 comments
Thanks @EddyVerbruggen, we're reviewing the case and will include a fix in the next verion of NS-UI.
 ginev
on 16 May 2017
ginev
on 16 May 2017
@EddyVerbruggen,
We've investigated the case a bit more and have come to the conclusion that the fix suggested here is not an ultimate solution as there are cases in which it does not work as expected. The case needs to be handled at native level in the iOS Chart implementation. For the time being our suggestion is to simply set the .ios.offset and .ios.baseline properties in your particular scenario.
Is that alright with you?
ginev
on 29 May 2017
Of course. The further upstream this is fixed the better 👍
EddyVerbruggen
on 29 May 2017
I happened to have a repro of the problem in the Playground, so posting it here for reference: https://play.nativescript.org/?id=9FxDMN2aIw0LzMcDiq100&template=play-ng
 etabakov
on 17 Oct 2017
etabakov
on 17 Oct 2017
The issue is fixed with the latest release of nativescript-ui-chart.
 DimitarTodorov
on 21 Aug 2018
DimitarTodorov
on 21 Aug 2018
I believe it is still relevant. I have an exact same issue in latest version Nativescript Angular chart
 DanielRitvas
on 17 Dec 2018
DanielRitvas
on 17 Dec 2018
I have the same issue . i am using this version - "nativescript-ui-chart": "^3.11.1"
 ppyoosuf
on 31 Mar 2019
ppyoosuf
on 31 Mar 2019
I still have the same problem with "nativescript-ui-chart": "^4.0.0". It only occurs on ios, android works fine.
 mhtghn
on 12 Apr 2019
mhtghn
on 12 Apr 2019
Seeing this issue as well using nativescript-ui-chart 4.0.2
 bowlesns
on 6 May 2019
bowlesns
on 6 May 2019
Seeing this still on nativescript-ui-chart ^4.0.2
 dhoffens
on 17 Jun 2019
dhoffens
on 17 Jun 2019
I'm also seeing this - can this issue be re-opened? @DimitarTodorov @ginev
 acrollet
on 27 Jun 2019
acrollet
on 27 Jun 2019
I'm seeing the issue on ^5.0.0
 jasoniem9246
on 30 Jul 2019
jasoniem9246
on 30 Jul 2019
Related issues
 sudhanshu-15
·
3Comments
sudhanshu-15
·
3Comments
 dali-gharbi
·
3Comments
dali-gharbi
·
3Comments
 felipebernardes
·
3Comments
felipebernardes
·
3Comments
 tsonevn
·
4Comments
tsonevn
·
4Comments
 spmamidi
·
3Comments
spmamidi
·
3Comments
Most helpful comment
I believe it is still relevant. I have an exact same issue in latest version Nativescript Angular chart